All Activity
- Past hour
-
Rain is rain and I’ll take what I can get. Always want more
-
Glad to see you are doing well, Ian. It’s also good to see CWG able to go independent and get away from the shackles and demise of the WaPo. I hope this will allow plenty of freedom to choose interesting articles and present info without pressures. I’m happy for you all and wish you success.
-
This round gave me some rain. Almost enough to get the ground wet under the trees. Almost.
-
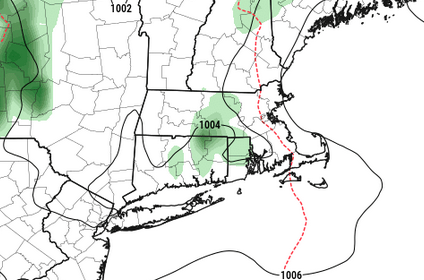
It'll be interesting to test that, the scale/extent/presence of BD over the next two days. Particularly on Friday... I see in the 00z GFS, ultra anal close-up OCD Rain Man inspection, that yeah ... there is a 'bulge' west in the PP over E-NE zones... perhaps as far W as ORH, but we're talking 1 to 2 whopping mb here really... if this is even real. 06z has this less so. I've noticed this about guidance, et al, over the last 5 to 7 years. They have improved significantly in the boundary layer where prior generations of modeling had trouble due to the termination of fields in boundary mechanics. They don't ...or couldn't really, process what is happening as the boundary - in this context, Earth - is approached. That's why they used to miss "tucks" in winter storms of lore, erode cold too fast ahead of warm fronts in general, all that cold lag winning shit. They are better at it, but ... it's like they're getting better assessment by over assessing. I see them create these kind of BD-esque looking features that don't exist, more than they ever used to... right around the same time they've all improved on BL handling in general. So... I've spent probably waaaay to much time on this subject this morning at this point, and it's probably a fool's errand considering the room is empty and no one's even reading this very sentence... hahaha. ...yeah
-
2026-2027 Super El Nino
LakePaste25 replied to Stormchaserchuck1's topic in Weather Forecasting and Discussion
Yeah, same reason we differentiate between 1991-2020 normals vs absolute records. When we want to know a thermal pattern it’s helpful to use the 30 yr normals, but it doesn’t make sense to say “this heatwave is the biggest temperature departure on record” because it’s pretty arbitrary. We use absolute values for that. -

2026-2027 Super El Nino
bluewave replied to Stormchaserchuck1's topic in Weather Forecasting and Discussion
Yeah, the big story is that these extreme ridges are making seasonal forecasting very challenging. There have been at least 16 instances of +10 or greater temperature months from December to March since December 2015. This is against the warmest 1991-2020 means which is even more impressive. In the old days these would happen much less frequently like in March 2012 and January 2006. When viewing the seasonal guidance in the fall there wasn’t any indication that these extreme months were in the forecast. I can remember looking at the EPS weeklies mid to late November 2015 and just seeing the stock El Niño forecasts of warm along the Northern Tier and cooler to the south. No indication at all of the historic +13.3 was incoming for places like NYC. A big part of that was the MJO 5 interacting with the super El Niño to produce the extreme December ridge in the East which wasn’t forecast. The other examples below really weren’t forecast well too far in advance. Some had extreme MJO event and others just stuck weather patterns like this past winter into spring. Dec…2015….NYC….+13.3 JAN…2017….BTV…..+11.0 FEB….2017….ORD….+10.3 FEB…..2018…ATL….+10.6 FEB….2019…MGM….+10.5 JAN….2020…YAM….+9.8 DEC….2021….DFW….+13.2 JAN….2023….DXR….+12.3 FEB….2023…..SSI…..+9.8 DEC….2023….INL…..+15.8 FEB…..2024….FAR…..+17.5 DEC….2024…..LND…..+11.3 DEC….2025….CPR…..+12.1 JAN….2026….RIW……+10.2 FEB…..2026….LND…..+11.3 MAR….2026….PHX…..+12.5 -
0.00” here through 10 days of June. Already hit 97 once with 100s progged next couple days. What a start to the month!
-
May gave me 170% of normal rainfall. The first 10 days of June have produced 7% of normal. The dominant westerly and northwesterly flow aloft has killed rainfall in the Valley. That rain-shadow is usually reliable.
-
Just heard on 1010 WINS that brides and grooms are hiring Etsy witches to cast weather spells in hopes of getting sunshine on their wedding day. Going to be a HOT summer boys and girls.
-
I mean they're spot on with this conceptually, and to an extent with the detailing but they're blowing it with the spatial layout - not without giving a reason why they thinking metro west and Fitchburg -Lawrence and up to Manchester are not part of the diagnostics, which they don't...? Oh, they do okay... I guess they're okay the way they handled - Confidence continues to increase that heat and humidity will pose a risk Thursday and Friday. As the warm front from Wednesday lifts further north, prolonged southwesterly flow will bring a surge of very hot and humid air, especially as 925mb temperatures increase to +27C Thursday and up to +30C Friday. Surface dewpoints are likely to top out in the upper 60s to low 70s, especially across interior MA and northern CT. These high dewpoints combined with temperatures climbing into the low to mid 90s will lead to heat index values approaching 100F Thursday and likely above 100F Friday across the CT River Valley, prompting Heat Advisories to be issued for northern CT and western MA from noon Thursday until 8PM Friday. especially away from the coastal plain. Heat Advisories may be expanded further east; however, a backdoor cold front is expected to drop into eastern MA sometime on Friday Not sure I agree synoptically..I admit to a flaccid PP but I don't see a very obvious BD mechanism, ether.
-
76 at 8:20 am isn't bad. Sat's a grungy mess though. Partly to mostly sunny for now but there's convective debris in heavier patch work lurking near-by west, inching east. The sun may alter the sounding such that some of that starts to vanquish - not uncommon - but we'll see. Heat over the next 3 days is going to be battling a bit of cloud pollution though. Most guidance 700, 500, 300 mb level RH fields are contaminated with occasional 70%.
-

2026-2027 Super El Nino
40/70 Benchmark replied to Stormchaserchuck1's topic in Weather Forecasting and Discussion
It's too reductive and narrow in scope...it's fine to use it for historical ranking as long you understand exactly what it is conveying and why...otherwise, this is akin to ranking each winter by NAO or PNA....sometimes it works, but often times it doesn't. -
2026-2027 Super El Nino
40/70 Benchmark replied to Stormchaserchuck1's topic in Weather Forecasting and Discussion
Largely a weenie fallacy that the collapse of ENSO will "save us"...DT likes to clinging to that crap and always ends up backtracking at the last moment. -
364 kWh for June so far. 986 for May.
-
2026-2027 Super El Nino
40/70 Benchmark replied to Stormchaserchuck1's topic in Weather Forecasting and Discussion
In the traditional sense per ONI, but we have had some pretty robust cool ENSO seasonal signatures.......these RONI lags are a signature of the warming west Pacific, which constructively interferes with cool ENSO and negatively interferes with warm ENSO expression around the hemisphere...more specifically, while the ridge over North America is accentuated, the GOA low is blunted. It's this inconsistency that tends to mask the warm ENSO expression, while the traditional ONI fails to adequately capture the magnitude of the cool ENSO expression via the enhanced Aleutian ridge. -
How are your solar panels doing?
-
just between you and me ( and the social media'sphere heh)...sometimes I'm wondering if learning AI is being used at NWS offices, and it's not quite up to the task just yet. Like it still needs a helicopter teacher. I've noticed a lot of those kind of hard to explain head scratch nuances. There's not as many in urgent more/obviously significant situations, which makes sense... these latter types are more human eye required? I could see this scenario being "unchecked" yet; in need of doing so. But I'm also a sci fi writer in another life so -
- Today
-
Agree. Headline does not make sense.
-
Advisory level headline heat tomorrow and Friday ...cloud depending. I imagine the current layout gets extended into metro west of Boston and up the rt 3 corridor toward MHT eventually. Not seeing why Greenfield MA is going to be warmer than the Framingham MA to Manchester NH axis, but we'll see
-
2026-2027 Super El Nino
40/70 Benchmark replied to Stormchaserchuck1's topic in Weather Forecasting and Discussion
Yea, RONI measures the associated mid latitude response relative to what is expected per ENSO climo....ie while one aspect of el Nino (Canadian ridge) may be well expressed, another be less so (Aleutian low), thus the RONI will still lag the ONI. Again, not to be redundant, but it is our innate proclivity as humans to be too binary with these concepts in our thought process. -
Dec 92 was a whiff at Gardiner, where we then lived - clouds, wind (thousands of white ash seedlings that spring) but no flakes. March 01 is the 2nd snowiest (55.5") of any month I've measured, trailing only the 61.5" of Dec 1976 in Fort Kent. The early month big dog was almost 20 hours of steady 0.5"/hr snow on 20-30 mph wind, but the capper was the pair of post-equinox storms that totaled 35" and boosted the pack to 48" on the 31st, deepest I've seen that late in the season. Another even stronger storm had been forecast for 4/1, but it went east and crushed Newfoundland.
-
mesoanalysis showing over 4ksbcape in n il this afternoon
-
2026-2027 Super El Nino
bluewave replied to Stormchaserchuck1's topic in Weather Forecasting and Discussion
Yeah, there is an overlap going on so the line where one starts and the other ends may not be that clear. All the mid-latitude ridges between 30N and 60N have been getting stronger regardless of El Niño or La Niña. So perhaps that’s why the Aleutian low and mid-Atlantic and Southeast lows during recent super El Niño events have been getting weaker than in the past. Plus the weekly to seasonal guidance has been missing this ridge expansion in their long range forecasts. So we keep getting all these near to 10°+departure warm months close to the core of the ridges that aren’t being forecast beyond 15 days. -
So effing boring
-
0.10”. Which brings me to 0.10” on the month.