All Activity
- Past hour
-
What the hell is going on here?
-
Picking back up, moderate snow now. Might break 1”
-
SNH getting lit up.
-
Yeah. Better now. Coating
-

Central PA Spring 2026 Discussion/Obs Thread
Mount Joy Snowman replied to Voyager's topic in Upstate New York/Pennsylvania
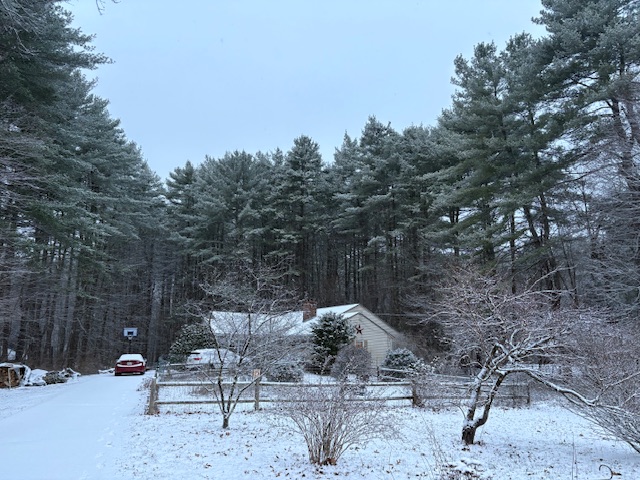
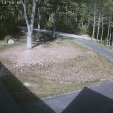
Temp was 41 and dropping when I left the house. Had beautiful clear tequila sunrise skies just to my east and a thick cloud deck just to my west. A couple chilly ones ahead and then what could be a spectacular weekend. Carry on. -
Well that was fun while it lasted. Saw something out of the corner of my eye and looked and it was snow lol. Just enough for a little bit to stick to the grass, not much though. Down to a very light flurry now
-
Snowing light to mod here now everything whitening up
-
29° -SN .50”
-
Persistent NW wind keeping the temps from dropping. IAD went from 39 to 46 in the last hour!
-
Snowing pretty good out.
-
Can I interest you in some, “Absolutely not” with a side of “NO”?
-
Flurries. Yawn
-
Linked the Geological Society of London's 2021 review article on climate change in the geological record. Observations from the geological record show that atmospheric CO2 concentrations are now at their highest levels in at least the past 3 million years. Furthermore, the current speed of human-induced CO2 change and warming is nearly without precedent in the entire geological record, with the only known exception being the instantaneous, meteorite-induced event that caused the extinction of non-bird-like dinosaurs 66 million years ago. https://www.lyellcollection.org/doi/full/10.1144/jgs2020-239
-

Central PA Spring 2026 Discussion/Obs Thread
mahantango#1 replied to Voyager's topic in Upstate New York/Pennsylvania
Hazardous Weather Outlook National Weather Service State College PA 303 AM EDT Tue Apr 7 2026 PAZ026>028-035-036-049>052-056-057-059-063>066-080715- Huntingdon-Mifflin-Juniata-Fulton-Franklin-Union-Snyder-Montour- Northumberland-Perry-Dauphin-Lebanon-Cumberland-Adams-York-Lancaster- 303 AM EDT Tue Apr 7 2026 ...FREEZE WARNING IN EFFECT FROM MIDNIGHT TONIGHT TO 9 AM EDT WEDNESDAY... ...FREEZE WATCH IN EFFECT FROM LATE WEDNESDAY NIGHT THROUGH THURSDAY MORNING... This Hazardous Weather Outlook is for central Pennsylvania. .DAY ONE...Today and tonight. Please listen to NOAA Weather Radio or go to weather.gov/StateCollege on the internet for more information about the following hazards. Freeze Warning. .DAYS TWO THROUGH SEVEN...Wednesday through Monday. Please listen to NOAA Weather Radio or go to weather.gov/StateCollege on the internet for more information about the following hazards. Freeze Warning. Freeze Watch. -
Developing consensus is key part of the scientific process. Below is the leading paragraph of the Wikipedia entry on scientific consensus. Scientists are well aware of the scientific consensus in their field. They have to know the current state of knowledge to advance further. In the case of climate change, with high impact and a wide range of scientific disciplines, there are also governmental and technical organization activity to document the scientific consensus. IPCC is the leading example but there are many others. I encourage you to look at IPCC reports (link below). Most of our debates on this forum can be traced back to a lack of awareness of the scientific consensus. Often we are arguing about things that were settled decades ago. Scientific consensus is the collective judgment, position, and opinion of the vast majority of active, qualified experts on a conclusion in a specific scientific discipline.[1] Scientific consensus results from the self-correcting scientific process of peer review, replication of the event through the scientific method, scholarly debate, meta-analysis, and publication of high-quality review articles, monographs, or guidelines in reputable books and journals to establish facts and durable knowledge about the topic.[2][3] https://en.wikipedia.org/wiki/Scientific_consensus https://www.ipcc.ch/assessment-report/ar6/
-
Today Snow showers likely before 2pm, then scattered rain showers. Cloudy, with a high near 43. Calm wind becoming northwest 5 to 7 mph in the afternoon. Winds could gust as high as 23 mph. Chance of precipitation is 70%. Total daytime snow accumulation of 1 to 2 inches possible.
- Today
-
Snowing lightly in Newtonville too.
-
Euro thru the end of the run. Going to get crispy here fast.
-
We snow!
-
Yeah but whats the cost for 150' of gutter? Sent from my SM-S921U using Tapatalk
-

2026-2027 El Nino
snowman19 replied to Stormchaserchuck1's topic in Weather Forecasting and Discussion
-

E PA/NJ/DE Spring 2026 Obs/Discussion
RedSky replied to PhiEaglesfan712's topic in Philadelphia Region
Temperatures will be in freeze territory Wednesday morning one week from last frost date -

Central PA Spring 2026 Discussion/Obs Thread
Jns2183 replied to Voyager's topic in Upstate New York/Pennsylvania
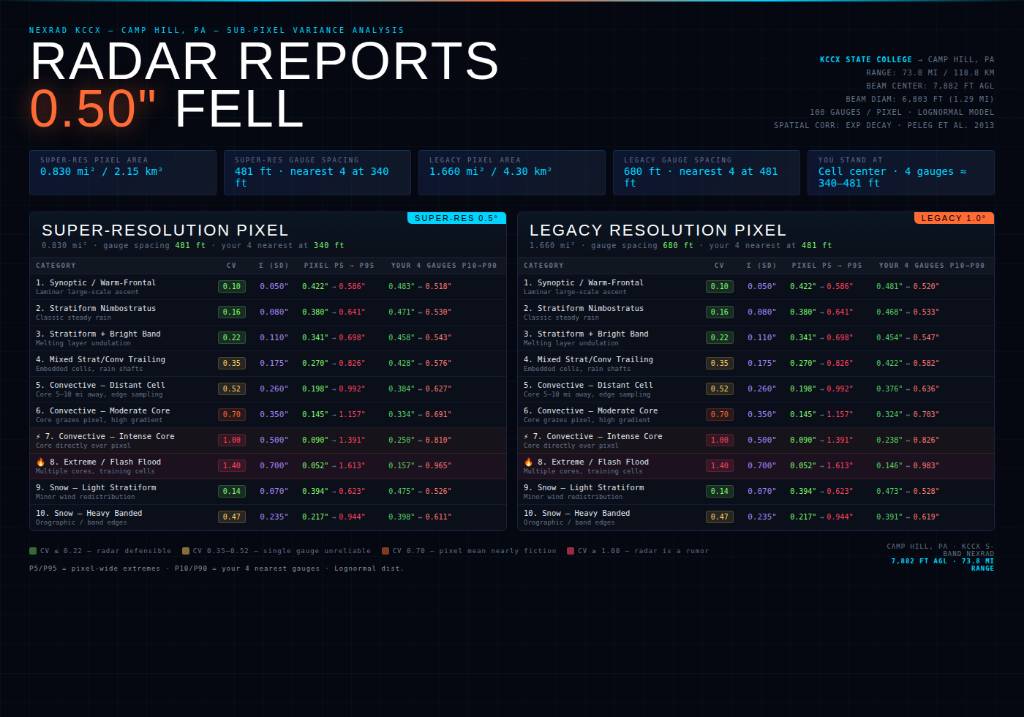
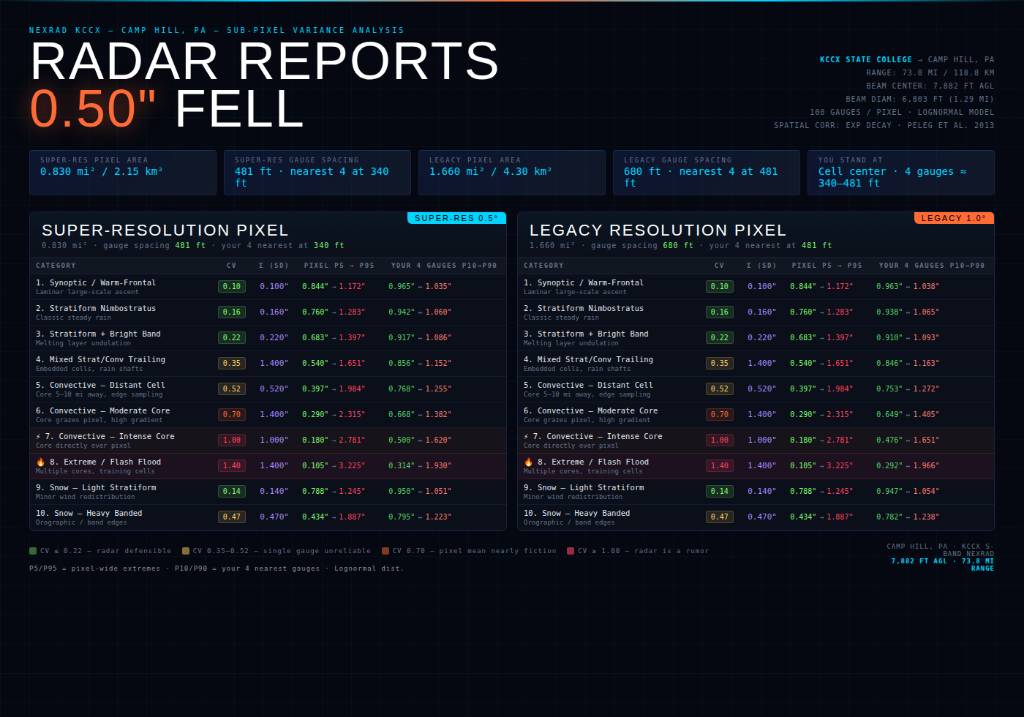
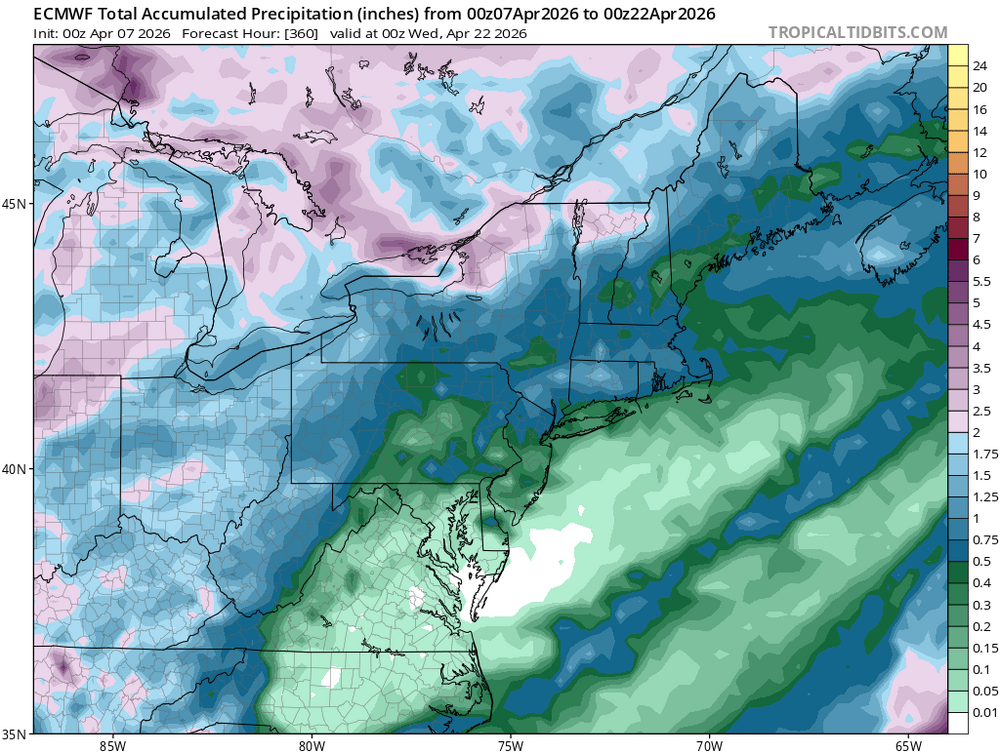
My Magnus Opus of why I can never be mad at preceiptitation reports after a big storms.. We've all been there. NEXRAD shows 0.50" for your pixel. Your CoCoRaHS gauge reads 0.22". Your neighbor two blocks over posts 0.81". Both of you are right. The radar might also be right. Here's why, and why it gets genuinely alarming during intense convection. The Geometry First I'm 73.8 miles from KCCX at State College. At that range, the 1° beam has expanded to 6,803 feet in diameter — that's 1.29 miles across. The center of that beam is floating 7,882 feet above my roof. The super-resolution pixel covering my house is 0.830 square miles / 2.15 km². The legacy pixel was 1.660 square miles / 4.30 km². That single dBZ value stamped on that pixel represents the average backscatter of a volume of air roughly the size of 12 Disneylands hovering a mile and a half above the ground. Now imagine 100 top-of-the-line rain gauges evenly distributed across that pixel. Super-res spacing works out to one gauge every 481 feet. I stand dead-center in my grid cell. By Pythagoras, my four nearest gauges are at the corners — each 340 feet away from me. Here's Where It Gets Uncomfortable For well-behaved stratiform rain — your warm-frontal overrunning, your classic nimbostratus — everything is fine. CV of 0.10 to 0.16. My four nearest gauges within a few hundredths of each other. Radar is defensible. Life is good. But bump up into Category 7 — intense convective core directly over the pixel — and the math falls apart spectacularly. Radar reports 0.50". CV = 1.00. Standard deviation = 0.50". Lognormal distribution gives a pixel-wide range of 0.090" to 1.391" at the P5/P95 level. That's a 15:1 spread across my 0.830 square mile pixel, between gauges that are less than half a mile from each other. But here's the part that genuinely made me sit back: my four nearest gauges — 340 feet away from me, about the length of a city block — have a realistic P10/P90 spread of 0.250" to 0.810". Three-to-one variation between gauges I can practically see from my porch. Both are physically correct measurements of the same event. Scale that up to Category 8 — extreme/flash flood/training cells — and it becomes almost philosophical. Radar reports 0.50". Pixel range P5/P95: 0.052" to 1.613". That's a 31:1 ratio. My four nearest gauges: 0.157" to 0.965". Six-to-one. The gauge 340 feet north of me reads under two tenths. The gauge 340 feet east reads close to an inch. The radar says half an inch. Every single instrument is functioning perfectly. At 1.00" reported by the radar the numbers get worse: Cat 7 gives my nearest four a spread of 0.500" to 1.620" and Cat 8 gives 0.314" to 1.930". The gauge closest to me physically could read less than a third of an inch while the one a city block away reads nearly two inches. During the same event. At the same time. Why This Matters for Verification Work This isn't a measurement error problem. This isn't instrument quality. This is the fundamental physics of convective precipitation at sub-kilometer scales, documented by Peleg et al. (2013) with a dense gauge network and confirmed repeatedly in the literature. Rainfall within a single radar pixel during convection can vary by over 100% — and that finding came from a network covering a smaller area than my NEXRAD pixel at 73.8 miles. When someone posts their CoCoRaHS total and it's half what radar showed during a summer storm, the correct response isn't "your gauge is off." The correct response is "yes, that is entirely expected and physically consistent with everything we know about convective precipitation structure." The radar isn't wrong. Your gauge isn't wrong. The atmosphere just doesn't care about our need for tidy single-number summaries. The only honest statement you can make about precipitation during a Cat 7/8 event with a single gauge is: this is what fell at this exact point. Full stop. Extrapolating to even the next block over is an act of faith, not measurement. Methodology: Lognormal distribution fit to literature CV values by precip type (Ciach & Krajewski 1999, 2006; Peleg et al. 2013; Jensen & Pedersen 2005). Local near-gauge CV compressed by exponential spatial correlation model. KCCX beam geometry calculated using 4/3 Earth radius refraction. All pixel areas computed from actual Camp Hill–KCCX range of 73.8 miles. Sent from my SM-S731U using Tapatalk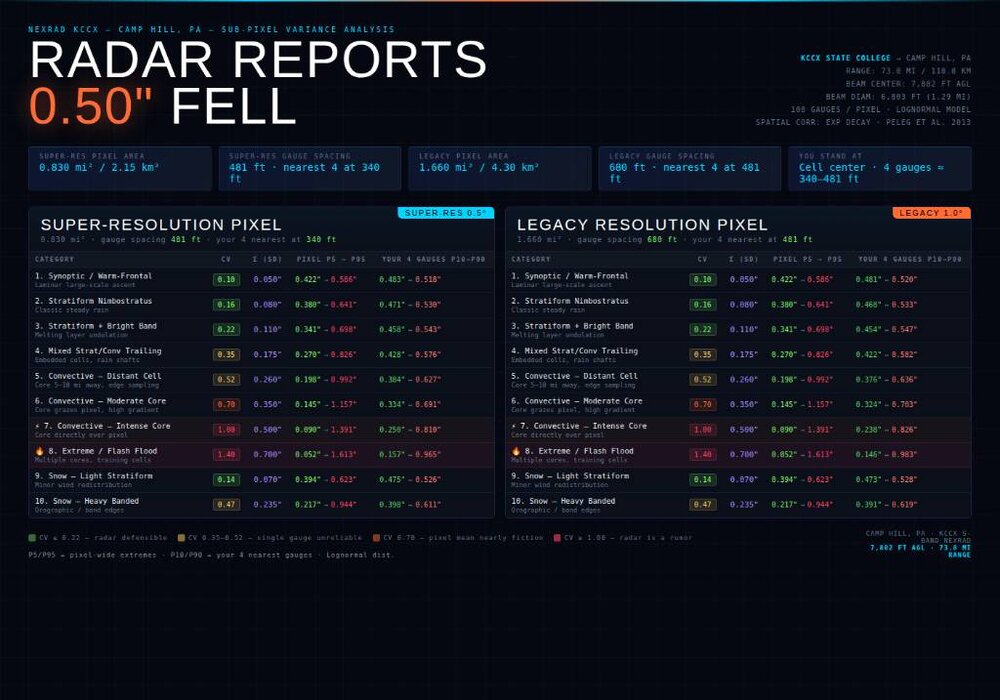

-
Being that the current OISST dailies suggest that RONI is likely ~-0.3 to -0.4, it is a very tall order to get the full April averaged RONI to rise all of the way to +0.6, which is what this BoM run has. We’ll see what the very strong WWB/TC triplets are able to do. The rate of April warming would probably have to be well beyond record highs to get April RONI up to +0.6. The daily RONIs may have to approach +1.5 by April 30th!! I don’t see that being realistic at all.

.thumb.png.4150b06c63a21f61052e47a612bf1818.png)