donsutherland1
-
Posts
23,760 -
Joined
Content Type
Profiles
Blogs
Forums
American Weather
Media Demo
Store
Gallery
Everything posted by donsutherland1
-
2025-2026 ENSO
donsutherland1 replied to 40/70 Benchmark's topic in Weather Forecasting and Discussion
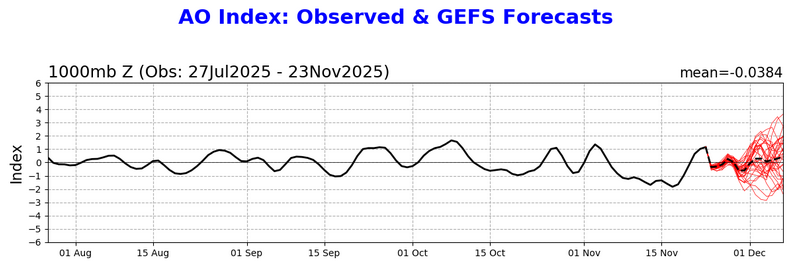
This morning revealed an unwelcome, GEFS AO forecast. If it holds, it could have implications beyond the first week of December. The base case is a generally negative AO at least to start December. But the GEFS has grown more aggressive with the AO+ scenario, with the AO reaching/exceeding +1.000 near the end of the first week in December. For now, things still remain on course for places like the Upper Midwest, Great Lakes, and central or northern New England in terms of cold an snow through at least the first 7-10 days of December. Severe cold still appears unlikely. The question afterward concerns whether the pattern will break down near mid-month or late December. The AO+ development would argue for a faster breakdown. I will need to see more data on this, but the risk of a faster breakdown has increased further since yesterday. Let's see where the GEFS and EPS are in a few days. After all, it is November 24 and model skill is weak beyond 10-14 days. What about the SSW? As @40/70 Benchmark@bluewave@snowman19 have noted on numerous occasions, it is likely to be a reflection event. The late November cold shot and first week of December developments likely have no connection to the SSW. Whether there would be the development/redevelopment or reinforcement of blocking was the wild card. Considering the nature of this event, it increasingly appears that non-stratospheric factors will play the predominant role.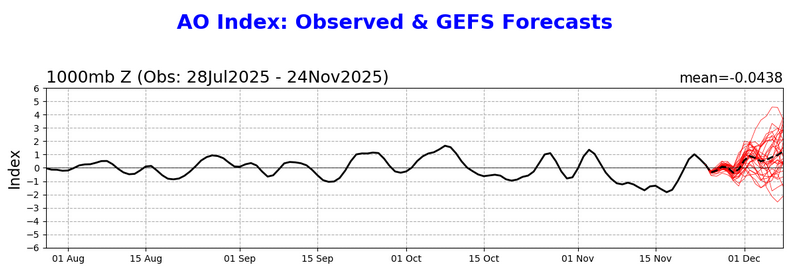
-
2025-2026 ENSO
donsutherland1 replied to 40/70 Benchmark's topic in Weather Forecasting and Discussion
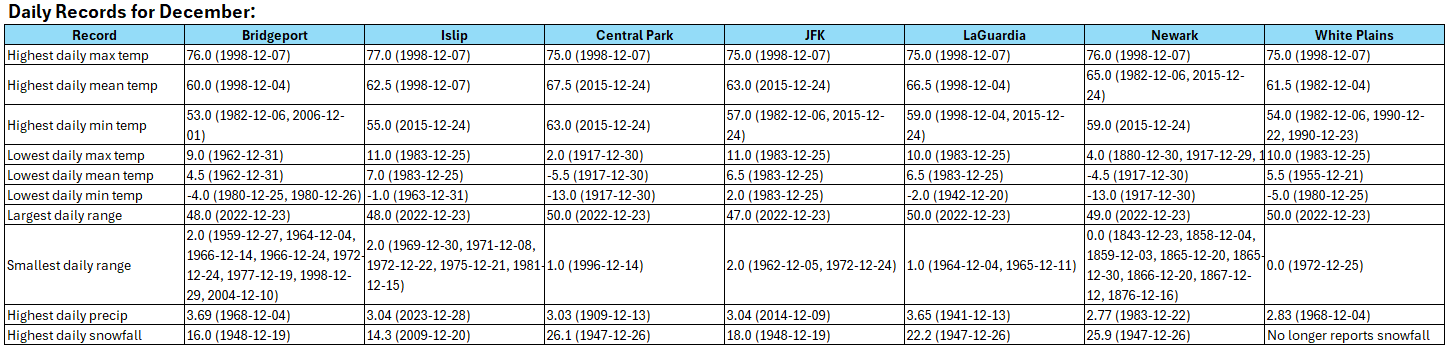
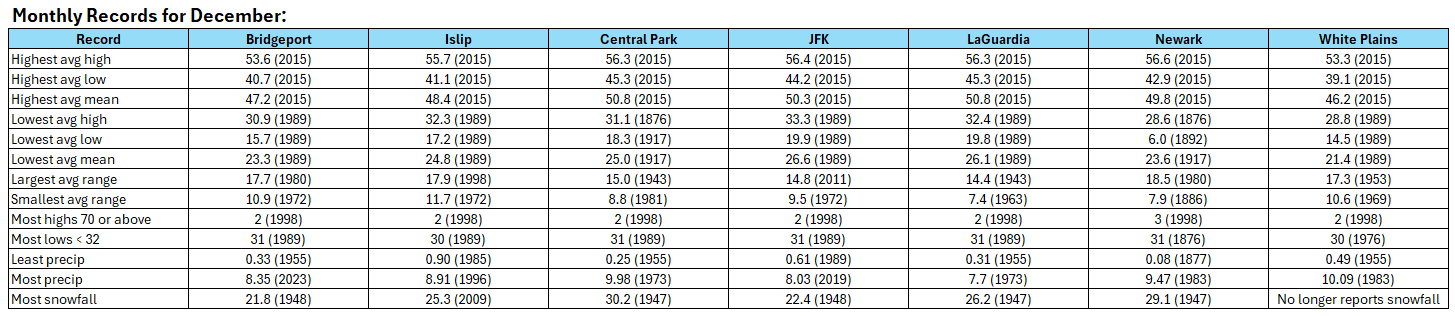
If you are looking for snowfall totals, here are select NYC-area snowfall totals.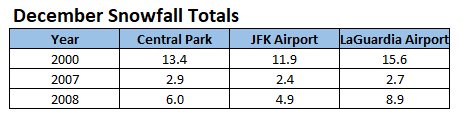
-
Of course, there's an element of luck to it.
-
LGA's streak continues. Unfortunately, LGA reported "M" for snow on January 11th (0.02" qpf). There's no question that the streak continues there. On a separate note, there are occasional data issues. For example, on October 2, 2025, JFK had a high of 66° (hourly values). No location in the NYC area had highs in the 70s. JFK's high temperature is listed as 72°.
-
From xmACIS. We're years away from the 3" record (289 days vs. record of 1,110 days); 6" record (1,395 days vs. record of 2,572 days); and, 10" record (1,757 days vs. record of 3,266 days). https://xmacis.rcc-acis.org/
-
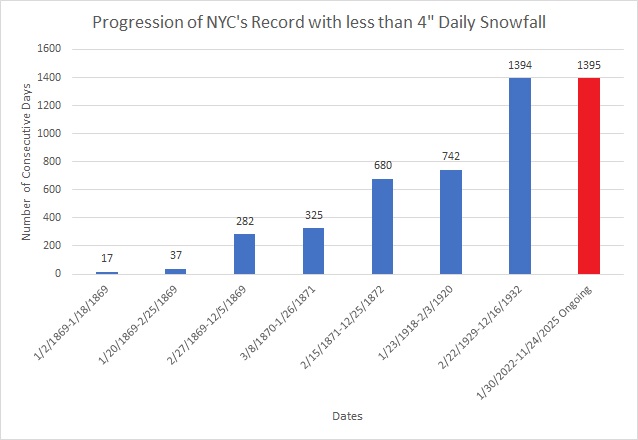
Today will be New York City's (Central Park) 1,395th consecutive day without a 4" (10.2 cm) or above daily snowfall. That will break the record of 1,394 days that was set during February 22, 1929 through December 16, 1932.
-
A generally milder than normal pattern will likely continue through next Wednesday when a system could bring a period of rain. However, exceptional warmth appears unlikely. The closing days of November will likely turn colder. There is potential for New York City's Central Park to experience its first freeze of 2025. The 1991-2020 normal first data is November 21. The 1961-1990 baseline was November 11. Last winter's first freeze occurred on November 30. The opening days of December will turn milder. However, colder conditions could begin to develop during the second half of that week and continue through the second week of December. Severe cold appears unlikely through at least the first 10 days of December. Afterward, the pattern evolution will depend, in part, on how the imminent stratospheric warming event propagates. Meanwhile, today will be Central Park's 1,394th consecutive day without daily snowfall of 4" or more. That ties the record of 1,394 days was set during February 22, 1929 through December 16, 1932. That stretch ended with 6.7" daily snowfall on December 17, 1932. The ENSO Region 1+2 anomaly was -0.7°C and the Region 3.4 anomaly was -0.7°C for the week centered around November 12. For the past six weeks, the ENSO Region 1+2 anomaly has averaged -0.16°C and the ENSO Region 3.4 anomaly has averaged -0.65°C. La Niña conditions will likely continue through at least mid-winter. The SOI was +38.17 today. The preliminary Arctic Oscillation (AO) was +0.805 today. Based on sensitivity analysis applied to the latest guidance, there is an implied 85% probability that New York City will have a cooler than normal November (1991-2020 normal). November will likely finish with a mean temperature near 46.7° (1.3° below normal). Supplemental Information: The projected mean would be 1.0° below the 1981-2010 normal monthly value.
-
2025-2026 ENSO
donsutherland1 replied to 40/70 Benchmark's topic in Weather Forecasting and Discussion
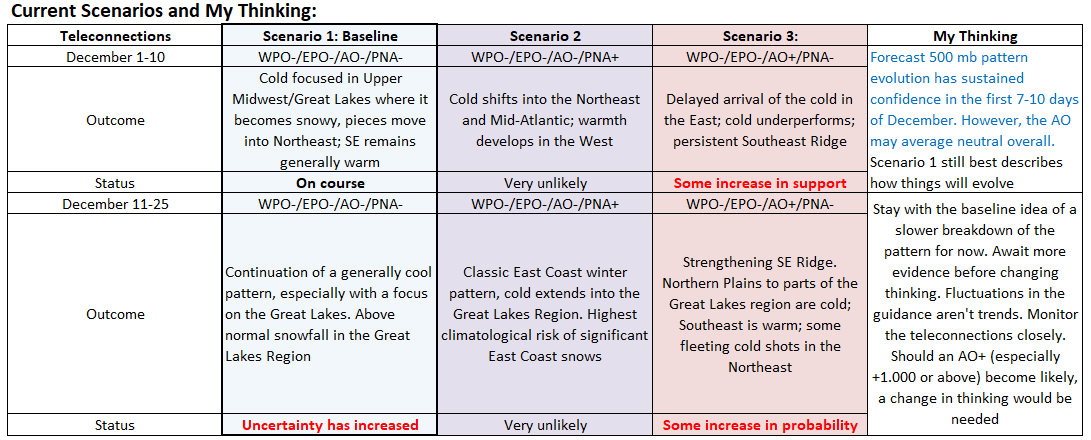
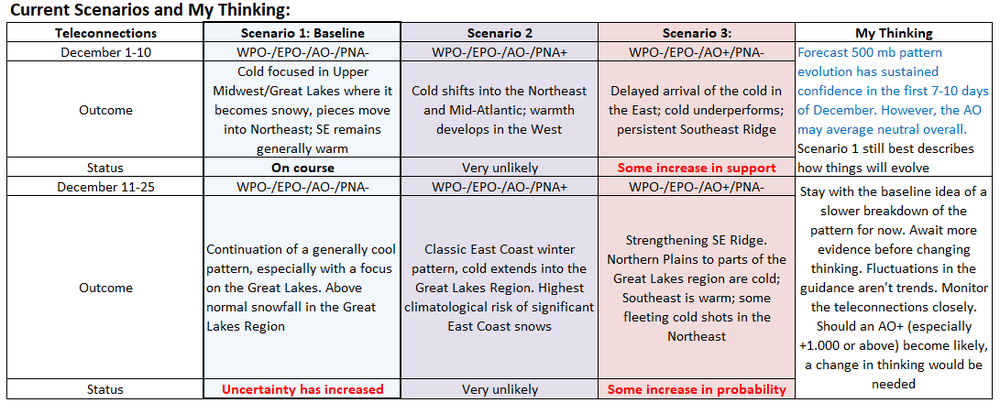
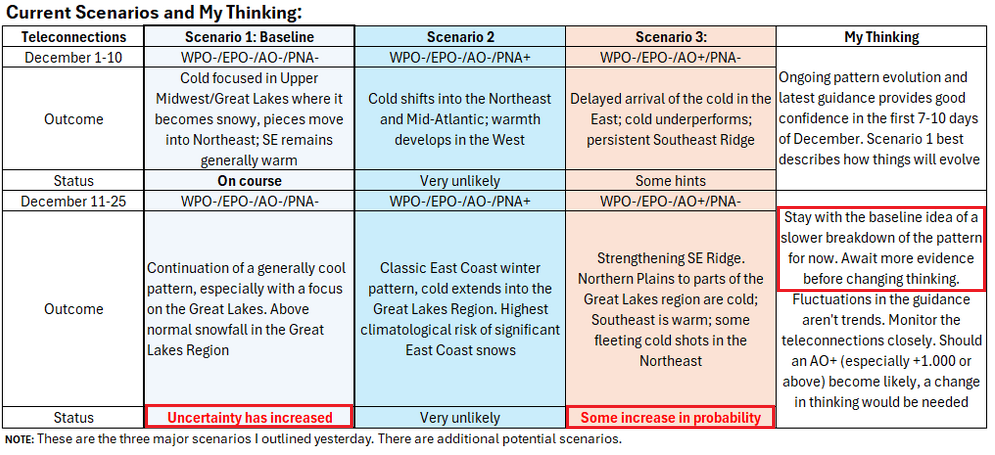
The CFSv2 has now moved into the early stages of its skillful range. Its monthly forecast for December is below. I assessed this idea against the currently expected state of the teleconnections. ENSO was omitted, as the sample size became so small that is was useless (n=2). Based on the expected predominant state of the teleconnections for December (WPO-/EPO-/PNA- and AO neutral) it appears reasonable. The AO should start negative but could go positive as December progresses based on the current guidance. The second half outcome will depend on whether or not the stratospheric warming event propagates to the troposphere to promote a redevelopment or persistence of AO blocking. So, for purposes of conservatism, I treated the AO as neutral (monthly average above -0.50 but below +0.50) for looking at the monthly CFSv2 idea. Should an AO+ regime develop (SSW fails to propagate in a fashion that promotes AO blocking), warm anomalies could cover much of the Eastern Seaboard with the exception of central or northern New England and have the risk of spreading into at least the Ohio Valley and perhaps farther westward depending on the strength of the AO+. For now, this is an identified risk, but not the most likely outcome. On the other hand, should strong AO blocking develop, most of the eastern half of the U.S. would likely see cold anomalies. This scenario would also have the highest probability of seeing a strong Arctic outbreak reach the East Coast. Given the present guidance, this seems to be less likely than an earlier breakdown of the AO-. But the stratospheric warming event is a wildcard and how such events ultimately play out over long timeframes is not a high-skill undertaking. It should also be noted that teleconnections cannot be forecast skillfully beyond 10-14 days. All in all, the combination of the CFSv2 and teleconnections highlights the Great Lakes Region and Upper Midwest as having the greatest probability of experiencing cold anomalies. They also highlight the Great Lakes Region as having the highest probability of above normal monthly snowfall. As for my thinking using the framework I illustrated yesterday, I've highlighted what has changed in my thinking overnight in blue. The emergence of a neutral AO on the guidance was noted (there's a very large spread among the ensemble members). No changes were made beyond December 10 as signals remain mixed and there remains no clear signal for a change.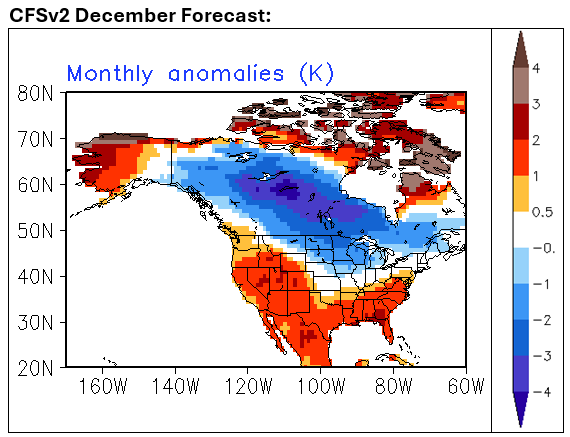
-
A generally milder than normal pattern will likely continue through next Wednesday. However, exceptional warmth appears unlikely. The closing days of November will likely turn colder. There is potential for New York City's Central Park to experience its first freeze of 2025. The 1991-2020 normal first data is November 21. The 1961-1990 baseline was November 11. Last winter's first freeze occurred on November 30. The opening days of December will turn milder. However, colder conditions could begin to develop during the second half of that week and continue through the second week of December. Severe cold appears unlikely through at least the first 10 days of December. Afterward, the pattern evolution will depend, in part, on how the imminent stratospheric warming event propagates. Meanwhile, today will be Central Park's 1,393rd consecutive day without daily snowfall of 4" or more. The record of 1,394 days was set during February 22, 1929 through December 16, 1932. That stretch ended with 6.7" daily snowfall on December 17, 1932. The ENSO Region 1+2 anomaly was -0.7°C and the Region 3.4 anomaly was -0.7°C for the week centered around November 12. For the past six weeks, the ENSO Region 1+2 anomaly has averaged -0.16°C and the ENSO Region 3.4 anomaly has averaged -0.65°C. La Niña conditions will likely continue through at least mid-winter. The SOI was +31.56 today. The preliminary Arctic Oscillation (AO) was +1.436 today. Based on sensitivity analysis applied to the latest guidance, there is an implied 86% probability that New York City will have a cooler than normal November (1991-2020 normal). November will likely finish with a mean temperature near 46.6° (1.4° below normal). Supplemental Information: The projected mean would be 1.1° below the 1981-2010 normal monthly value.
-
2025-2026 ENSO
donsutherland1 replied to 40/70 Benchmark's topic in Weather Forecasting and Discussion
That’s true. Unfortunately, there’s no daily TNH index to quantify things. -
2025-2026 ENSO
donsutherland1 replied to 40/70 Benchmark's topic in Weather Forecasting and Discussion
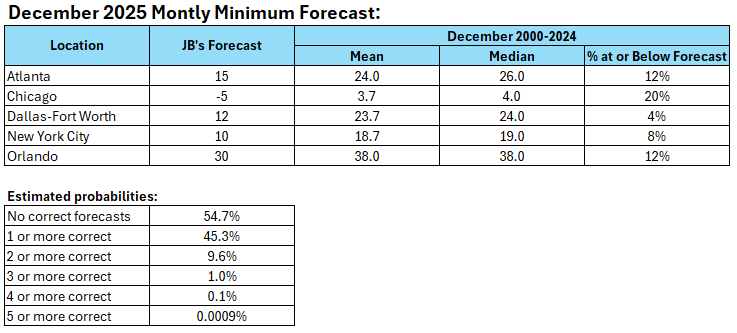
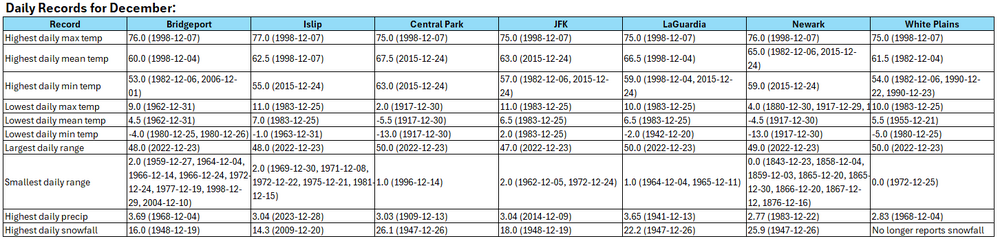
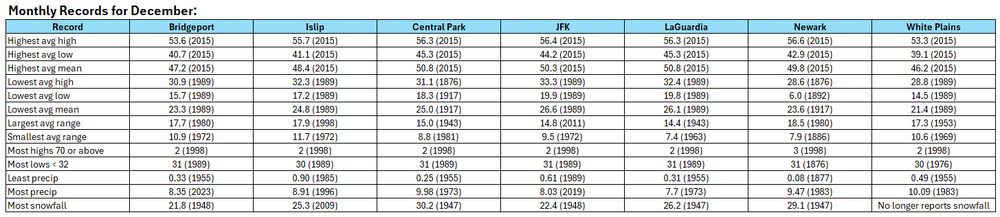
Below is an illustration of an extreme forecast that is being pushed on Twitter/X despite the lack of evidence to actually support the idea (e.g., small pool of deep cold in the Northern Hemisphere) and the lack of skill in guidance from this far out: "Lower Rio Grande Valley" doesn't specify a specific point or location for purposes of verification, so it will be excluded. Here's the forecast coupled with December 2000-2024 statistics: This illustrative example will be verified at the end of December. Given the estimated probabilities for various outcomes, the odds are strongly against the extreme forecast verifying in more than one of the above locations.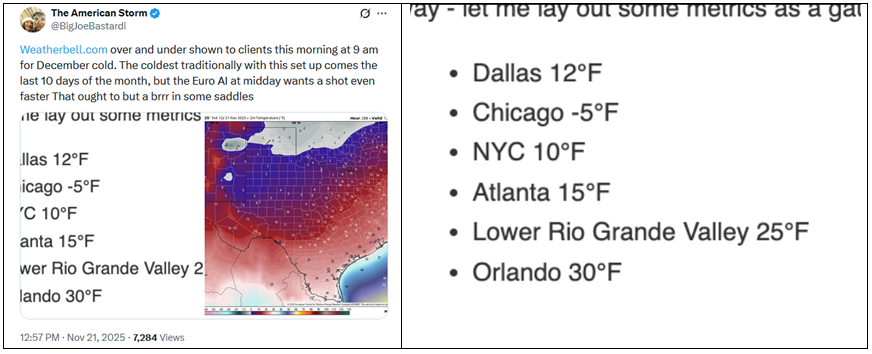
-
2025-2026 ENSO
donsutherland1 replied to 40/70 Benchmark's topic in Weather Forecasting and Discussion
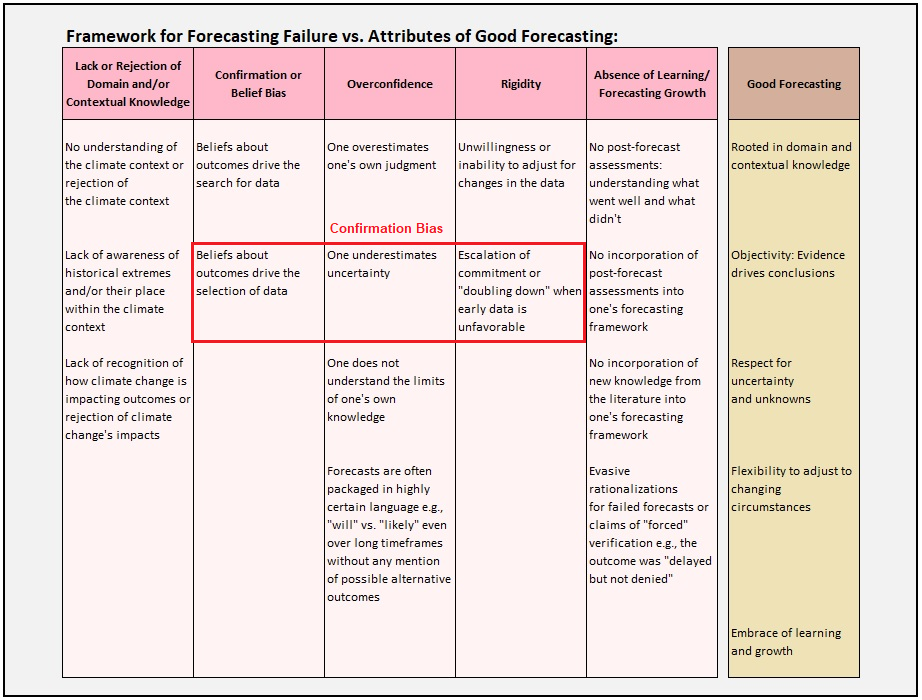
Several things: 1) There remains a lot of uncertainty how the stratospheric warming will propagate. Propagation could be a big factor in prolonging/strengthening or bringing back Atlantic blocking. 2) Even as stratospheric warming often (not always) propagates favorably to build or prolong/strengthen Atlantic blocking, one should not immediately dismiss hints of evidence to the contrary. Confirmation bias is bad for forecasting. Such evidence exists e.g., here's the AO forecast from the EPS 46-day forecast: Although the below table talks about considering climate change-related impacts on forecasts, I highlighted the section that relates to how and why confirmation bias skews forecasts: A systematic forecasting framework allows one to acknowledge such evidence while avoiding rash decisions from model noise. As I don't have a crystal ball to have 100% confidence in whether or not the above AO forecast will verify, I have made a note to continue to monitor developments. Needless to say, there is more to it than such a framework. Each scenario has clusters of outcomes (not discussed above). It should be noted that such frameworks don't guarantee accuracy, but they do reduce the risks that can otherwise lead to bad forecasts, especially when one is dealing with timeframes over which model skill is limited or worse. Finally, the 11/22 12z guidance has reaffirmed the December 1-10 idea. Indeed, more than half of the 11/22 0z EPS ensembles suggested 1" or more snow in Detroit and Toronto (a good signal for measurable snow prospects from this far out). I expect those figures to hold up with the 12z cycle.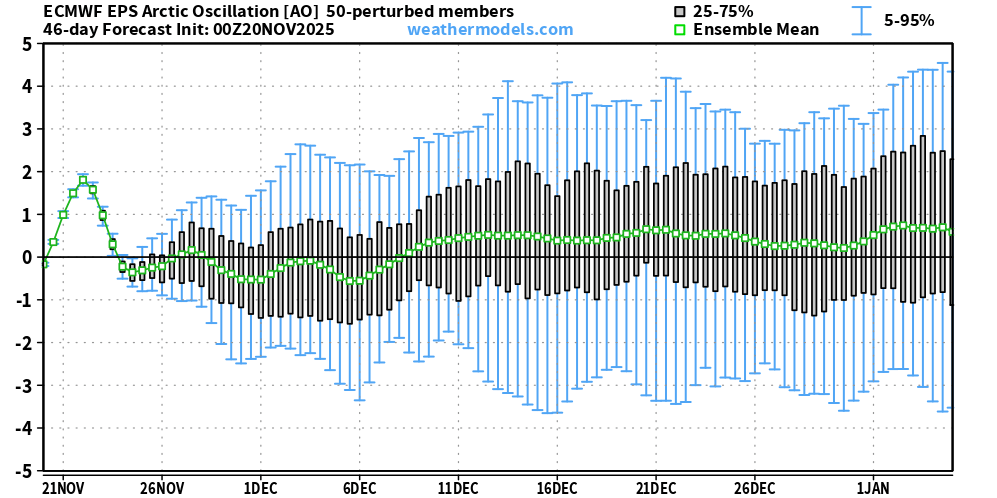
-
2025-2026 ENSO
donsutherland1 replied to 40/70 Benchmark's topic in Weather Forecasting and Discussion
Yes. I used a full progression through Phase 2 for fuller insight. I plan to take a closer look at the MJO cases. -
2025-2026 ENSO
donsutherland1 replied to 40/70 Benchmark's topic in Weather Forecasting and Discussion
The teleconnection idea (predominant state during the periods) is based on the GEFS and EPS, including the weekly EPS ideas. That's why I noted that the probability for Scenario 3 has increased somewhat, as some of the guidance now moves toward a more robust AO+. The consensus remains a persistent PNA- (closer to neutral but not positive). Here's the latest GEFS forecast going into December (preponderance of ensemble members show a PNA<0):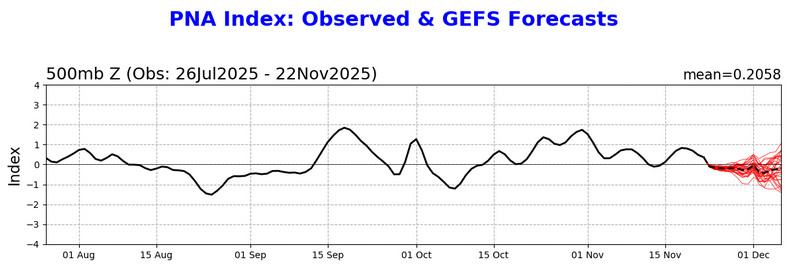
-
2025-2026 ENSO
donsutherland1 replied to 40/70 Benchmark's topic in Weather Forecasting and Discussion
And going beyond the lack of skill in MJO forecasts beyond 10 days, other factors can overwhelm it. Sometimes even high amplitude passages through Phase 8 during passage through Phases 7-2 don't generate a wintry response in North America. December 1-12, 1990 is one example. March 1-25, 2023 is another example, even as it was an off-the-scales passage through Phase 8.

-
2025-2026 ENSO
donsutherland1 replied to 40/70 Benchmark's topic in Weather Forecasting and Discussion
Here's my thinking based on the latest guidance and some of the longer-range guidance. I focus on what I believe are the three biggest potential scenarios for much of December.
-
2025-2026 ENSO
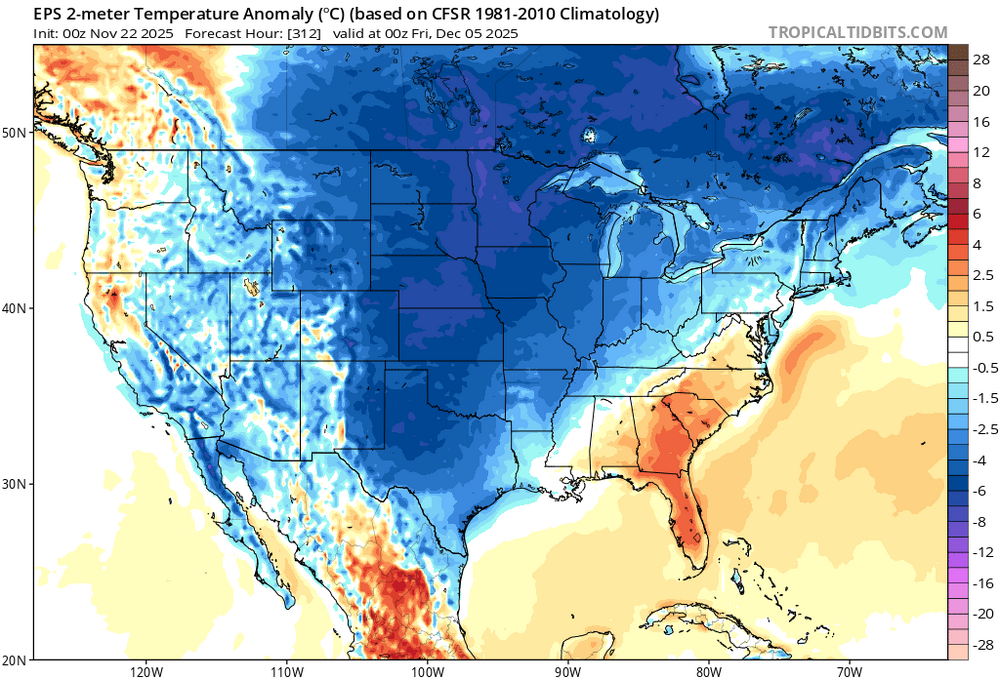
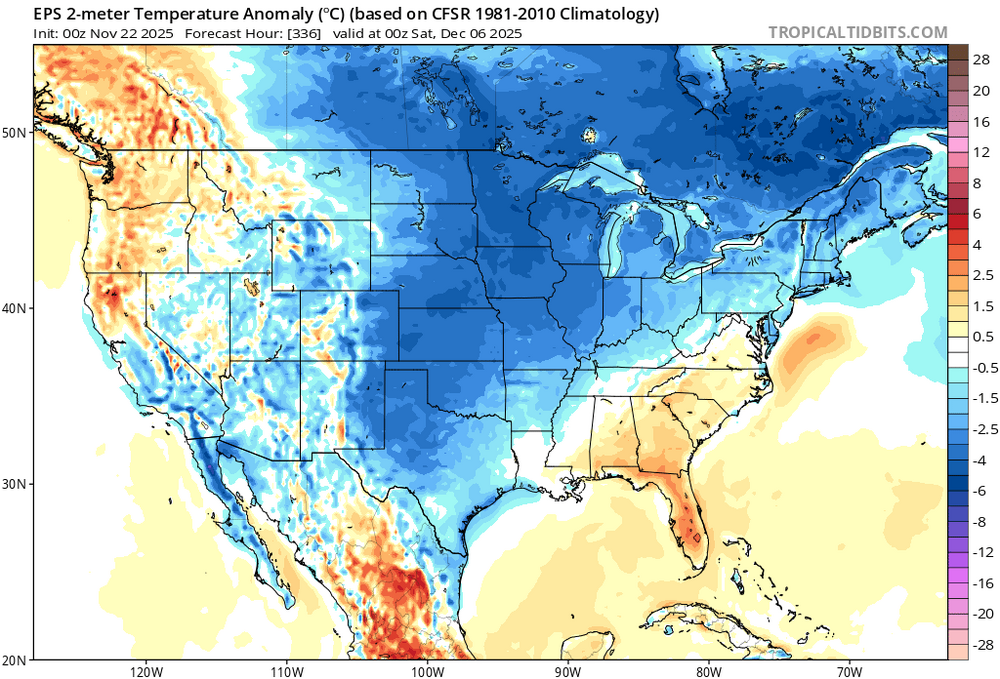
donsutherland1 replied to 40/70 Benchmark's topic in Weather Forecasting and Discussion
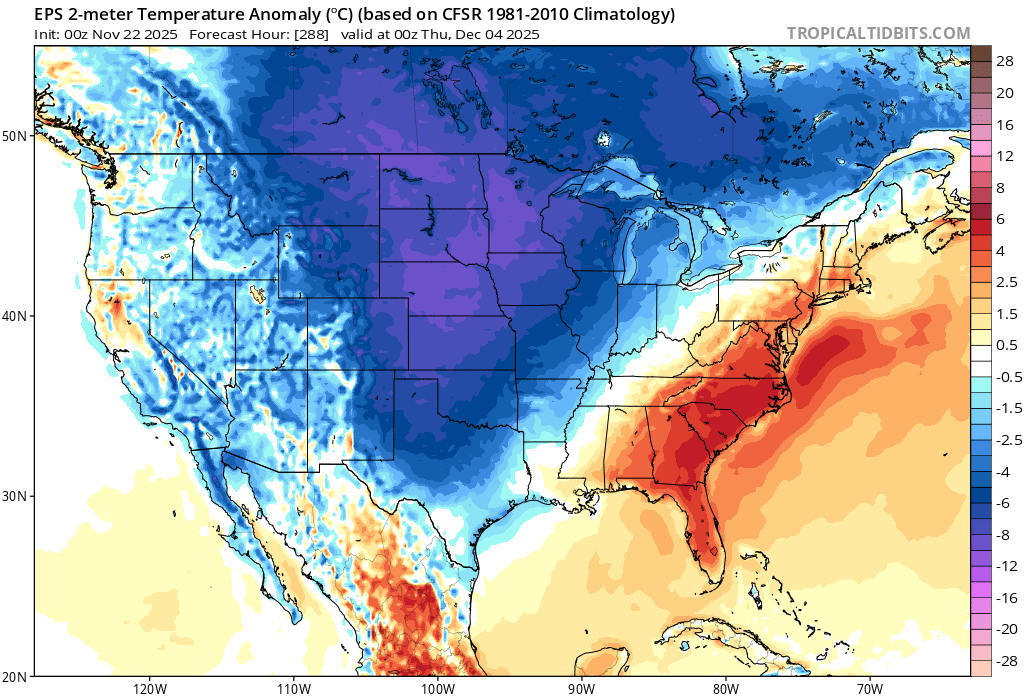
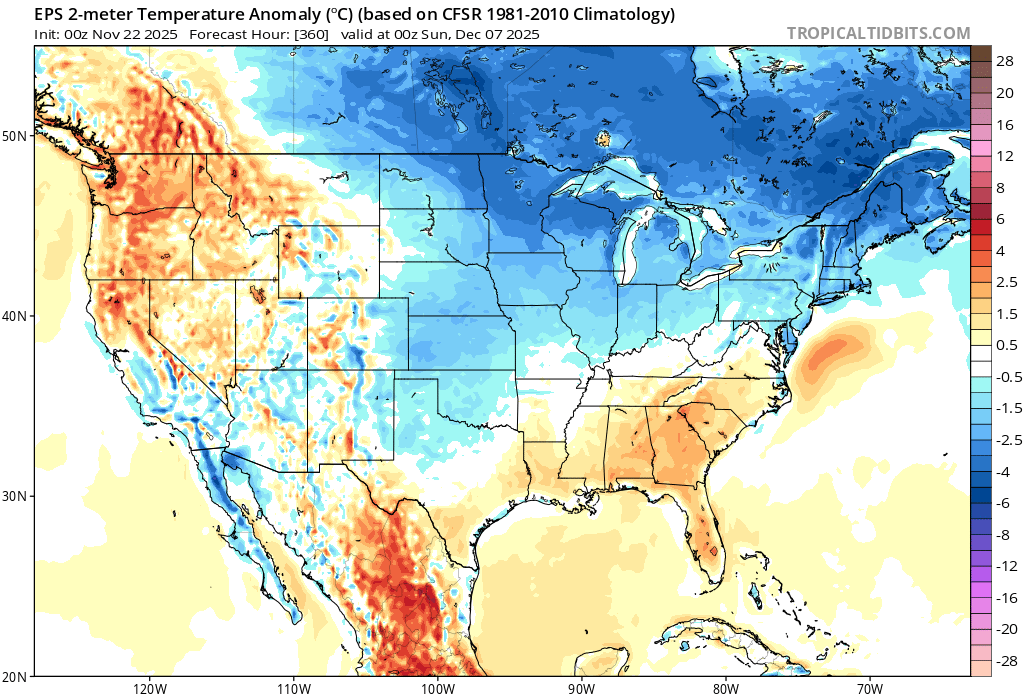
The 0z EPS rolls the cold forward pretty much as one would expect with a WPO-/EPO-/AO-/PNA- pattern evolution. One sees how the Great Lakes/Upper Midwest is the focus of the cold while warmth proves very persistent in the Southeast. 288 hours: 312 Hours: 336 Hours: 360 Hours: The usual caveats concerning skill apply that these timeframes. Moreover, how the stratospheric warming propagates will influence the pattern evolution for the second half of the month.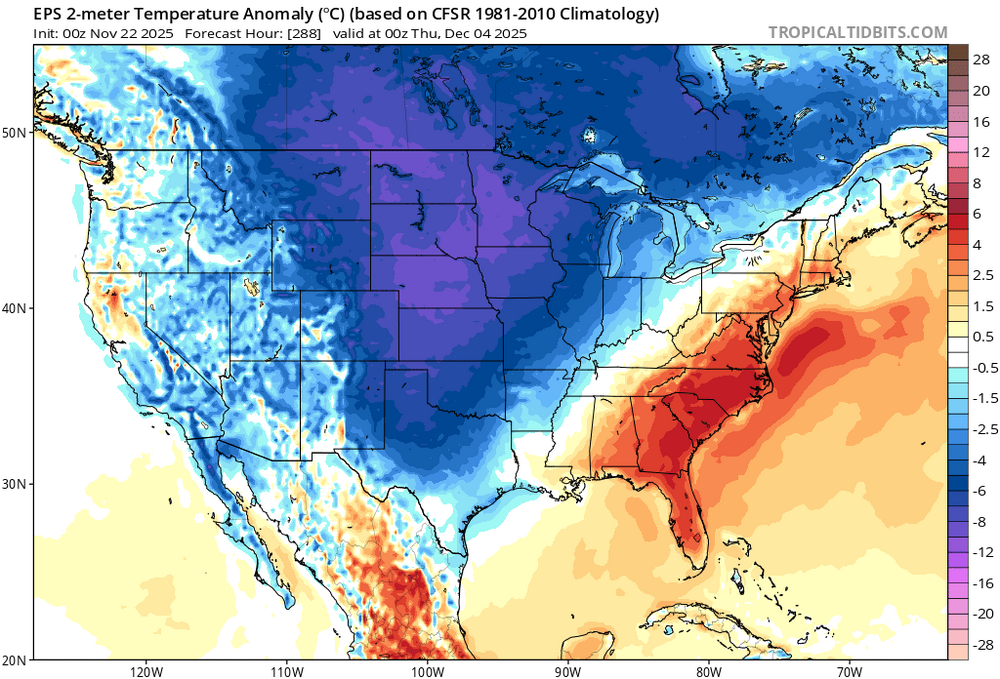

-
2025-2026 ENSO
donsutherland1 replied to 40/70 Benchmark's topic in Weather Forecasting and Discussion
I wanted to illustrate that CPC isn’t panicking. This map at that timeframe is along the lines of what many of us are thinking. It’s very close to my baseline scenario. -
-
2025-2026 ENSO
donsutherland1 replied to 40/70 Benchmark's topic in Weather Forecasting and Discussion
The latest week 3-4 CPC outlook:
-
2025-2026 ENSO
donsutherland1 replied to 40/70 Benchmark's topic in Weather Forecasting and Discussion
That's a great map. -
A generally milder than normal pattern will likely continue through next Wednesday. However, exceptional warmth appears unlikely. The closing days of November will likely turn colder. Meanwhile, today will be Central Park's 1,392nd consecutive day without daily snowfall of 4" or more. The record of 1,394 days was set during February 22, 1929 through December 16, 1932. That stretch ended with 6.7" daily snowfall on December 17, 1932. The ENSO Region 1+2 anomaly was -0.7°C and the Region 3.4 anomaly was -0.7°C for the week centered around November 12. For the past six weeks, the ENSO Region 1+2 anomaly has averaged -0.16°C and the ENSO Region 3.4 anomaly has averaged -0.65°C. La Niña conditions will likely continue through at least mid-winter. The SOI was +26.47 today. The preliminary Arctic Oscillation (AO) was +0.707 today. Based on sensitivity analysis applied to the latest guidance, there is an implied 83% probability that New York City will have a cooler than normal November (1991-2020 normal). November will likely finish with a mean temperature near 46.6° (1.4° below normal). Supplemental Information: The projected mean would be 1.1° below the 1981-2010 normal monthly value.
-
2025-2026 ENSO
donsutherland1 replied to 40/70 Benchmark's topic in Weather Forecasting and Discussion
A number of boundary conditions e.g., SSTAs, and teleconnections this year differ from those in recent La Niña winters that saw extremely low snowfall. None of this guarantees a “big” winter, but it does mean the range of plausible outcomes is perhaps broader than what we’ve seen the last few years. -
Interesting. You should ask it to follow up with links to related scientific papers on which its assessment was based.
-
2025-2026 ENSO
donsutherland1 replied to 40/70 Benchmark's topic in Weather Forecasting and Discussion
Yes. That’s true.