donsutherland1
-
Posts
23,988 -
Joined
Content Type
Profiles
Blogs
Forums
American Weather
Media Demo
Store
Gallery
Everything posted by donsutherland1
-
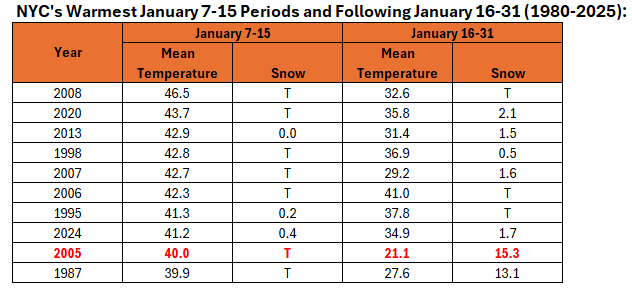
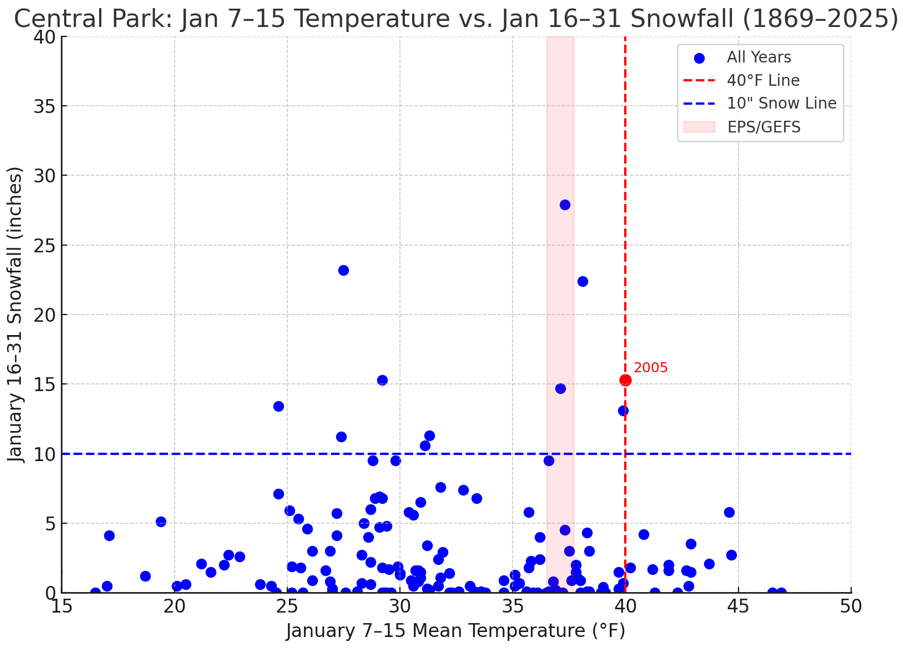
For reference, here's how New York City fared in terms of mean temperatures following the warmest January 7-15 periods (1980-2025): Both the 1/1/2026 12z EPS and GEFS are quite a bit cooler than the lowest value on the above table. Below is a scatter diagram showing all cases, including the shaded region for the current EPS and GEFS forecasts. In short, even if the January 7-15 period winds up warmer than normal, as is now the consensus on the guidance, its warmth does not provide basis to write off all of January, even as a colder January 7-15 period has typically preceded snowier than normal second halves of January. Now, if the warmth reaches a magnitude much higher than the present guidance e.g., above 40.0°, then snowfall prospects for the second half of January would become markedly lower.
-
I was surprised, too. We’ll see whether anything measurable is added in the climate entry.
-
Final Snowfall Totals from the Snow Squall: Bridgeport: Trace Islip: 0.4" New York City-Central Park: 0.5" New York City-JFK Airport: 0.4" New York City-LaGuardia Airport: Trace Newark: 0.7"
-
A snow squall associated with an Arctic cold front brought Central Park its first measurable New Year's Day snowfall since 1987. In the wake of the frontal passage, a series of cold days lies ahead. The first week of January could have a mean temperature below 30° in New York City. If that happends, it would be the coldest opening week of January since 2018. The only years since 2000 with a sub-30° mean temperature for the opening week of January were 2001, 2010, 2014 and 2018. Milder weather could develop on or around January 7th. The milder period appears likely to last for about a week, but there is some uncertainty about its duration. Afterward, conditions could become more favorable for both cold and snowfall, especially if the PNA goes positive. The ENSO Region 1+2 anomaly was -0.3°C and the Region 3.4 anomaly was -0.7°C for the week centered around December 24. For the past six weeks, the ENSO Region 1+2 anomaly has averaged -0.33°C and the ENSO Region 3.4 anomaly has averaged -0.68°C. La Niña conditions will likely continue into at least late winter. The SOI was +2.39 today. The preliminary Arctic Oscillation (AO) was -0.973 today.
-
That's only through 7 am. I suspect that the final number will show measurable snowfall at LaGuardia.
-
Just midnight through 7 am. As noted some locations were still receiving snowfall. A subsequent update should cover the final amounts. Moreover, since I was showing only snowfall from the squall, that omitted the 0.1" that fell at Newark yesterday.
-
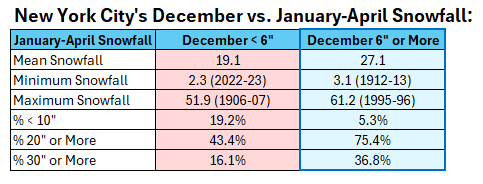
While some might be tempted to cancel winter with the 12z guidance having few, if any, snow threats beyond mid-January, a snowy December typically favors more snow during January-April than when December is not snowy. I'd take my chances given where things stand.
-
2025-2026 ENSO
donsutherland1 replied to 40/70 Benchmark's topic in Weather Forecasting and Discussion
I agree regarding the TNH+ and NAO. However, at least as far as January is concerned (1980-2025), the NAO was < 0 on 63% of days when the EPO was < 0. Since 2015, that figure was 72%. A larger period beyond January 1-31 is likely involved in the linkage between EPO- and NAO+. -
2025-2026 ENSO
donsutherland1 replied to 40/70 Benchmark's topic in Weather Forecasting and Discussion
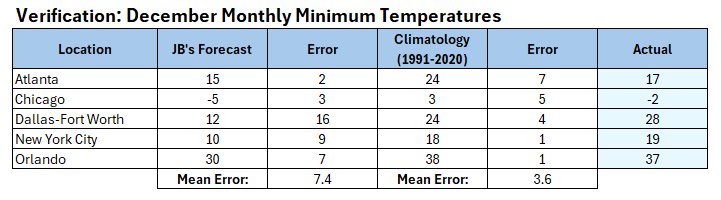
Verification:
-
This morning's snow squall brought Central Park its first measurable snowfall on New Year's Day since 1987. All amounts are preliminary and the final amounts at some of the locations could be higher.

-
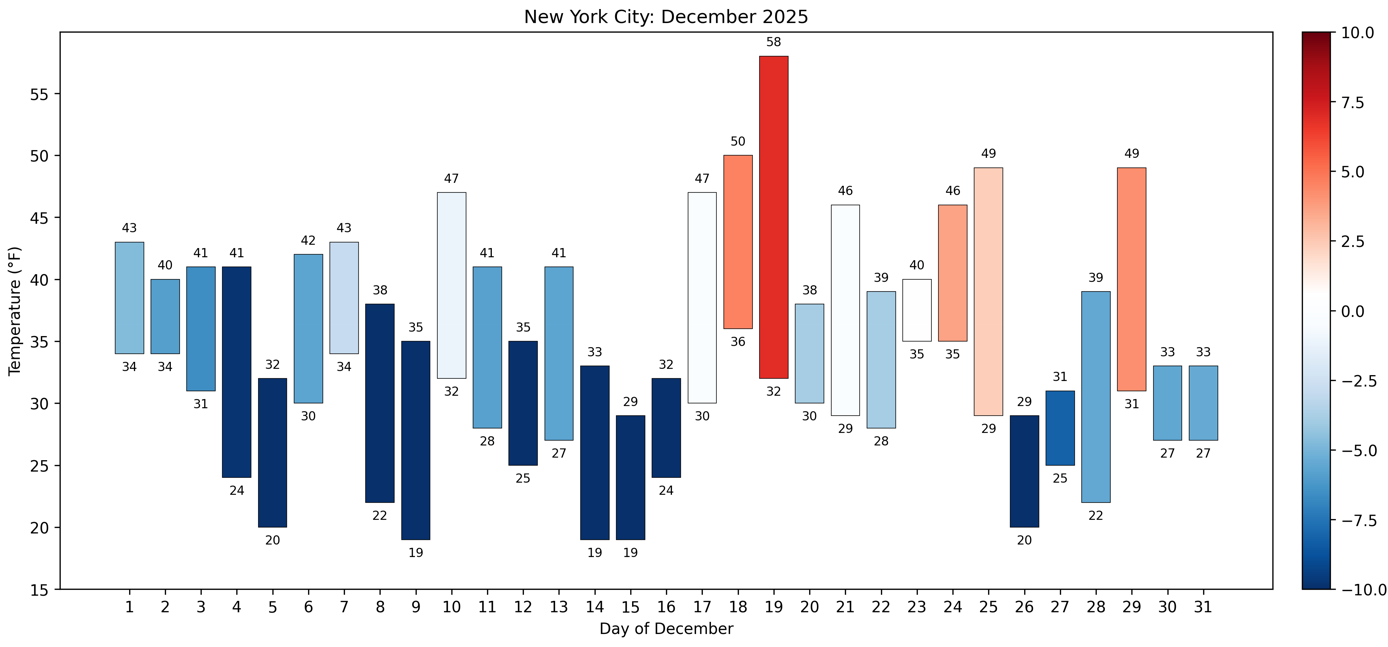
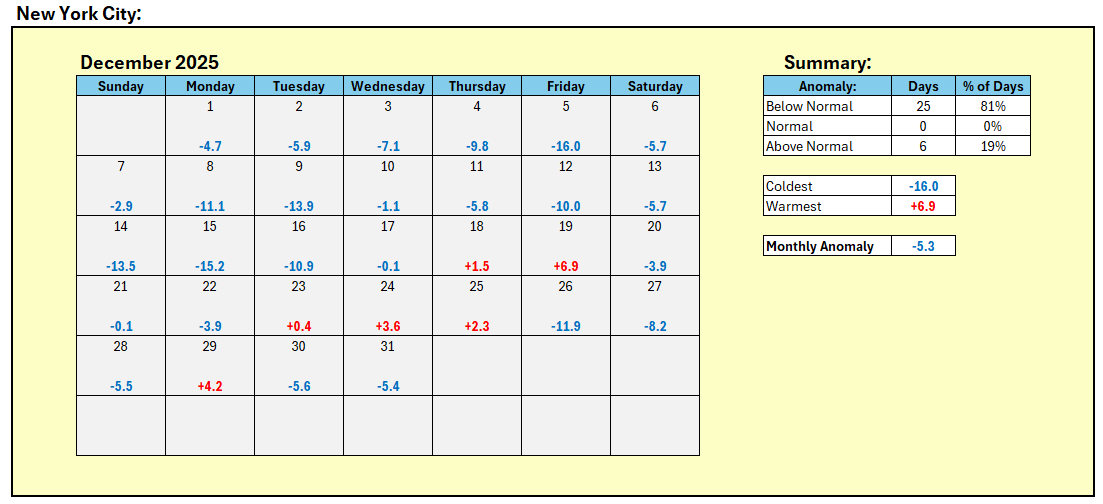
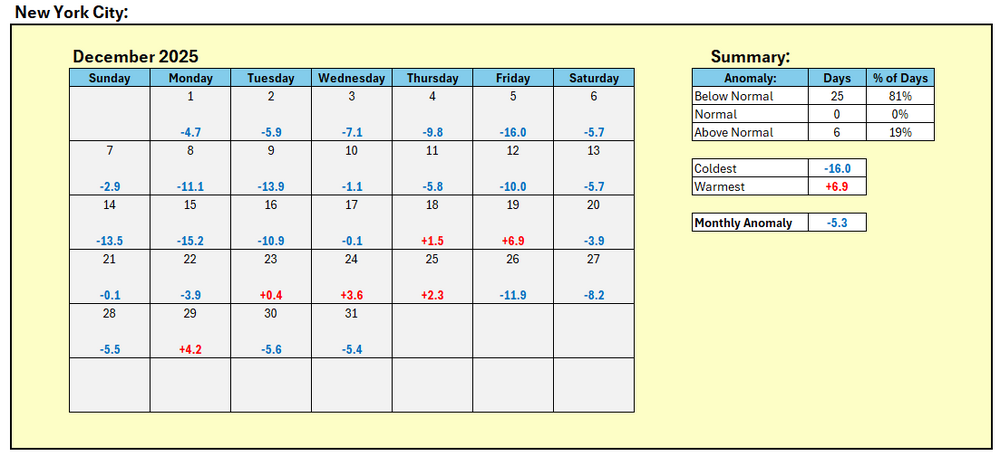
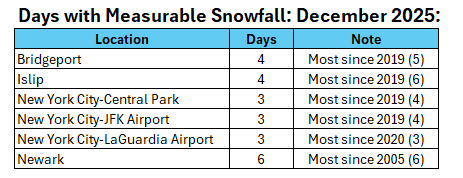
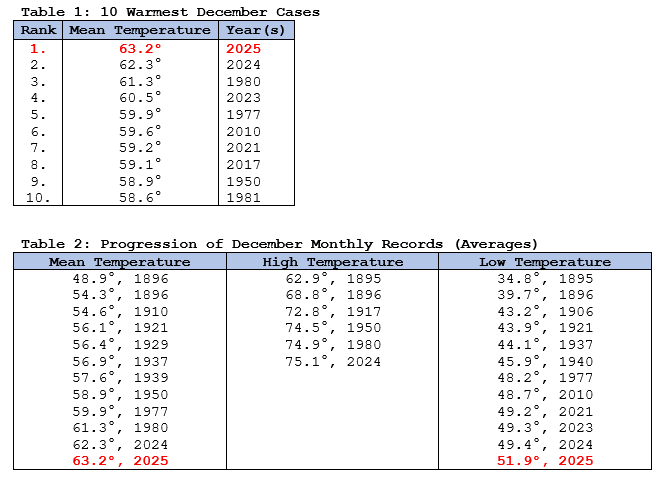
New York City finished December with a monthly mean temperature of 33.8° (5.3° below normal) and 7.2" of snow. That was the coldest December since 2010 and the snowiest one since 2020. New York City also had its most days with measurable snowfall in December since December 2019.

-
The result is a combination of climate change, the urban heat island effect, and the pattern.
-
New Years Day 2026 - 1st snows of the new year possible
donsutherland1 replied to Baroclinic Zone's topic in New England
I hope she feels better soon. -
DCA _ NYC _ BOS _ ORD _ ATL _ IAH _ DEN _ PHX _ SEA -0.5 -1.9 -2.0 -0.2 2.2 3.8 2.0 2.7 2.0
-
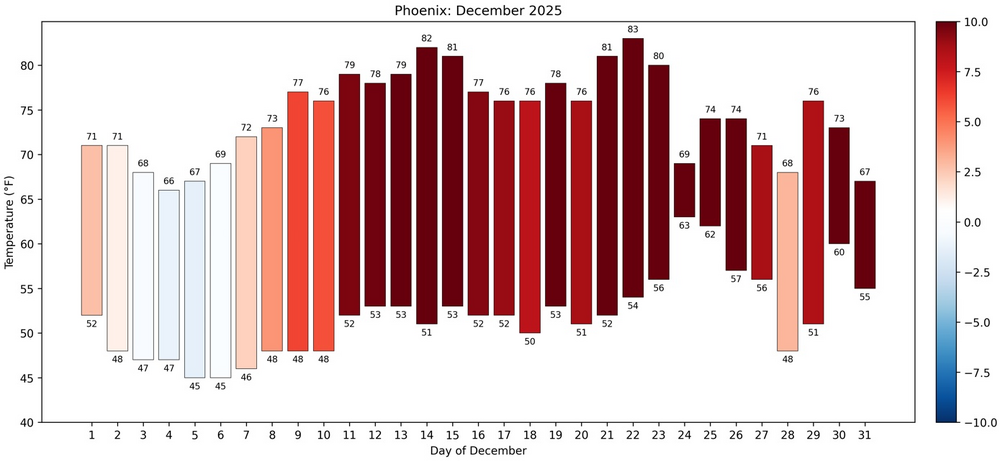
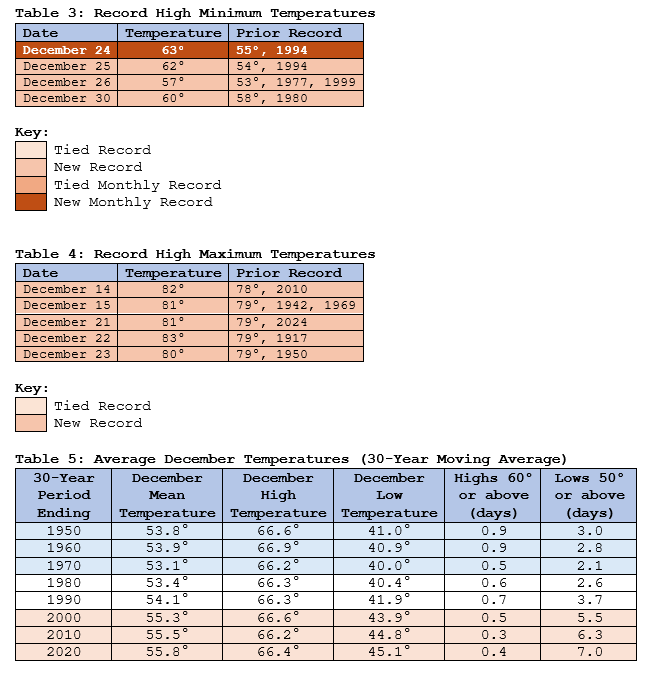
Phoenix experienced its warmest December on record for the second consecutive year. Last year, the December mean surpassed a record that held since 1980. That record was beaten this year with Phoenix experiencing, by far, its warmest average low temperatures on record for December.
-
IMO, the second half of January will have a lot more potential than the first half. Indeed, there could even be a transitional mild period that develops on or around January 7th.
-
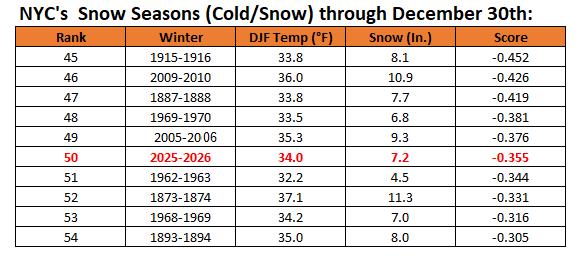
@Roger Smith New York City's snow season rankings through December 30th:
-
Some flurries or snow showers are possible tonight into tomorrow in parts of the region. The ground could be coated or dusted in places. The eastern end of Long Island and eastern Connecticut could see 1"-2" of snow due to an influx of some Atlantic moisture. The first week of January will likely have a mean temperature below 30° in New York City. The last time that happened was in 2018. The only years since 2000 with a sub-30° mean temperature for the opening week of January were 2001, 2010, 2014 and 2018. The ENSO Region 1+2 anomaly was -0.3°C and the Region 3.4 anomaly was -0.7°C for the week centered around December 24. For the past six weeks, the ENSO Region 1+2 anomaly has averaged -0.33°C and the ENSO Region 3.4 anomaly has averaged -0.68°C. La Niña conditions will likely continue into at least late winter. The SOI was +2.39 today. The preliminary Arctic Oscillation (AO) was -1.306 today. Based on sensitivity analysis applied to the latest guidance, there is an implied near 100% probability that New York City will have a cooler than normal December (1991-2020 normal). December will likely finish with a mean temperature near 33.9° (5.2° below normal). That will make December 2025 the coldest December since 2010 when the monthly mean temperature was 32.8°. It would also make 2025 the third coldest December since 2000. Supplemental Information: The projected mean would be 3.5° below the 1981-2010 normal monthly value.
-
Here’s some info: https://www.cpc.ncep.noaa.gov/data/teledoc/tnh.shtml
-
As noted in the general ENSO 2025-2026 thread, the forecast development WPO+/EPO+/AO-/PNA+ pattern typically does not favor large East Coast snowstorms during January 1-10. Instead, lighter snows are the rule.
-
I will check it when I get back home tomorrow evening.
-
The wind will diminish overnight, but a cold regime will remain in place. Below normal temperatures will continue into at least the middle of the first week of January. Some flurries or snow showers are possible late Thursday into Friday in parts of the region. The first week of January will likely have a mean temperature below 30° in New York City. The last time that happened was in 2018. The only years since 2000 with a sub-30° mean temperature for the opening week of January were 2001, 2010, 2014 and 2018.December 2025 will finish with a maximum monthly temperature of 58° in New York City. The last time December had a monthly maximum temperature below 60° was in 2019 when the monthly high was 58°. This will be only the fifth such occurrence since 2000 (2003, 2004, 2005, and 2019 are the cases since 2000).The ENSO Region 1+2 anomaly was -0.3°C and the Region 3.4 anomaly was -0.7°C for the week centered around December 24. For the past six weeks, the ENSO Region 1+2 anomaly has averaged -0.33°C and the ENSO Region 3.4 anomaly has averaged -0.68°C. La Niña conditions will likely continue into at least late winter.The SOI was +6.49 today. The preliminary Arctic Oscillation (AO) was -1.580 today. Based on sensitivity analysis applied to the latest guidance, there is an implied near 100% probability that New York City will have a cooler than normal December (1991-2020 normal). December will likely finish with a mean temperature near 33.9° (5.2° below normal). That will make December 2025 the coldest December since 2010 when the monthly mean temperature was 32.8°. It would also make 2025 the third coldest December since 2000.Supplemental Information: The projected mean would be 3.5° below the 1981-2010 normal monthly value.
-
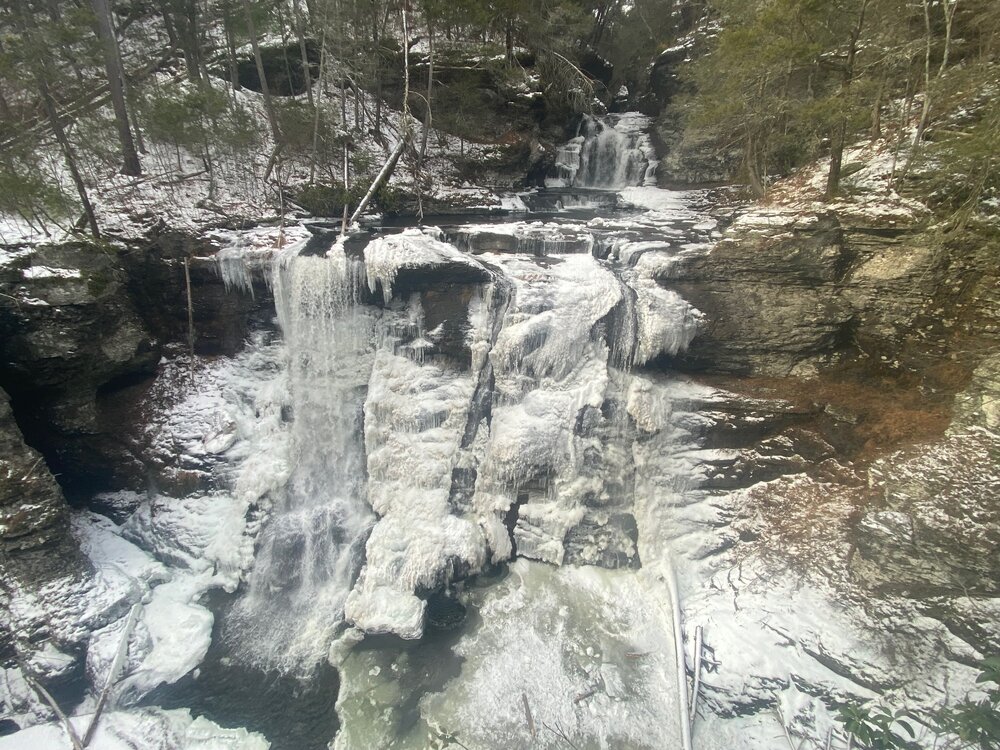
Winter beauty:
-
Some snow flurries have been occurring in Goshen.
-
2025-2026 ENSO
donsutherland1 replied to 40/70 Benchmark's topic in Weather Forecasting and Discussion
I agree. The forecast development WPO+/EPO+/AO-/PNA+ pattern typically does not favor large East Coast snowstorms during January 1-10. Instead, lighter snows are the rule. If one is searching for a genuine cold and snowy pattern, a WPO-/AO-/PNA+ combination is far better.