

donsutherland1
-
Posts
23,988 -
Joined
Content Type
Profiles
Blogs
Forums
American Weather
Media Demo
Store
Gallery
Everything posted by donsutherland1
-
Unfortunately, that's the whole list from 1950-present.
-
For historical reference, the biggest snowstorms/blizzards during January-February 1950-2025 during an AO of -3 or below and PNA>0 were: January 29-31, 1966: Washington, DC to Boston all saw 6" or more, but the heaviest amounts were in Washington, DC and Baltimore February 5-7, 1978: Baltimore to Boston saw 6" or more, but the heaviest snows extended from Philadelphia to Boston. February 4-7, 2010: A blockbuster storm in Washington, DC to Philadelphia. No measurable snow in New York City or Boston. February 9-11, 2010: Washington, DC to New York City all saw 6" or more (10" or more) with the heaviest snows falling in Baltimore and Philadelphia.
-
2025-2026 ENSO
donsutherland1 replied to 40/70 Benchmark's topic in Weather Forecasting and Discussion
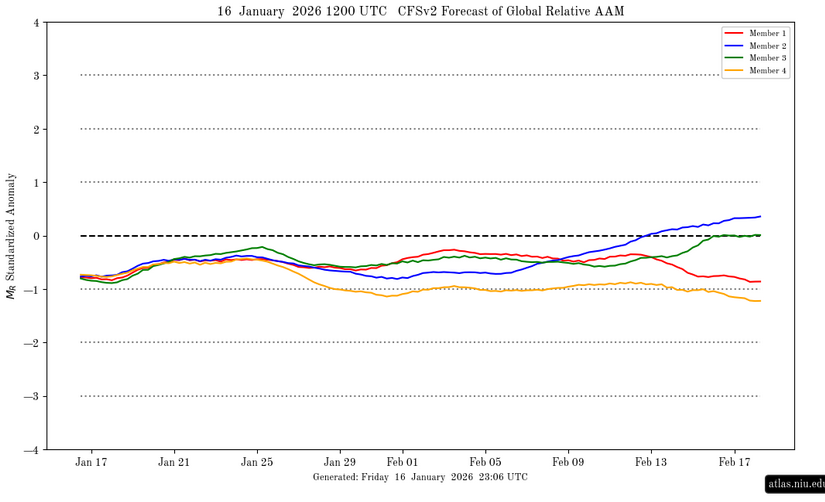
A westerly wind burst appears to be developing. However, at present, it has not yet translated to the surface, as the SOI has remained at or above +20 for four consecutive days. The most recent ENSO Region 3.4 anomaly was -0.7°C during the week centered around January 14th. That's almost identical to its six-week moving average of -0.68°C. So, at least through the most recent week, the La Niña has been remarkably stable. The La Niña should gradually weaken, not collapse. Weekly ENSO Region 3.4 values could rise to neutral-cool levels late this month or during February. However, the fade appears likely to be gradual. As a result, La Niña will likely continue to exert an influence on the atmosphere through at least the first week of February. The AAM- is consistent with a La Niña-type pattern. The WPO-/EPO-/AO-/PNA+ pattern will likely be the biggest driver of North American weather conditions through the remainder of January. That pattern is typically the coldest January pattern for the eastern half or third of the U.S., along with at least southern Ontario and Quebec. One or more lows in the single digits and one or more highs in the teens is possible in New York City. Subzero cold is likely in places like Chicago, Detroit, and Toronto. The predominantly positive PNA comes with a heightened risk, relative to climatology, of moderate or significant snowstorms for the East Coast. With the PNA likely to be mainly positive into or through at least the first week of February, it is likely that at least one or more of the following cities will see at least one 6" or above snowstorm from the remainder of January through the first week of February: Baltimore, Boston, New York, Philadelphia, Richmond, and Washington, DC. Warmer than normal conditions will generally prevail in the Southwest.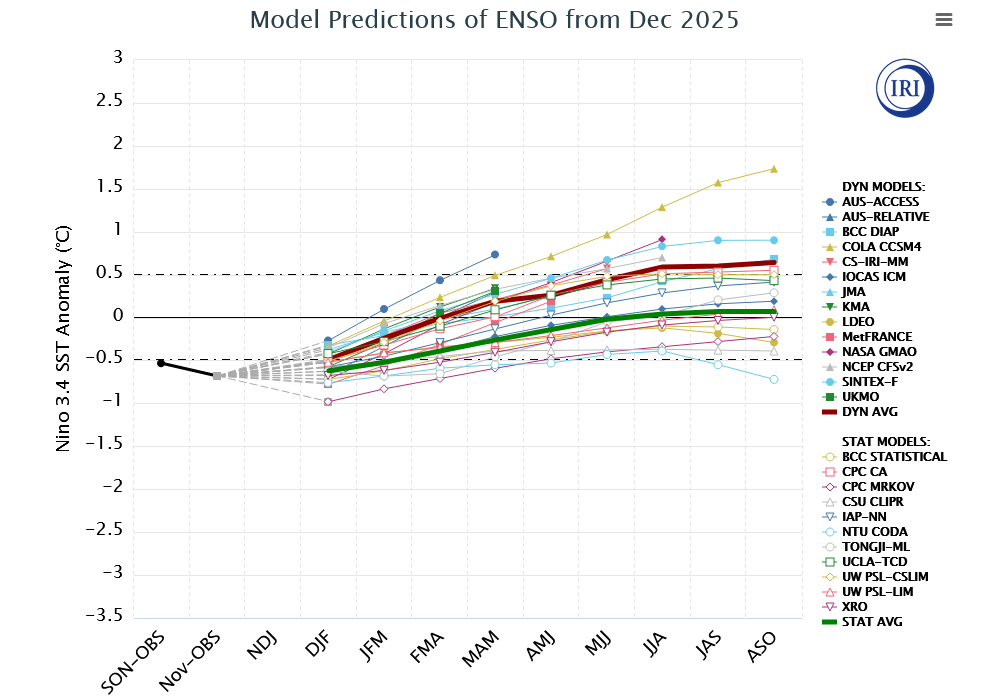
-
Storm potential January 17th-18th
donsutherland1 replied to WeatherGeek2025's topic in New York City Metro
The RGEM had the best QPF forecast for the January 18th event while the ECMWF was a close second. The EC-AI had 0.39".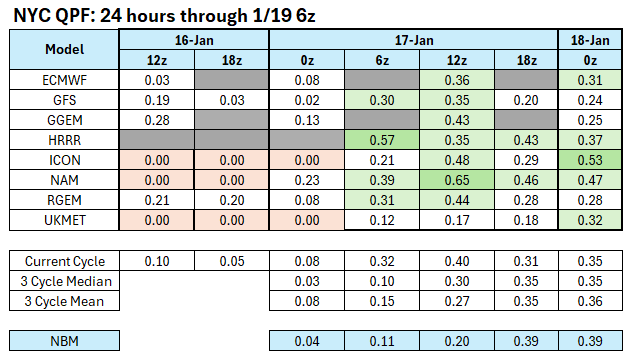
-
Storm potential January 17th-18th
donsutherland1 replied to WeatherGeek2025's topic in New York City Metro
The 0.9" was the storm total through 7 pm. Some additional snow has fallen since then, so the final figure might wind up around 1.5"-2.0". -
Storm potential January 17th-18th
donsutherland1 replied to WeatherGeek2025's topic in New York City Metro
Through 7 pm, Central Park had recorded 0.9" of snow. -
Storm potential January 17th-18th
donsutherland1 replied to WeatherGeek2025's topic in New York City Metro
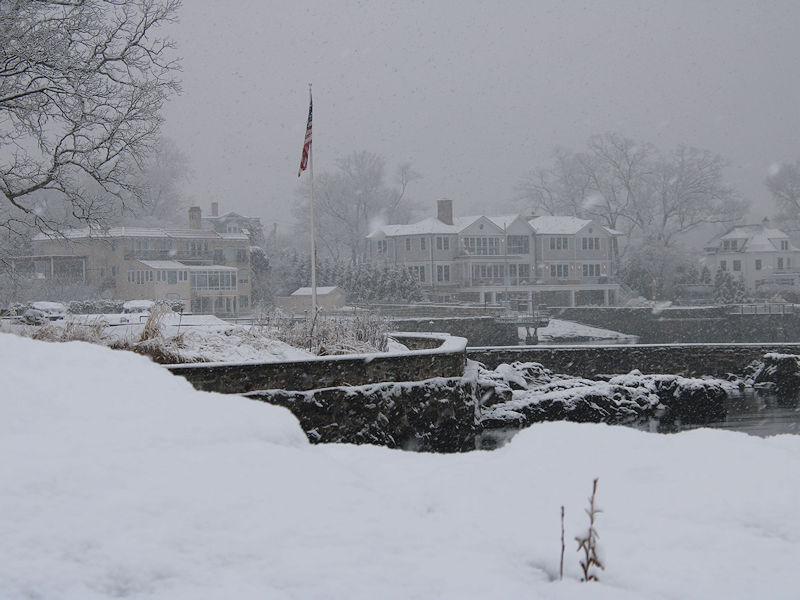
This evening. A steady light-to-moderate snow: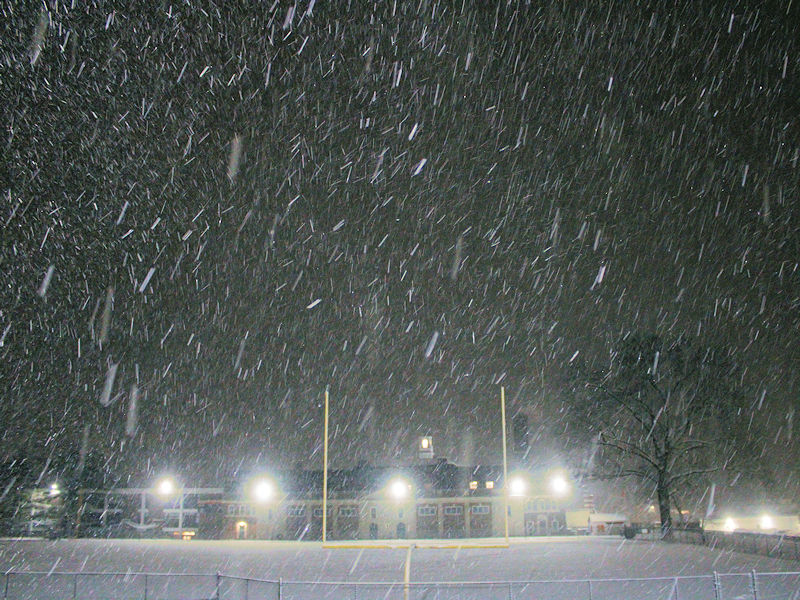
-
Storm potential January 17th-18th
donsutherland1 replied to WeatherGeek2025's topic in New York City Metro
I believe the issue is that locations don't show up when one is posting and reading on the phone. I only see them on the desktop. -
Storm potential January 17th-18th
donsutherland1 replied to WeatherGeek2025's topic in New York City Metro
Whitestone, Queens. -
Storm potential January 17th-18th
donsutherland1 replied to WeatherGeek2025's topic in New York City Metro
Snow is starting to redevelop across the New York City area.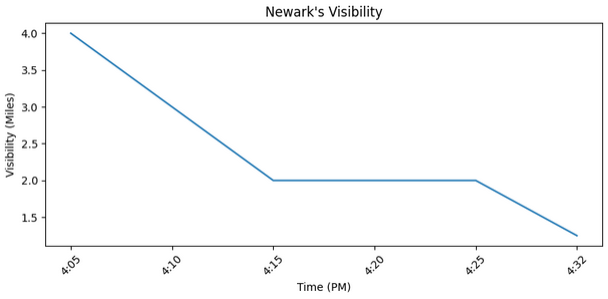
-
Storm potential January 17th-18th
donsutherland1 replied to WeatherGeek2025's topic in New York City Metro
0.4". -
Snow will redevelop and then continue into tonight. By the time the storm departs, New York City and nearby areas will likely see a storm total 2"-4" of snow. Parts of interior southeastern New York State across Connecticut into southeastern New England will likely see 3"-6" on account of higher snow-liquid ratios. Some 8" amounts are possible in southeastern New England. Tomorrow will be brisk with highs in the lower 30s. Arctic air will move into the region on tomorrow night. Tuesday could be the coldest day so far this season with highs struggling to reach the lower 20s and lows in the teens in New York City. Suburban areas could see single-digit lows, especially on Wednesday morning. Wednesday will be another unseasonably cold day. Another shot of cold air could arrive Thursday or Friday, possibly with some snow flurries or snow showers. Temperatures will remain below normal through next week. After January 20th, conditions could become favorable for potentially larger snowfalls, as a generally cold pattern continues. The probability of a PNA+ regime has continued to increase. PNA-related developments would have large implications for snowfall. A persistently positive PNA would have above climatological risk of moderate or significant snowfalls. A mainly negative PNA would favor mainly small snowfalls. The ENSO Region 1+2 anomaly was -0.7°C and the Region 3.4 anomaly was -0.8°C for the week centered around January 7. For the past six weeks, the ENSO Region 1+2 anomaly has averaged -0.47°C and the ENSO Region 3.4 anomaly has averaged -0.67°C. La Niña conditions will likely continue into at least late winter. The SOI was +22.15 today. The preliminary Arctic Oscillation (AO) was -0.660 today. The PNA was +1.107. That's the highest value since November 1, 2025 when the PNA was +1.698.The last time the PNA was at least this high on January 18th was 2014 when the PNA was +1.263. Based on sensitivity analysis applied to the latest guidance, there is an implied near 85% probability that New York City will have a cooler than normal January (1991-2020 normal). January will likely finish with a mean temperature near 32.0° (-1.7° below normal). Supplemental Information: The projected mean would be 0.6° below the 1981-2010 normal monthly value.
-
Storm potential January 17th-18th
donsutherland1 replied to WeatherGeek2025's topic in New York City Metro
At 1 pm, all the Long Island locations reporting p-type were reporting light snow. Whether the snow is accumulating is a different matter.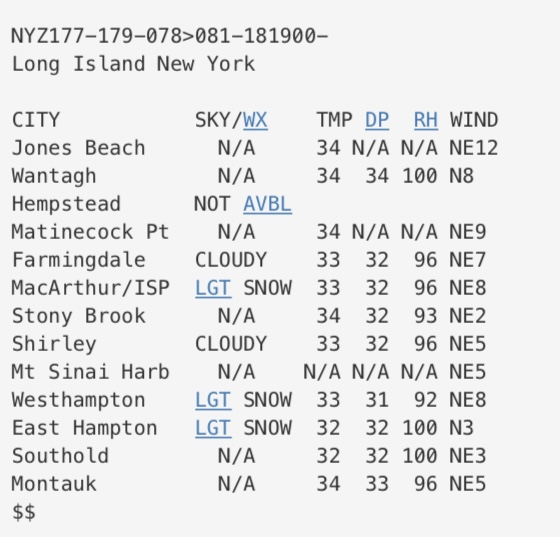
-
Storm potential January 17th-18th
donsutherland1 replied to WeatherGeek2025's topic in New York City Metro
193 NOUS41 KOKX 181831 PNSOKX CTZ005>012-NJZ002-004-006-103>108-NYZ067>075-078>081-176>179-190631- Public Information Statement National Weather Service New York NY 131 PM EST Sun Jan 18 2026 ...SNOWFALL REPORTS... Location Amount Time/Date Provider ...Connecticut... ...Fairfield County... Bridgeport Airport 2.0 in 1250 PM 01/18 Official NWS Obs 2 ENE New Canaan 1.7 in 1132 AM 01/18 Trained Spotter 3 WSW Shelton 1.4 in 1118 AM 01/18 Trained Spotter 4 NNW New Fairfield 1.2 in 1051 AM 01/18 Trained Spotter ...New Haven County... 1 ENE North Haven 1.5 in 1123 AM 01/18 Public ...New Jersey... ...Bergen County... 2 NNE Franklin Lakes 2.0 in 0112 PM 01/18 Trained Spotter 1 N River Vale 1.6 in 1135 AM 01/18 Trained Spotter 1 NNE Rutherford 1.5 in 1035 AM 01/18 Trained Spotter 1 SSW River Edge 1.0 in 1145 AM 01/18 Public ...Hudson County... Harrison 0.6 in 1234 PM 01/18 CO-OP Observer ...Union County... Newark Airport 1.1 in 1250 PM 01/18 Official NWS Obs Elizabeth 0.8 in 1034 AM 01/18 Public ...New York... ...Nassau County... 1 N Syosset 1.6 in 1040 AM 01/18 Trained Spotter ...New York (Manhattan) County... Central Park 0.4 in 1250 PM 01/18 Official NWS Obs ...Orange County... Monroe 2.0 in 1215 PM 01/18 Trained Spotter 4 SW Pine Bush 1.5 in 1045 AM 01/18 Public ...Queens County... NYC/La Guardia 0.5 in 1250 PM 01/18 Official NWS Obs Kennedy Airport 0.3 in 1250 PM 01/18 Official NWS Obs ...Suffolk County... Upton (NWS Office) 0.6 in 1250 PM 01/18 Official NWS Obs 1 WNW Jamesport 0.4 in 0100 PM 01/18 Public Orient 0.3 in 1040 AM 01/18 Fire Dept/Rescue Islip Airport 0.2 in 1250 PM 01/18 Official NWS Obs ...Westchester County... 2 ENE Peekskill 1.5 in 0115 PM 01/18 Trained Spotter ...FREEZING RAIN REPORTS... Location Amount Time/Date Provider ...New York... ...Suffolk County... Upton (NWS Office) T in 0650 AM 01/18 Official NWS Obs Farmingdale Airport T in 0617 AM 01/18 ASOS -
Storm potential January 17th-18th
donsutherland1 replied to WeatherGeek2025's topic in New York City Metro
The precipitation started as light rain but went over to snow in Central Park with the temperature dropping to freezing. There very likely was an accumulation and that will be reported early this afternoon. -
Storm potential January 17th-18th
donsutherland1 replied to WeatherGeek2025's topic in New York City Metro
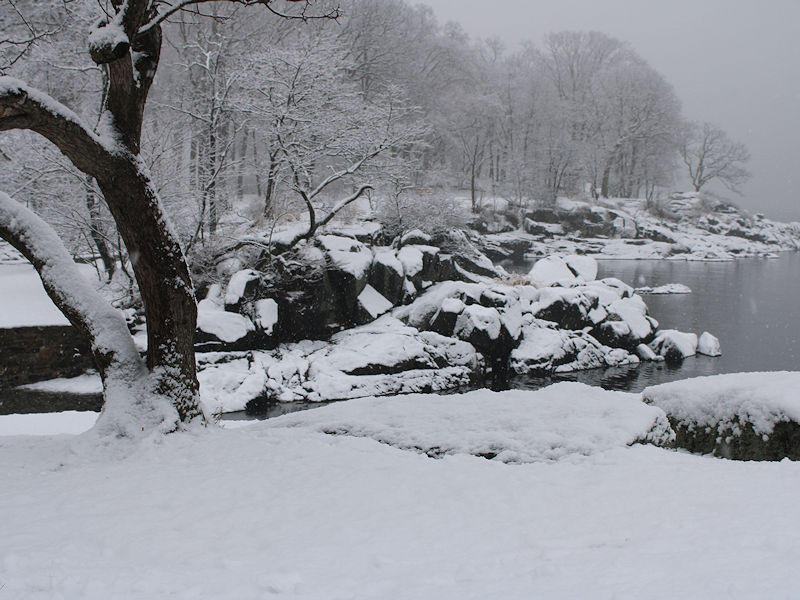
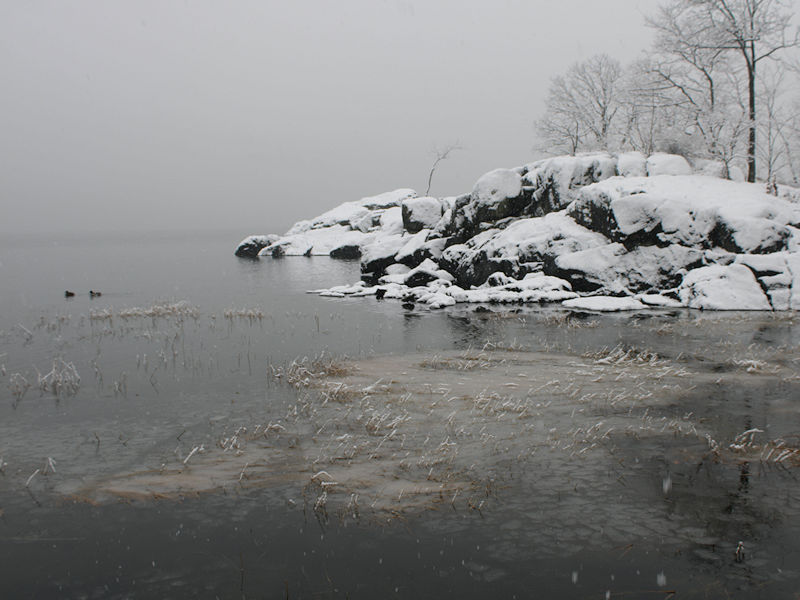
Four photos from this morning: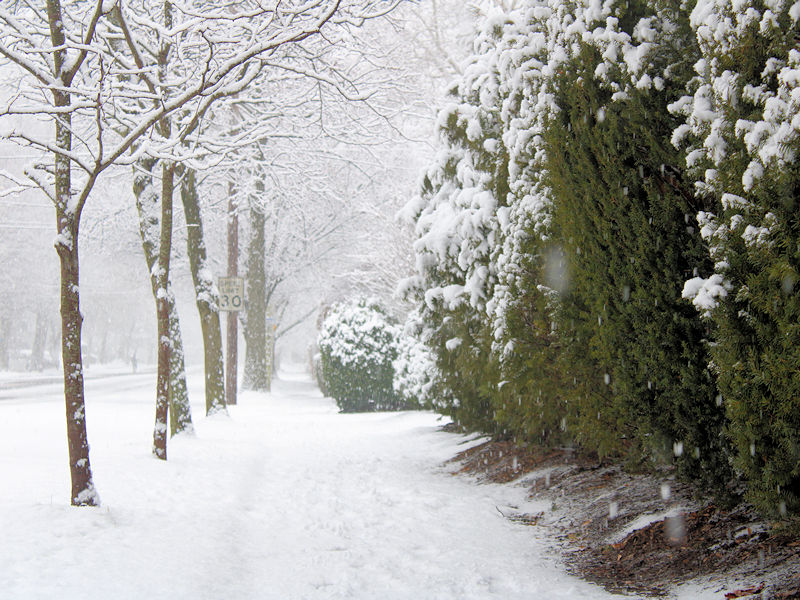
-
I think the cold is real and we'll see readings well in the single digits. The figure is around 35%, but the warmer GEFS + timeframe uncertainty likely drive the lower probability.
-
Overnight, there was a modest uptick in QPF. The general figure for NYC ranges from about 0.35"-0.45". The 12z NBM shows 0.38" with 0.27" from the coastal storm. Warm air advection snows are currently occurring. In parts of the region, readings are just warm enough for some light rain or mixed precipitation. Should precipitation rates increase, the temperature could drop toward 33° in NYC based on current wet bulb and dew point readings and the light rain there could flip to light snow. As the coastal storm approaches offshore, colder air will be pressing into the region. There will likely be several hours of moderate to occasionally heavy snow especially from New York City north and east. New York City will likely wind up with 2"-4" of snow. The NBM currently shows 3.0" for New York City. The colder areas to the north across interior southeastern New York State into Connecticut will likely see an area of 3"-6" snows.
-
There seems to be a pretty good signal for the 25th. Even the NBE shows > 0.75" QPF at that range.
-
Storm potential January 17th-18th
donsutherland1 replied to WeatherGeek2025's topic in New York City Metro
Different posters. -
I'm certainly enjoying the snow and looking forward to the cold. It seems that the AI versions have a lot of merit even as they are still "learning." I've been impressed how far they've come in the past year.
-
2025-2026 ENSO
donsutherland1 replied to 40/70 Benchmark's topic in Weather Forecasting and Discussion
Yes. I agree. We'll see if they ever acknowledge it. -
2025-2026 ENSO
donsutherland1 replied to 40/70 Benchmark's topic in Weather Forecasting and Discussion
I don't believe 2016-17 is a good analog. I only referenced it, because it had probably the strongest WWB during any La Niña in recent decades. Personally, I didn't think the 2026 WWB would measure up to that event. So far, it has fallen far short. -
Storm potential January 17th-18th
donsutherland1 replied to WeatherGeek2025's topic in New York City Metro
The HRRR has gotten the 0z cycle off to a promising start with a deeper, closer, snowier solution across NJ and eastern PA. -
Following today's snowfall, somewhat cooler air will move in tonight, setting the stage for another winter event tomorrow. A coastal storm will develop off the Southeast coast and then track toward but perhaps just south and east of the 40N-70W benchmark. In a change from recent days, the latest guidance brings the storm closer to the coast than had previously been shown. As a result, New York City and nearby areas will likely see 1"-3" of snow tomorrow into tomorrow night with some locally higher amounts around 4". There is a risk of mixed precipitation or rain for at least part of the event on Long Island, the Jersey shore, and perhaps into New York City and nearb areas. There remains a degree of uncertainty concerning the storm's track and rate of development. Highs will be mainly in the lower and middle 30s in New York City on tomorrow and Monday. The temperature will fall toward or near freezing during tomorrow's snowfall. Arctic air will move into the region on Monday night. Tuesday could be the coldest day so far this season with highs struggling to reach the lower 20s and lows in the teens in New York City. Suburban areas could see single-digit lows, especially on Wednesday morning. Wednesday will be another unseasonably cold day. Temperatures will remain below normal through at least most of next week. After January 20th, conditions could become more favorable for snowfall, as a generally cold pattern continues. The probability of a PNA+ regime has continued to increase. PNA-related developments would have large implications for snowfall. A persistently positive PNA would have above climatological risk of moderate or significant snowfalls. A mainly negative PNA would favor mainly small snowfalls. The ENSO Region 1+2 anomaly was -0.7°C and the Region 3.4 anomaly was -0.8°C for the week centered around January 7. For the past six weeks, the ENSO Region 1+2 anomaly has averaged -0.47°C and the ENSO Region 3.4 anomaly has averaged -0.67°C. La Niña conditions will likely continue into at least late winter. The SOI was +27.70 today. The preliminary Arctic Oscillation (AO) was -1.554 today. The PNA was +1.067, which is the highest since November 2, 2025 when the PNA was +1.071. Based on sensitivity analysis applied to the latest guidance, there is an implied near 72% probability that New York City will have a cooler than normal January (1991-2020 normal). January will likely finish with a mean temperature near 32.6° (-1.1° below normal). Supplemental Information: The projected mean would be at the 1981-2010 normal monthly value.


