donsutherland1
-
Posts
23,988 -
Joined
Content Type
Profiles
Blogs
Forums
American Weather
Media Demo
Store
Gallery
Everything posted by donsutherland1
-
Arctic air has moved into the region. The temperature will fall into the middle teens in New York City tonight. Some suburban areas could see single-digit lows. Tomorrow will be another unseasonably cold day, but the temperature will reach the lower and perhaps middle 30s. Thursday will be the warmest day of the week with highs reaching or suprassing 40°. However, an even colder Arctic front will cross the region on Thursday, possibly with some snow flurries or snow showers. A frigid weekend lies ahead. Snow could arrive on Sunday. The temperature could stay below 20° in New York City on Saturday. The last time that happened was January 21, 2025 when the high was 19°. Overall, January 20th-February 3rd will likely be the coldest and perhaps snowiest two-week period this winter. The forecast WPO-/EPO-/AO-/PNA+ pattern is typically the coldest pattern in January and among the coldest during the first half of February. A persistently positive PNA will have above climatological risk of moderate or significant snowfalls. The ENSO Region 1+2 anomaly was -0.3°C and the Region 3.4 anomaly was -0.7°C for the week centered around January 14. For the past six weeks, the ENSO Region 1+2 anomaly has averaged -0.48°C and the ENSO Region 3.4 anomaly has averaged -0.68°C. La Niña conditions will likely continue into at least late winter. The SOI was +17.11 today. The preliminary Arctic Oscillation (AO) was -1.705 today. Based on sensitivity analysis applied to the latest guidance, there is an implied near 97% probability that New York City will have a cooler than normal January (1991-2020 normal). January will likely finish with a mean temperature near 30.9° (2.8° below normal). Supplemental Information: The projected mean would be 1.7° below the 1981-2010 normal monthly value.
-
Extreme Cold, Snow & Sleet: SECS 1/24 - 1/26
donsutherland1 replied to TriPol's topic in New York City Metro
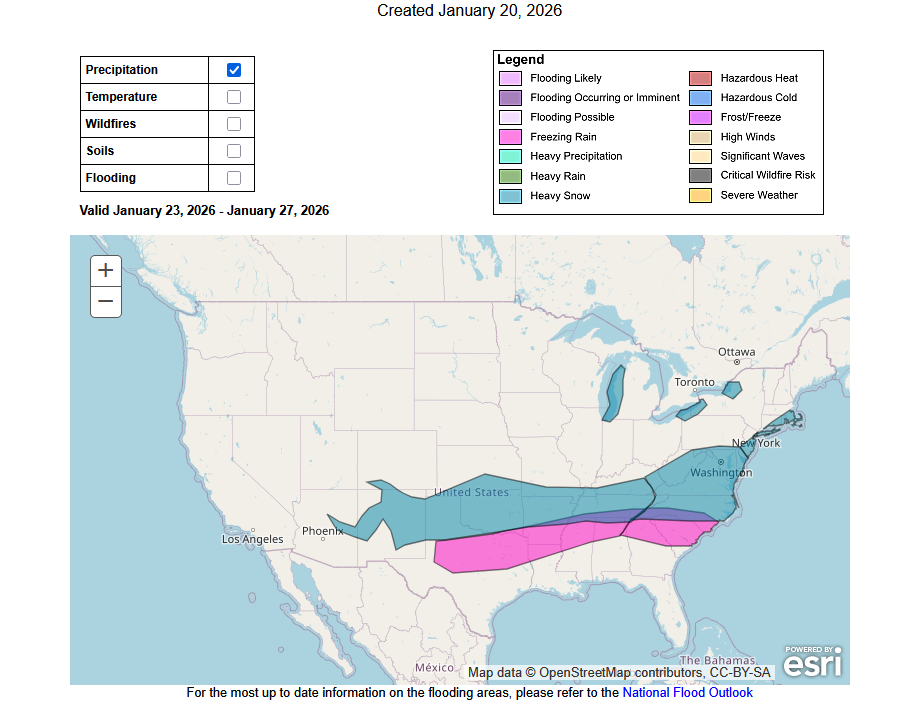
For comparison, the January 19th and January 20th heavy snow outlook from WPC: January 19: January 20: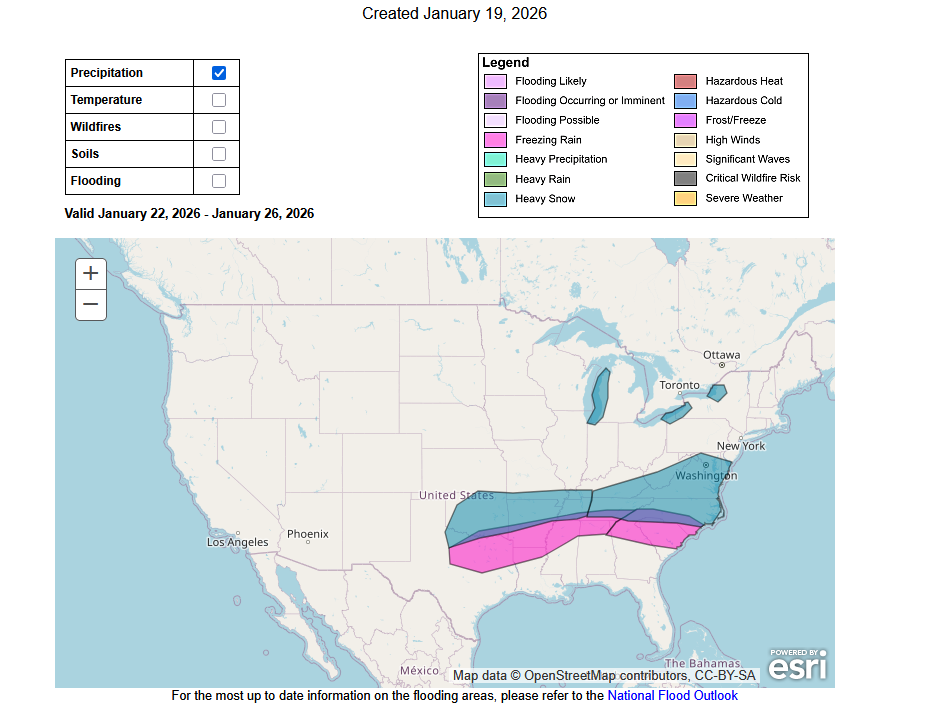
-
Extreme Cold, Snow & Sleet: SECS 1/24 - 1/26
donsutherland1 replied to TriPol's topic in New York City Metro
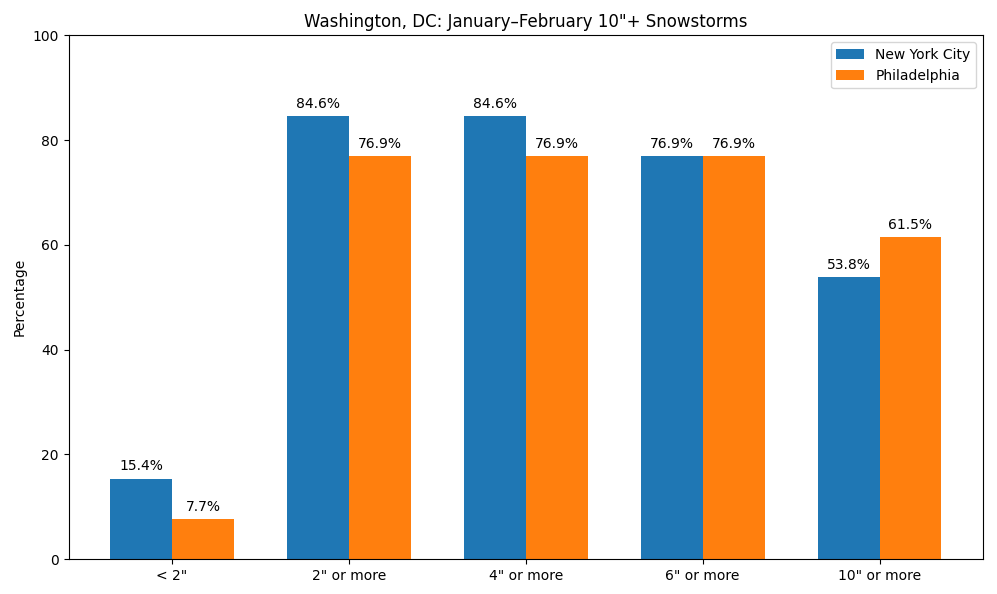
At present, it appears very likely that Washington, DC will see 6" or above snowfall during the January 24-26, 2026 snowstorm. Since 1950, below is the distribution of outcomes based on 6" or above and 10" or above January-February snowstorms in Washington, DC for New York City and Philadelphia. In theory, guidance with the higher-skill initialization (4dVAR)/better resolution (ECMWF, GGEM, and UKMET) should have a better handle at the current lead time. One can't fully dismiss the GFS, especially as there are ensemble members that support its solution. However, if one also weighs the historical outcomes while waiting for the guidance to reach higher skill levels in resolving the synoptic details (usually within 3 days of the event), it seems plausible that New York City and Philadelphia are possibly in line for at least a 3"-6" snowfall with upside potential if full phasing takes place and the storm tracks closer to the coast.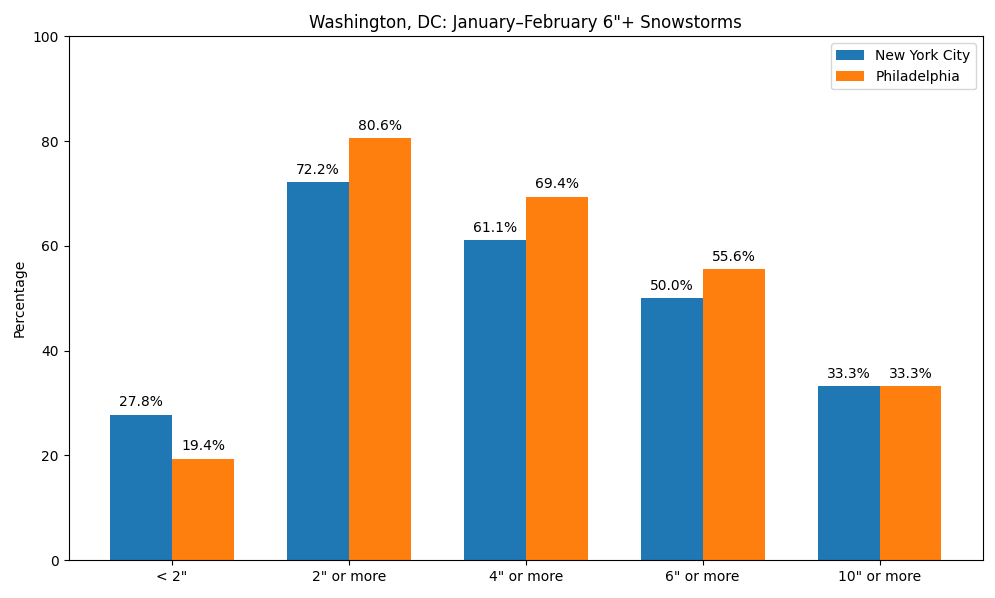
-
Extreme Cold, Snow & Sleet: SECS 1/24 - 1/26
donsutherland1 replied to TriPol's topic in New York City Metro
He's struggled this winter. He thought winter was essentially ending coming into January. He rejected the idea that the PNA- regime from December would be replaced by a PNA+ regime, which has now occurred. No one has a crystal ball. -
Extreme Cold, Snow & Sleet: SECS 1/24 - 1/26
donsutherland1 replied to TriPol's topic in New York City Metro
It's significant, but notably lighter than the 0z solution. -
Extreme Cold, Snow & Sleet: SECS 1/24 - 1/26
donsutherland1 replied to TriPol's topic in New York City Metro
From the NWS New York's 2/15/2003 10:45 am AFD: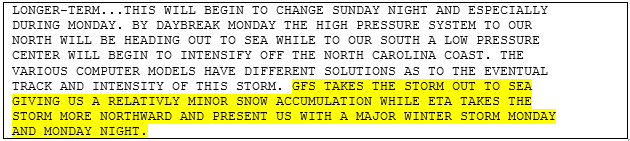
-
Extreme Cold, Snow & Sleet: SECS 1/24 - 1/26
donsutherland1 replied to TriPol's topic in New York City Metro
Although the potential storm is 4-5 days out from beginning to affect parts of the East Coast, many of us have seen this proverbial movie before. Arctic high pressure and strong confluence were expected to crush the storm to the South, yet as the event drew closer, the high and the confluence were somewhat weaker than previously modeled. It's too soon to focus on specific solutions, but the potential for snow remains very much on the table for Sunday in the New York City area. While we wait for the 12z cycle to weigh in, here are some tidbits from past storms. Storm 1: THE END OF WEEKEND MAY BRING SOME INTERESTING WEATHER. A STORM SYSTEM WILL BE GETTING ORGANIZED IN THE SOUTHERN PLAINS AND HEADING TOWARD THE CAROLINA COAST. IT IS STILL TOO EARLY TO DETERMINE EXACTLY HOW THIS STORM MIGHT EFFECT THE TRI-STATE. STAY TUNED... Storm 2: LATEST RUN OF THE GFS NOT VERY ENCOURAGING FOR SUNDAY INTO MONDAY EVENT. STRONG HIGH WITH CLASSIC DAMMING LOOKS TO WIN OUT. HEAVY SNOW A BETTER BET ACROSS MID-ATLANTIC. Storm 3: WILL CONTINUE TO KEEP AN EYE ON A SOUTHERN STREAM SYS PASSING TO THE SOUTH THIS WEEKEND, AS MODELS ARE LIKELY SUPPRESSING IT TOO FAR SOUTH VIA TOO STRONG OF A POLAR JET/MID LEVEL CONFLUENCE ZONE FROM NEW ENGLAND OVER TO NOVA SCOTIA, TO THE REAR OF A 50/50 CLOSED LOW. DETERMINISTIC 12Z GFS IS DRY AND 00Z ECMWF GIVES ONLY A GLANCING BLOW WITH SOME LIGHT SNOW. THEIR ENSEMBLE MEANS ARE A LITTLE LESS SUPPRESSED... If anyone wants the answers to which storms these are, storm 1 is the Blizzard of 1996 (NWS New York, January 5, 1996 3:53 am). Storm 2 is PD2 in 2003 (NWS New York, February 14, 2003 9:15 pm). Storm 3 is the potential January 24-26, 2026 storm (NWS New York, January 19, 2026 7:11 pm). This does not guarantee a major event for the New York City area. But that scenario cannot be ruled out at this lead time. For further trivia, the last storm to bring 6" or more snow to Baltimore, New York City, Norfolk, Philadelphia, Raleigh, Richmond, and Washington, DC was the February 1979 (PD1) blizzard. So, at least some of the guidance is hinting at a rare solution. As the NWS advised ahead of the 1996 blizzard, stay tuned. -
2025-2026 ENSO
donsutherland1 replied to 40/70 Benchmark's topic in Weather Forecasting and Discussion
Yes, it was 10/10 following PNA- regimes of 25 or more consecutive days. -
2025-2026 ENSO
donsutherland1 replied to 40/70 Benchmark's topic in Weather Forecasting and Discussion
One also saw the same thing following every long duration winter PNA- regime of 25 days or longer. The end of the PNA- regime was followed by a new predominantly positive PNA regime. As for what Larry found, I suspect Arctic amplification is the big driver, as such outcomes were very infrequent prior to 1980. -
Extreme Cold, Snow & Sleet: SECS 1/24 - 1/26
donsutherland1 replied to TriPol's topic in New York City Metro
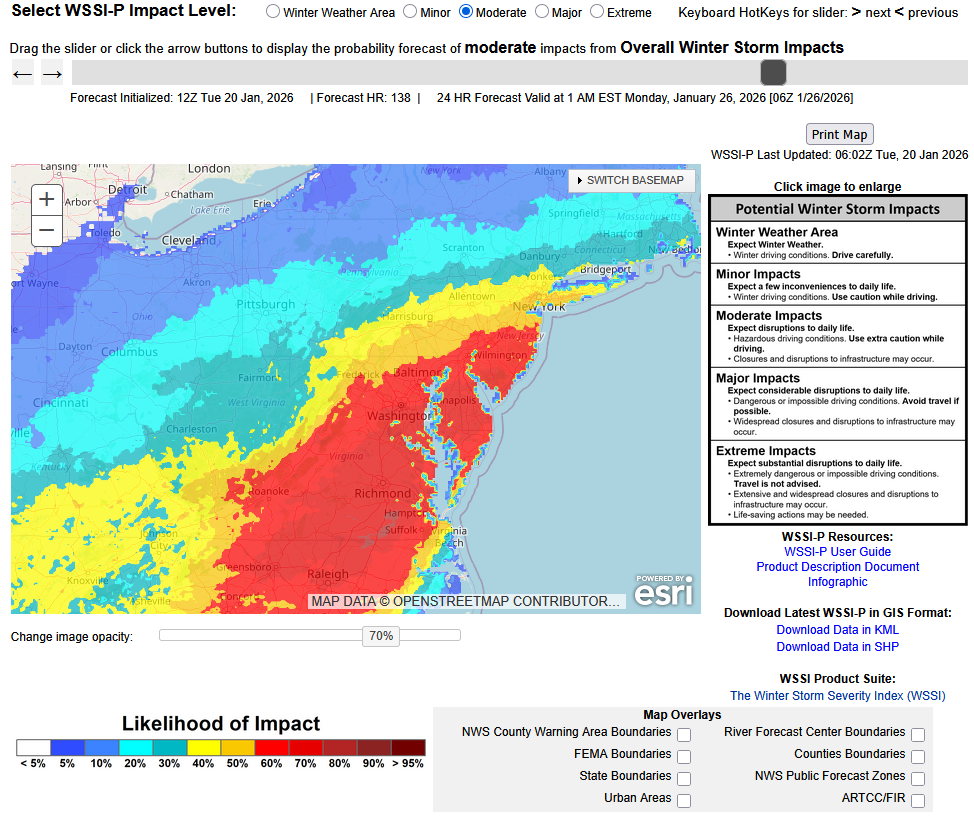
The latest WPC idea. for comparison, yesterday's 0z probability for a moderate impact in New York City was just under 30%.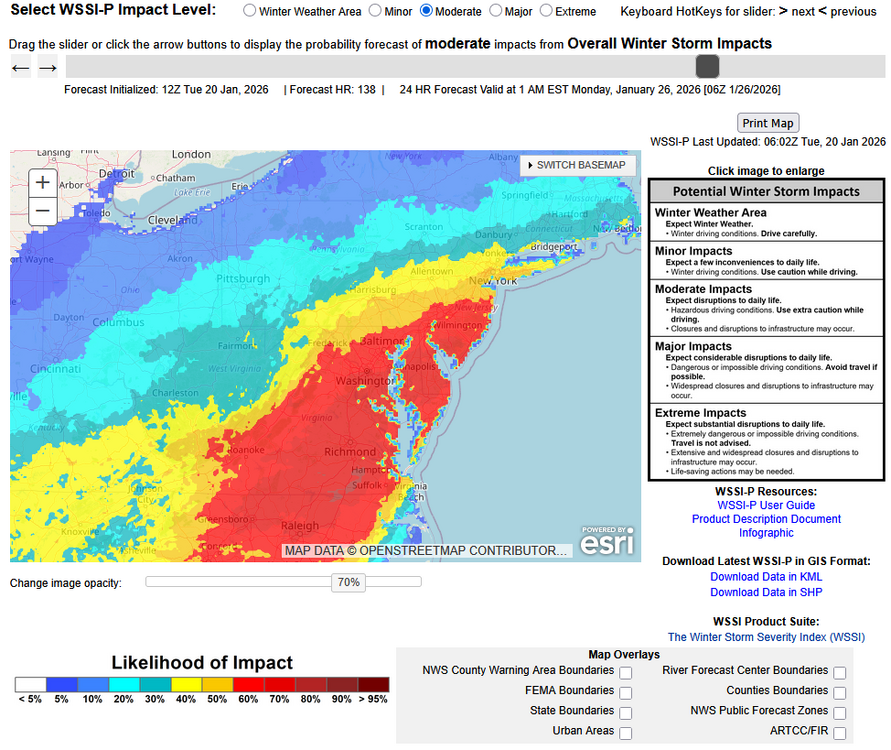
-
Extreme Cold, Snow & Sleet: SECS 1/24 - 1/26
donsutherland1 replied to TriPol's topic in New York City Metro
From Patchogue from that storm: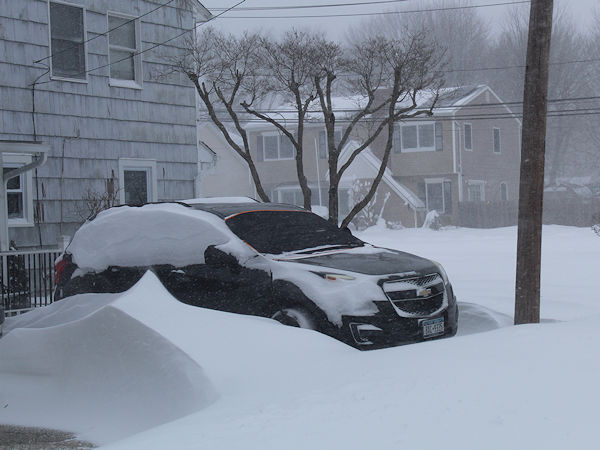
-
Extreme Cold, Snow & Sleet: SECS 1/24 - 1/26
donsutherland1 replied to TriPol's topic in New York City Metro
At this stage, models don't handle tracks and synoptic details very skillfully. Thus, there remains latitude for either a suppressed solution or even a big hit into southern New England. The odds somewhat favor the former, but that doesn't mean that the New York City area can't see a moderate or significant snowfall while parts of the lower Mid-Atlantic have a major snowfall. The 18z GFS came northward. It showed > 6" at Raleigh. Since 1890, there were 44 storms that brought 6" or more snow to Raleigh. While 24 (55%) had no measurable snow in New York City, 12 (27%) had 4" or more and 8 (18%) had 6" or more. The most recent storm to bring 6" or more snow to both Raleigh and New York City was the Boxing Day Blizzard of December 2010. Interestingly, almost 20% of individual EPS members showed 6" or more now, which would be in line with the historic probabilities associated with significant snowfalls in Raleigh. Of course, as noted in the first paragraph, nothing is cast in stone. Historically, if the teleconnection forecast is reasonably accurate, the heaviest snows could favor Washington-Baltimore-Richmond, but it's still possible to get significant snows into New York City. By Thursday, the guidance will be handling the synoptic details with skill. By that time, we should have a much better idea of what to expect. For now, aside from the possibility of a snowstorm, the details cannot be pinned down with much accuracy. At least there's something on the proverbial radar. -
The coldest and likely snowiest two-week period of Winter 2025-2026 lies ahead. Arctic air will move into the region tonight. Tomorrow could be the coldest day so far this season with highs struggling to reach the lower 20s and lows in the teens in New York City. Suburban areas could see single-digit lows, especially on Wednesday morning. Wednesday will be another unseasonably cold day. An even colder Arctic front will cross the region on Thursday, possibly with some snow flurries or snow showers. A frigid weekend lies ahead. Snow could arrive on Sunday. The temperature could stay below 20° in New York City on Saturday. The last time that happened was January 21, 2025 when the high was 19°. Overall, January 20th-February 3rd will likely be the coldest and perhaps snowiest two-week period this winter. The forecast WPO-/EPO-/AO-/PNA+ pattern is typically the coldest pattern in January and among the coldest during the first half of February. A persistently positive PNA will have above climatological risk of moderate or significant snowfalls. The ENSO Region 1+2 anomaly was -0.3°C and the Region 3.4 anomaly was -0.7°C for the week centered around January 14. For the past six weeks, the ENSO Region 1+2 anomaly has averaged -0.48°C and the ENSO Region 3.4 anomaly has averaged -0.68°C. La Niña conditions will likely continue into at least late winter. The SOI was +24.08 today. The preliminary Arctic Oscillation (AO) was -1.066 today. Based on sensitivity analysis applied to the latest guidance, there is an implied near 95% probability that New York City will have a cooler than normal January (1991-2020 normal). January will likely finish with a mean temperature near 31.4° (2.3° below normal). Supplemental Information: The projected mean would be 1.2° below the 1981-2010 normal monthly value.
-
I had to look at the 4.3 updates to see if any new models were added. They weren't. I agree that it should be easier to find this documentation.
-
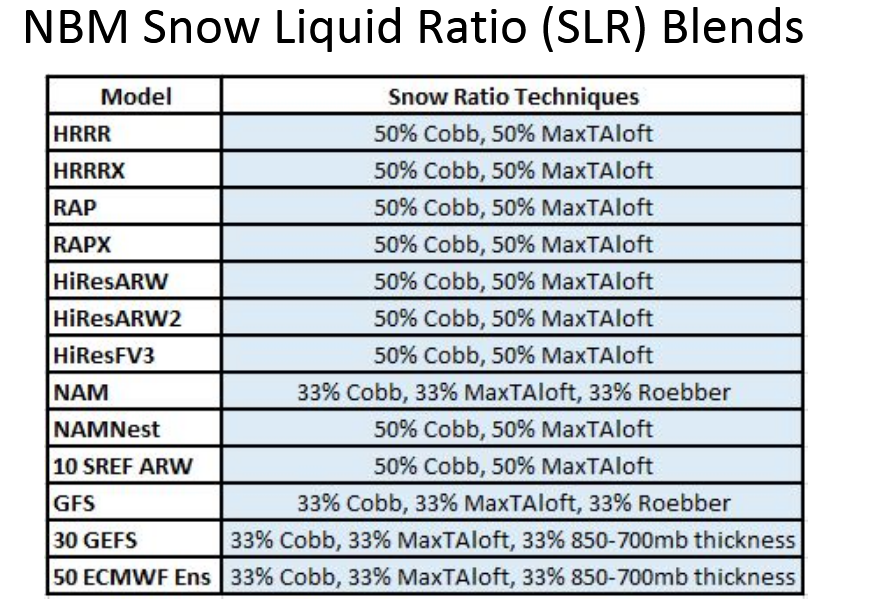
The NBM does not incorporate the AI guidance. Here's the list for models used for purposes of calculating snowfall:
-
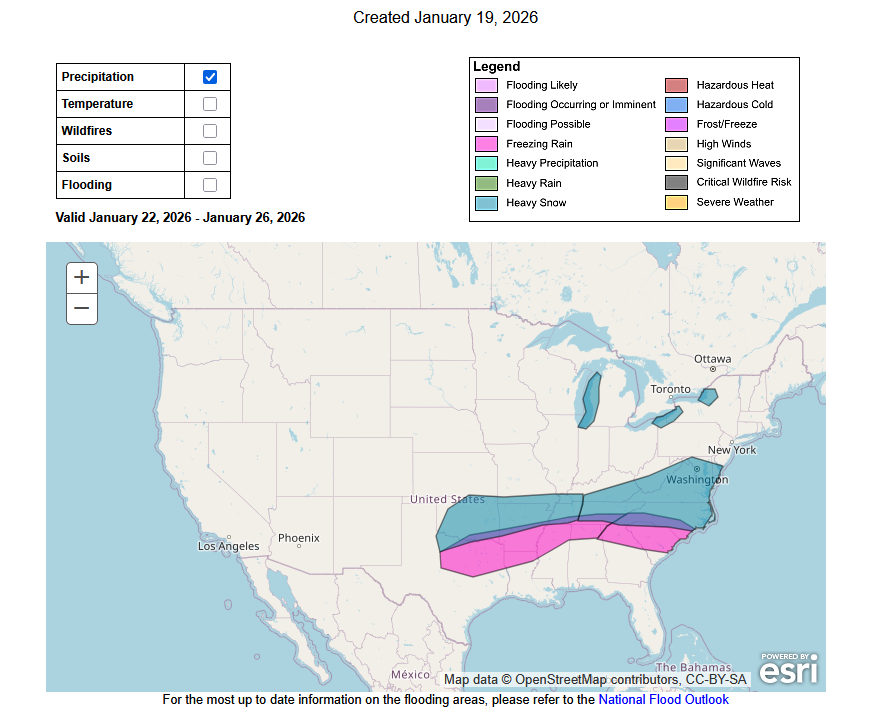
Cold. Here's the precipitation:
-
Storm potential January 17th-18th
donsutherland1 replied to WeatherGeek2025's topic in New York City Metro
Tarrytown, NY from early this afternoon: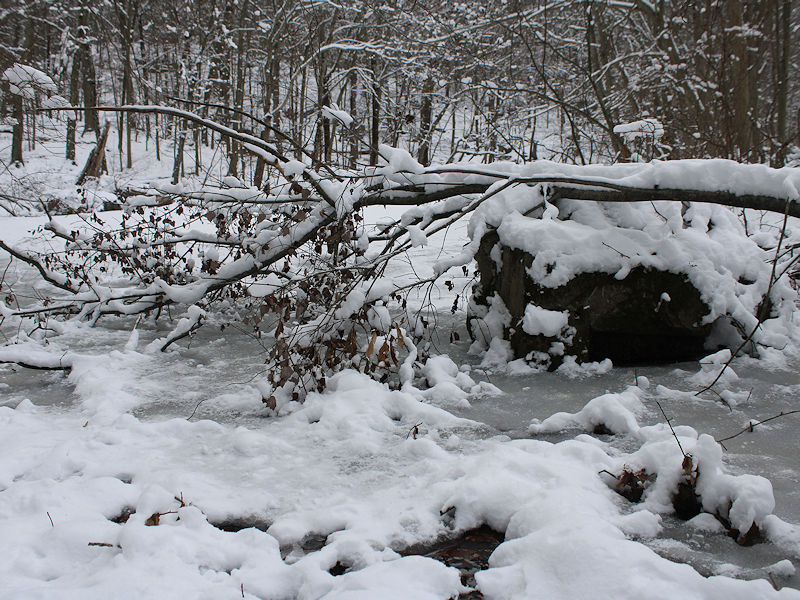
-
Probably 2/5-6/2010.
-
Nice improvement on the GGEM.

-
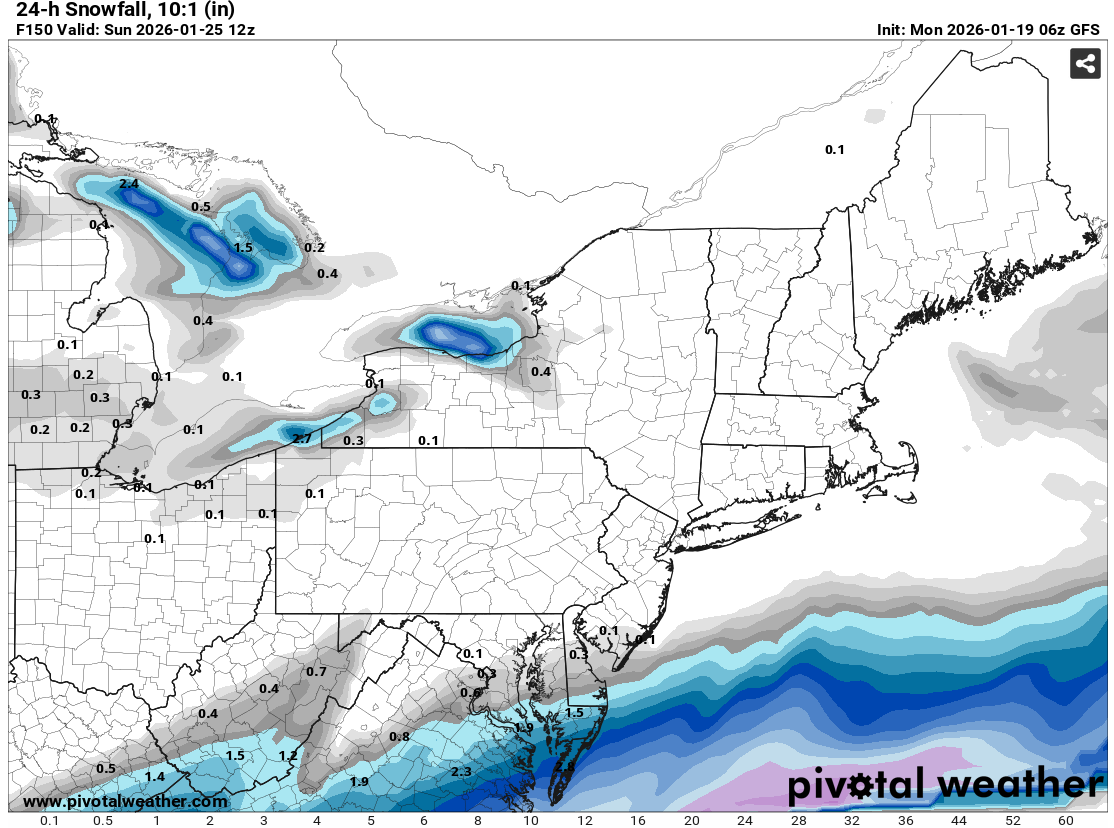
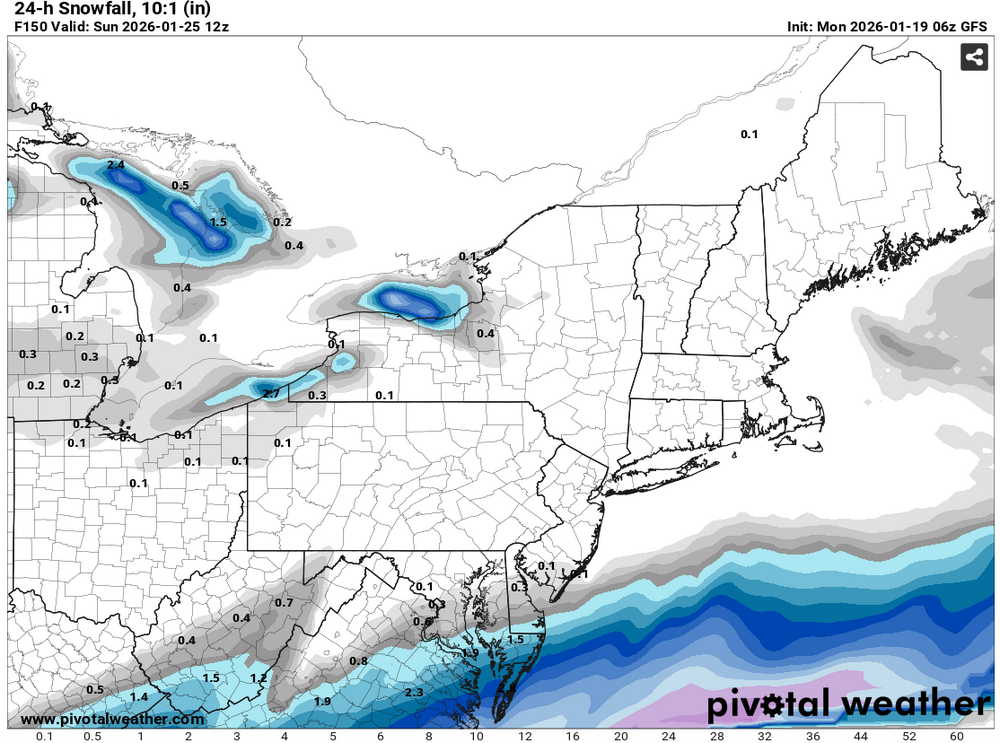
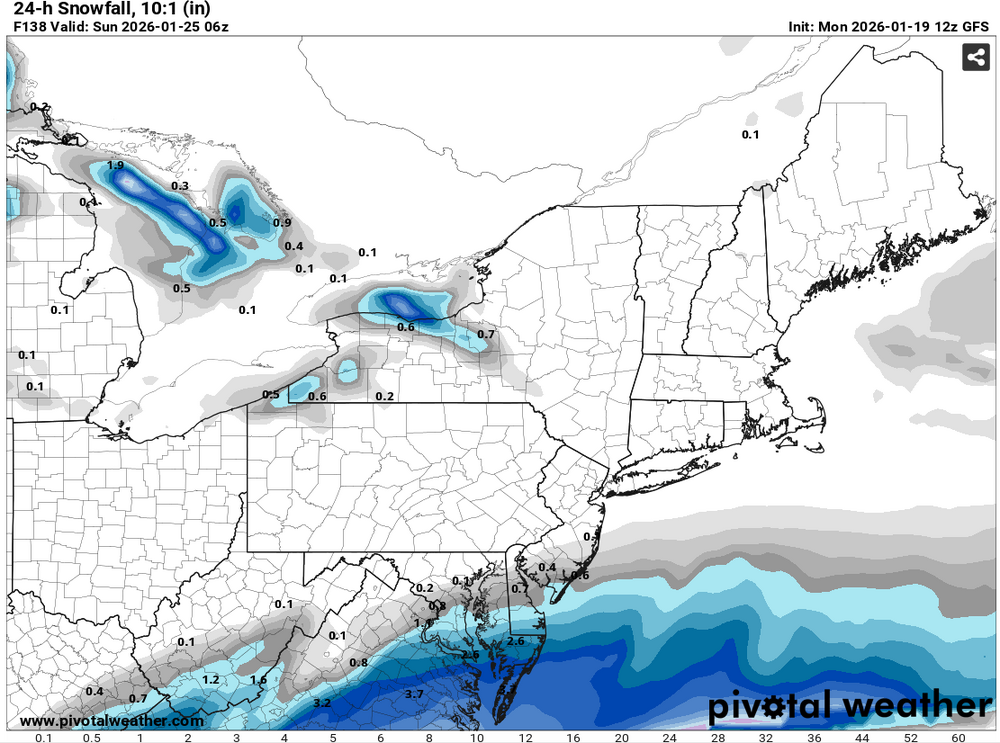
Comparison of the 1/19 6z and 12z GFS runs: 6z: 12z:
-
Storm potential January 17th-18th
donsutherland1 replied to WeatherGeek2025's topic in New York City Metro
Yes. You're right. Hopefully, the moderators can move my misplaced posts to the correct thread. -
Storm potential January 17th-18th
donsutherland1 replied to WeatherGeek2025's topic in New York City Metro
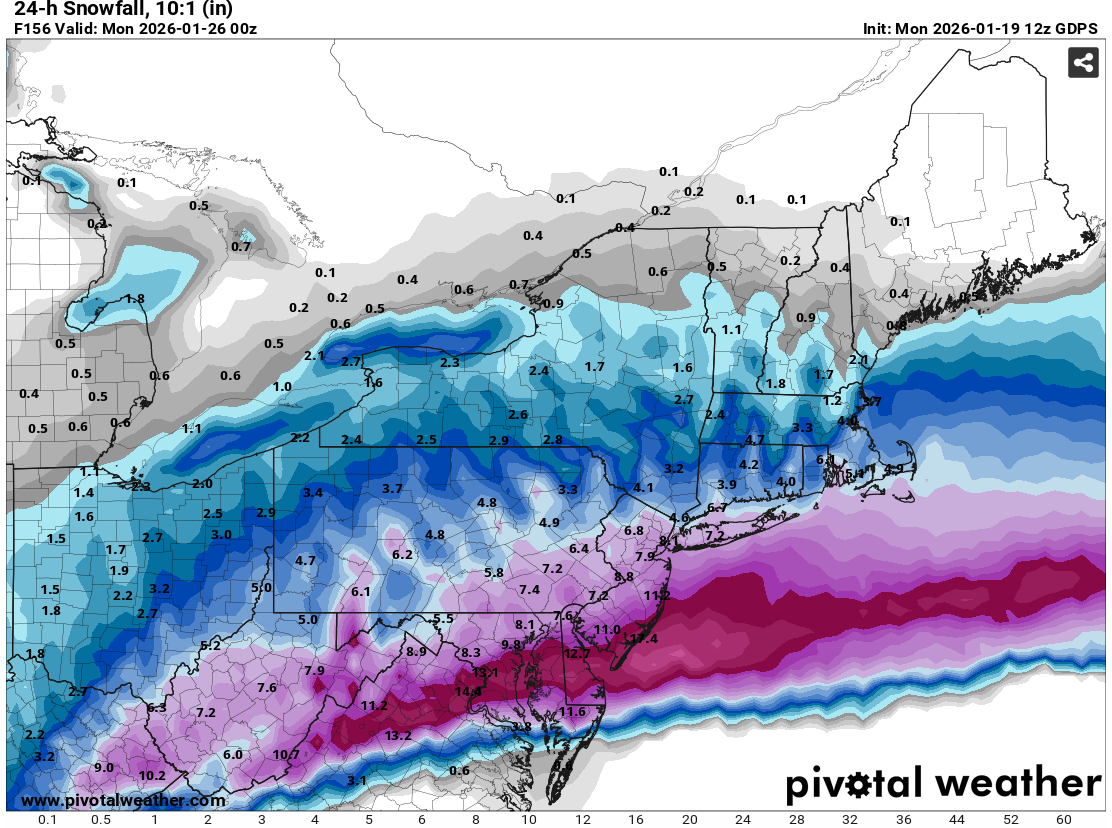
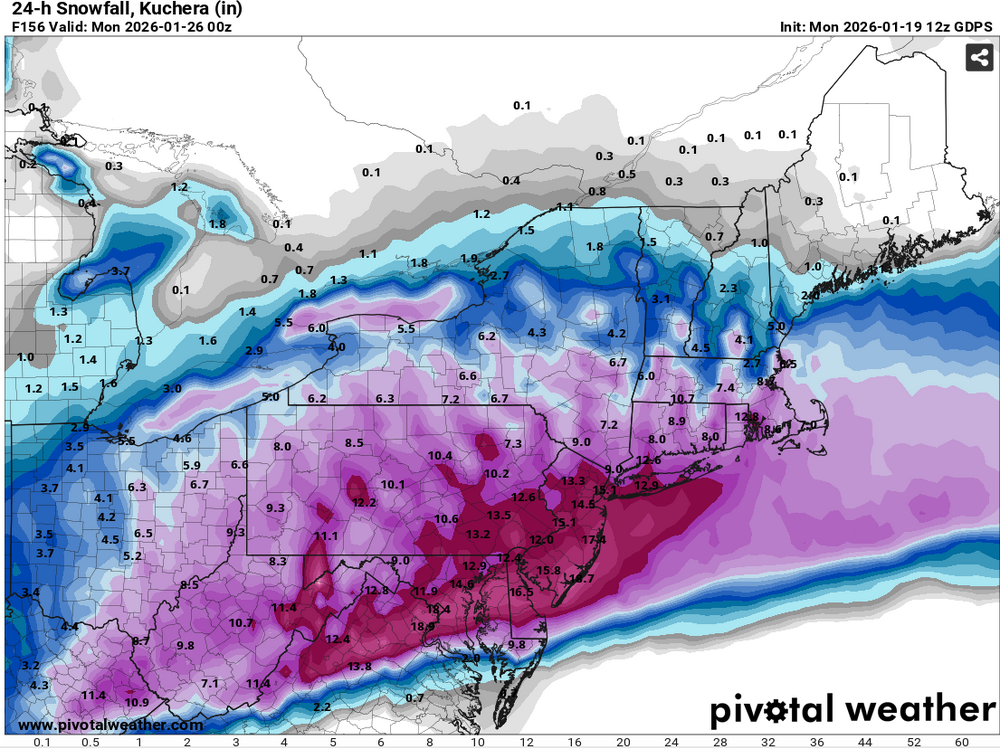
I made it from the 24-hour Pivotal weather QPF amounts. -
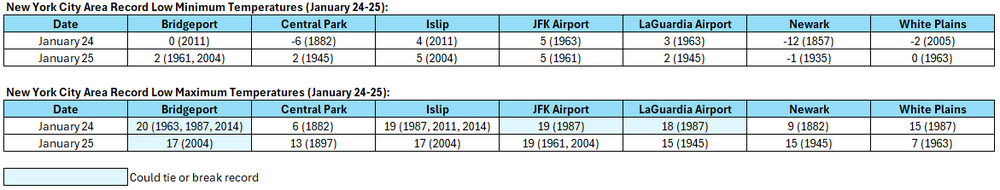
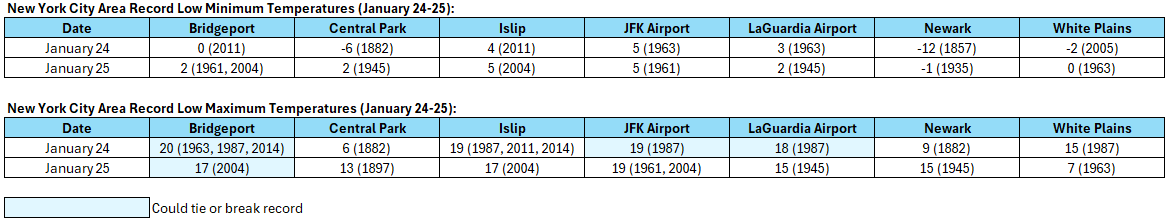
Places like Westhampton will likely see at least single digits, assuming clear skies and a lack of wind. Records for Westhampton are -7 on 1/24 and 1 on 1/25.
-
-
Only a few locations could tie or break record low maximum temperatures. Record low minimum temperatures are too low.