donsutherland1
-
Posts
24,181 -
Joined
Content Type
Profiles
Blogs
Forums
American Weather
Media Demo
Store
Gallery
Everything posted by donsutherland1
-
Snowfall totals:
-
Many thanks. It was a remarkable storm.
-
Great documentation of the storm, Alek. Would you mind if I added some of your photos to my winter storms photos site. Just let me know, as your email box was full.
-
It was exceptional. On January 12, 1974, the temperature fell to -33 at Lincoln, NE. The Arctic air mass never made it to the East Coast.
-
Oklahoma City reached -12 this morning. The only time it was at least as cold was the historic February 1899 Arctic blast.
-
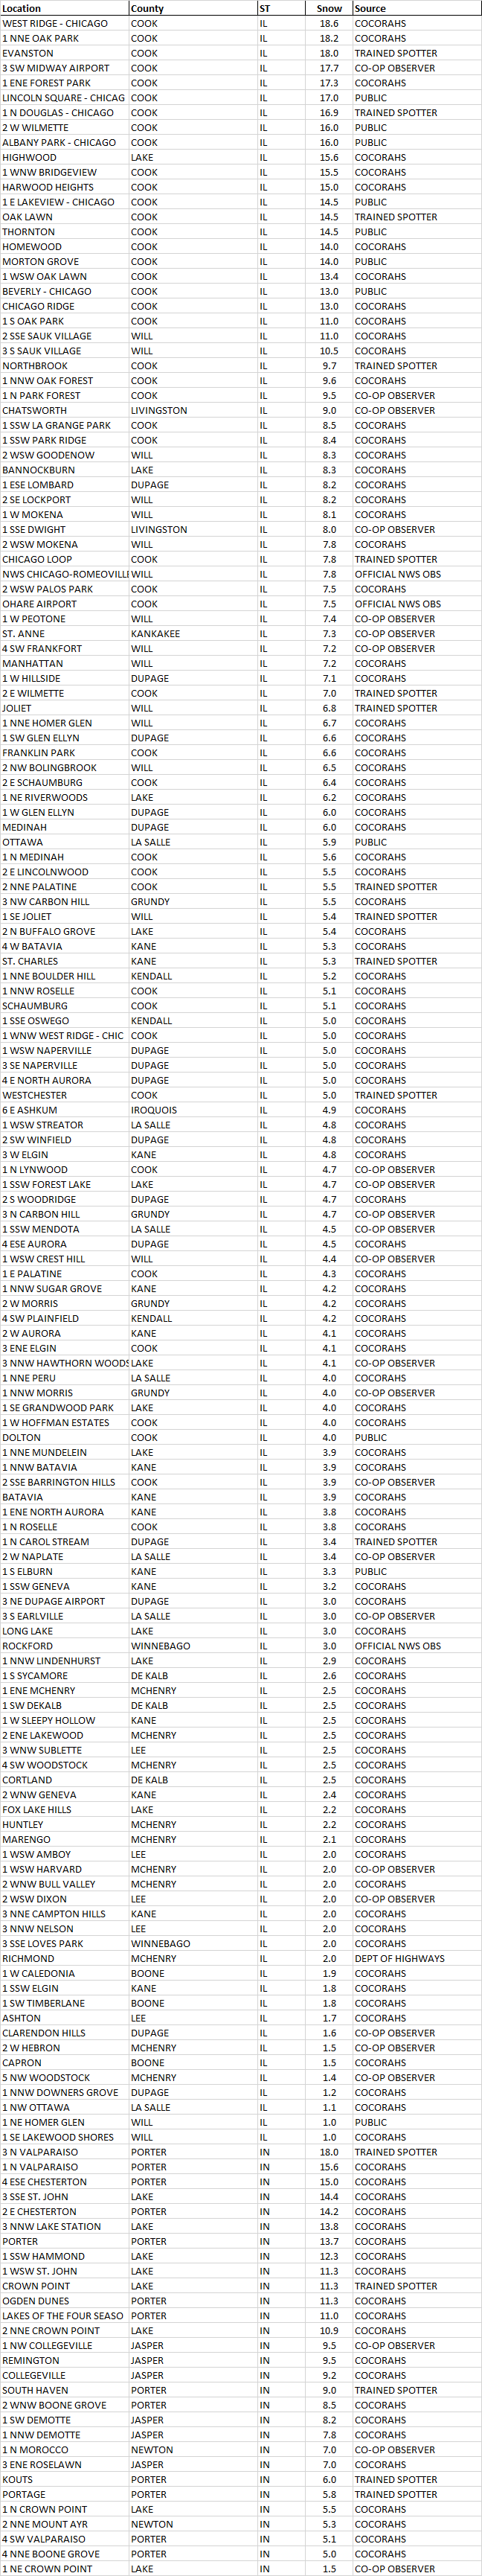
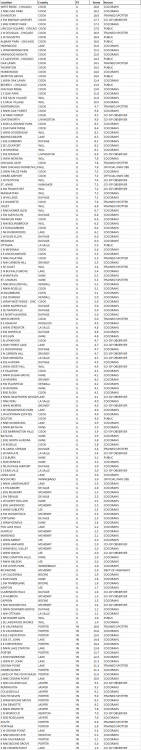
Morning thoughts... Through 7 am, precipitation totals included: Bridgeport: 0.77”; Islip” 0.60”; New York City: 0.82”; Newark: 0.83”; Philadelphia: 0.75”; Poughkeepsie: 0.45” (0.25” freezing rain); and, White Plains: 0.63”. Elsewhere, the wild weather continued. At Chicago’s O’Hare Airport 7.5” snow fell, but at Midway Airport, a lake-enhanced 17.7” was measured. Albany Park in Chicago also picked up 16.0” snow. This morning, the temperature dipped to -1° at Dallas. That was the coldest reading there since the temperature also reached -1° on December 23, 1989. It is only the fourth subzero low on record since record keeping began in September 1898. Rain will move away from the region this morning and the clouds will break. It will be unseasonably mild Temperatures will likely top out in the middle and upper 40s in most of the region. Likely high temperatures around the region include: New York City (Central Park): 47° Newark: 48° Philadelphia: 50° Tomorrow will be fair and cold before a storm brings accumulating snow to the region on Thursday. In the long-range, there reasonable consensus among the ensembles that a sustained milder pattern will develop around or just after February 20.
-
At 12:00 AM CST, 3 SW Midway Airport [Cook Co, IL] CO-OP OBSERVER reports HEAVY SNOW of 15.90 INCH. STORM TOTAL THUS FAR THROUGH MIDNIGHT. 10.5" FROM 6PM TO MIDNIGHT. SNOW DEPTH 25".
-
Feb 18-19 long duration manageable snow and ice event
donsutherland1 replied to wdrag's topic in New York City Metro
Central Park still needs 6.2” to reach 40.0”. -
This was a rare—probably once-in-a-lifetime—event. That so much notable weather was occurring across the CONUS from a foot of snow in Seattle to the extreme Arctic outbreak/snow in Texas to the heavy lake effect-enhanced snow affecting parts of the Great Lakes Region makes this a very special period in terms of weather history.
-
IEMBot LOT @iembot_lot · 1h At 7:05 PM CST, 3 N Valparaiso [Porter Co, IN] TRAINED SPOTTER reports SNOW of 13.30 INCH. EVENT TOTAL AS OF 7:05 PM CST. UPDATES PREVIOUS SNOW TOTAL FROM 3 N VALPARAISO. https://mesonet.agron.iastate.edu/lsr/#LOT/202102160105/202102160105
-
Incredible capture.
-
More than likely, the SSW was the result of the blocking. Sometimes, SSW’s cause blocking. At other times, they occur in response to strong and persistent blocking, as happened during winter 2009-10.
-
Precipitation will move into the region this evening or overnight. Philadelphia, Newark, and New York City will likely see mainly rain. Far north and west of those cities, a period of snow, sleet, and freezing rain is likely. An area running from northeastern Pennsylvania, across northwestern New Jersey, central New York State and extending across central New England could pick up 0.10"-0.25" freezing rain with some higher amounts. Upstate New York and northern New England will likely pick up a moderate snowfall (4" or more) with some higher amounts, especially across northern Vermont, northern New Hampshire and northern Maine. Precipitation amounts from New Philadelphia to Boston will generally average 0.50"-1.50". The heaviest amounts are likely to the north and west of those cities. Another storm could bring moderate to significant snow to parts of the Northeast on Thursday into Friday. This is the kind of storm that could have a swath of 3"-6" snows with locally higher amounts. Some accumulation is likely in Newark and New York City before a changeover to sleet and then rain takes place. Afterward, a pattern change will unfold as the Arctic Oscillation goes positive. Starting on or just after February 20, a period of warmer than normal temperatures is likely in the Middle Atlantic and southern New England areas. Today, many areas in the Plains States, including Texas, experienced a additional record and near record cold temperatures from what has been the coldest air mass in three decades in many parts of that region. Minimum temperatures through 7 pm EST included: Amarillo, TX: -11° (old record: -6°, 1895) ***Coldest since February 1, 1951*** Austin: 8° (old record: 20°, 1909) ***Coldest since December 23, 1989*** Broken Bow, NE: -37° (old record: -14°, 2007) Brownsville: 28° Corpus Christi: 17° (old record: 25°, 1895) ***Coldest since December 24, 1989*** Dallas: 4° (old record: 15°, 1909) ***Coldest since December 23, 1989*** Denver: -16° Galveston: 21° (old record: 24°, 1909) Houston: 16° (old record: 18°, 1905) ***Coldest since December 24, 1989*** Kansas City: -10° (old record: -6°, 1936) Lincoln, NE: -16° (old record: -11°, 1978) Lubbock, TX: 0° (old record: 8°, 1951) ***Coldest since December 23, 1989*** North Platte, NE: -29° (old record: -23°, 1881) ***Coldest since December 22, 1989*** Oklahoma City: -6° (old record: 7°, 1909) Omaha: -15° (old record: -12°, 1936) Ord, NE: -35° (old record: -14°, 2007) Shreveport: 16° (old record: 21°, 1905) Tulsa: -3° (old record: 3°, 1905) Whitehorse, YT: -32° (old record: -31°, 1954) Record low maximum temperatures included: Austin: 25° (old record: 38°, 1909) Corpus Christi: 31° (old record: 33°, 1895) Dallas: 14° (old record: 31°, 1909) ***Coldest since December 22, 1989*** Houston: 25° (old record: 32°, 1909) Lincoln, NE: -4° (old record: -1°, 1936)***Coldest since February 2, 1996*** Lubbock, TX: 14° (old record: 30°, 1978) Oklahoma City: 4° (old record: 17°, 1909) ***Coldest since December 22, 1989*** Omaha: -3° (old record: -1°, 1936) ***Coldest since February 2, 1996) Tulsa: 5° (old record: 17°, 1909) ***Coldest since December 24, 1983*** Additional records are likely through tomorrow morning. Dallas will likely see temperatures fall to the single digits and likely the coldest levels on record so late in the season tomorrow morning. Select Record Low Minimum Temperatures for February 16: Amarillo: -4°, 1895 Austin: 20°, 1903 Brownsville: 22°, 1895 Corpus Christi: 20°, 1895 Dallas: 12°, 1903 Galveston: 19°, 1895 Houston: 13°, 1895 Lubbock: 13°, 1979 Tomorrow, Dallas could tie the record for most consecutive days with minimum temperatures below 10°. The record of three consecutive days was set during January 11-13, 1912 when the temperature fell to 9°, 1°, and 7° respectively. Records for the Dallas-Fort Worth area go back to September 1898. The Arctic Oscillation (AO) is rocketing from its lowest levels in nearly eight years. The latest guidance suggests that the AO will likely reach positive values as early as tomorrow. The last time the AO was positive was December 25, 2020 when the AO was +0.226. Whether this development will mark the end of the prolonged period of blocking that has prevailed throughout winter 2020-21 or a temporary break, remains to be seen. A dramatic increase in the AO has sometimes coincided with storminess. Therefore, the February 14-24 period might offer a window of opportunity for a meaningful storm. That window of opportunity could extend through the end of February should blocking persist or return. Since 1950, there were 11 cases during the January 16-February 28 timeframe that saw the AO rise at least 3 sigma from a minimum value of -4.000 or below within a 7-day period. Four cases saw a major snowstorm in parts of the Middle Atlantic or New England regions within 3 weeks of the AO's reaching its minimum value. The dates of the AO's minimum value for those four cases with storm dates in parentheses are January 25, 1958 (February 14-17, 1958 NESIS: 6.25), January 19, 1969 (February 8-10, 1969 NESIS: 3.51), February 15, 1969 (February 22-28, 1969 NESIS: 4.29), and January 16, 2016 (January 22-24, 2016 NESIS: 7.66). The ENSO Region 1+2 anomaly was -0.2°C and the Region 3.4 anomaly was -0.7°C for the week centered around February 3. For the past six weeks, the ENSO Region 1+2 anomaly has averaged -0.65°C and the ENSO Region 3.4 anomaly has averaged -1.00°C. La Niña conditions will likely prevail at least through meteorological winter. The SOI was +6.72 today. The preliminary Arctic Oscillation (AO) figure was -0.389 today On February 14 the MJO was in Phase 7 at an amplitude of 2.880 (RMM). The February 13-adjusted amplitude was 2.725. Based on the latest guidance, no significant stratospheric warming event is likely into the closing days of February. The significant December 16-17 snowstorm during what has been a blocky December suggests that seasonal snowfall prospects have increased especially from north of Philadelphia into southern New England. At New York City, there is a high probability based on historic cases that an additional 20" or more snow will accumulate after December. Since January 1, New York City has picked up 23.3" snow. Winters that saw December receive 10" or more snow, less than 10" in January, and then 10" or more in February, saw measurable snowfall in March or April in 83% of cases. Winter 2009-2010 was the exception where only a trace of snow was recorded. This group of winters saw 6" or more snow during the March-April period in 50% of the cases. All said, it is more likely than not that there will be measurable snowfall after February. Based on sensitivity analysis applied to the latest guidance, there is an implied 81% probability that New York City will have a colder than normal February. February will likely finish with a mean temperature near 33.0° (2.3° below normal).
-
Probably in 1895 and/or 1899, but I am not aware of documentation.
-
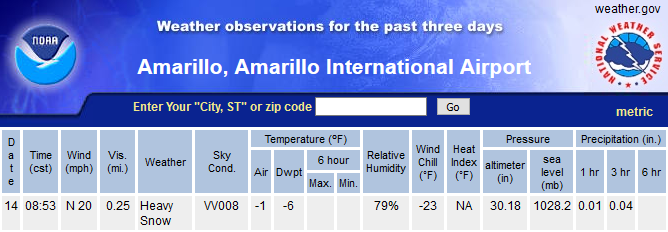
Morning thoughts... A record cold air mass moved into Texas yesterday producing widespread snow. Snowfall amounts included: Amarillo: 4.1”; Austin: 1.0”; Dallas: 4.0” (old record: 3.0”, 1951); and, Lubbock: 1.6”. Widespread record cold was present this morning. In the Pacific Northwest, the three-day snowstorm came to an end in Seattle with rain. The final accumulation was 12.4”,. At 8:40 am, some patches of freezing rain moving across southeast New York State. It will be mostly cloudy with some pockets of freezing drizzle and drizzle. Steadier precipitation will begin moving into the region this afternoon or this evening. An area running east-northeastward from northeast Pennsylvania to central New England will likely pick up 0.25”-0.50” freezing rain with locally higher amounts. A general 0.50”-1.50” precipitation is likely from Philadelphia to Boston. Temperatures will likely top out in the middle 30s in most of the region. Likely high temperatures around the region include: New York City (Central Park): 37° Newark: 36° Philadelphia: 38° Precipitation will end tomorrow and it will be noticeably milder for a time in parts of the region. In the long-range, there reasonable consensus among the ensembles that a sustained milder pattern will develop around or just after February 20.
-
At 8 pm MST, the temperature in Denver had fallen to -13°. That breaks the previous daily record low temperature of -10°, which was set in 1903.
-
Tomorrow will see some patches of light freezing rain or freezing drizzle in the morning before a storm spreads precipitation into the region during the afternoon or evening. Philadelphia, Newark, and New Jersey will likely see mainly rain. Well north and west of those cities, a period of snow, sleet, and freezing rain is likely. An area running from northeastern Pennsylvania, across northwestern New Jersey, central New York State and extending across central New England could pick up 0.25"-0.50" freezing rain with some higher amounts. Upstate New York and northern New England will likely pick up a moderate snowfall (4" or more). Precipitation amounts from Philadelphia to Boston will generally average 0.50"-1.50". The heaviest amounts are likely to the north and west of those cities. Another storm could bring moderate to significant snow to parts of central and upstate New York into central and northern New England on Thursday into Friday. There could be some accumulation even in Newark and New York City before a changeover to sleet and then rain takes place. Afterward, a change in the pattern will unfold as the Arctic Oscillation goes positive. On or just after February 20, a period of warmer than normal temperatures is likely in the Middle Atlantic and southern New England areas. Parts of Canada and the Plains States, including Texas, experienced a continuation of record and near record cold temperatures from what has been the coldest air mass since December 1989 and February 1994 in parts of that region. Minimum temperatures through 6 pm EST included: Amarillo, TX: -1° Casper: -20° (old record: -14°, 2010) Dallas: 13° (old record: 15°, 1905, 1909, and 1936) Denver: -10° (tied record set in 1903) Lubbock, TX: 5° (old record: 12°, 2004) Norway House, MB: -37° (old record: -31°, 2008) Winnipeg: -31° Record low maximum temperatures included: Amarillo: 8° (old record: 12°, 1895) Austin: 30° (old record: 33°, 1951) Brownsville: 41° (old record: 44°, 1951) Chicago: 4° (old record: 8°, 1879 and 1943) Dallas: 22° (old record: 27°, 1951) Kansas City: 4° (old record: 7°, 1936) Lubbock, TX: 14° (old record: 25°, 2007) ***Tied February Record set on February 2, 2011*** Oklahoma City: 12° (old record: 20°, 1951) San Antonio: 30° (tied record set in 1895) St. Louis: 8° (old record: 19°, 1875 and 1943) Additional records are likely through Tuesday morning. Dallas will likely see temperatures fall to the single digits and likely the coldest levels on record so late in the season tomorrow morning. On Monday, the high temperature at Dallas could also challenge that city's record for the lowest maximum temperature on record. That record is 12°, which was set on February 12, 1899. Select Record Low Maximum Temperatures for February 15: Amarillo: 6°, 1895 Austin: 38°, 1909 Brownsville: 50°, 2007 Corpus Christi: 33°, 1895 Dallas: 31°, 1909 Houston: 32°, 1909 Lubbock: 30°, 1978 Select Record Low Minimum Temperatures for February 15: Amarillo: -6°, 1895 Austin: 20°, 1909 Brownsville: 25°, 1895 Corpus Christi: 25°, 1895 Dallas: 15°, 1909 Houston: 18°, 1905 Lubbock: 8°, 1951 The Arctic Oscillation (AO) is now rebounding from its lowest levels in nearly eight years. It is forecast to rise sharply in coming days. The latest guidance suggests that the AO will likely reach positive values for the first time since December 25, 2020 when the AO was +0.226. Whether this development will mark the end of the prolonged period of blocking that has prevailed throughout winter 2020-21, or a temporary break, remains to be seen. A dramatic increase in the AO has sometimes coincided with storminess. Therefore, the February 14-24 period might offer a window of opportunity for a meaningful storm. That window of opportunity could extend through the end of February should blocking persist or return. Since 1950, there were 11 cases during the January 16-February 28 timeframe that saw the AO rise at least 3 sigma from a minimum value of -4.000 or below within a 7-day period. Four cases saw a major snowstorm in parts of the Middle Atlantic or New England regions within 3 weeks of the AO's reaching its minimum value. The dates of the AO's minimum value for those four cases with storm dates in parentheses are January 25, 1958 (February 14-17, 1958 NESIS: 6.25), January 19, 1969 (February 8-10, 1969 NESIS: 3.51), February 15, 1969 (February 22-28, 1969 NESIS: 4.29), and January 16, 2016 (January 22-24, 2016 NESIS: 7.66). The ENSO Region 1+2 anomaly was -0.2°C and the Region 3.4 anomaly was -0.7°C for the week centered around February 3. For the past six weeks, the ENSO Region 1+2 anomaly has averaged -0.65°C and the ENSO Region 3.4 anomaly has averaged -1.00°C. La Niña conditions will likely prevail at least through meteorological winter. The SOI was +5.00 today. The preliminary Arctic Oscillation (AO) figure was -2.131 today On February 13 the MJO was in Phase 7 at an amplitude of 2.724 (RMM). The February 12-adjusted amplitude was 2.611. Based on the latest guidance, no significant stratospheric warming event is likely through the end of the third week of February. The significant December 16-17 snowstorm during what has been a blocky December suggests that seasonal snowfall prospects have increased especially from north of Philadelphia into southern New England. At New York City, there is a high probability based on historic cases that an additional 20" or more snow will accumulate after December. Since January 1, New York City has picked up 23.3" snow. Winters that saw December receive 10" or more snow, less than 10" in January, and then 10" or more in February, saw measurable snowfall in March or April in 83% of cases. Winter 2009-2010 was the exception where only a trace of snow was recorded. This group of winters saw 6" or more snow during the March-April period in 50% of the cases. All said, it is more likely than not that there will be measurable snowfall after February. Based on sensitivity analysis applied to the latest guidance, there is an implied 81% probability that New York City will have a colder than normal February. February will likely finish with a mean temperature near 32.7° (2.6° below normal).
-
March 1969 snowfall amounts included: JFK: 3.5", LGA: 4.4", NYC: 5.6".
-
It’s here: https://www.americanwx.com/bb/topic/54543-feb-18-19-potential-1-2-qpf-into-the-snow-pack-possible-dangerous-icing-i84-corridor/
-
At 11 am CST, frigid air continued to push into Texas. Select temperatures: Amarillo: 0° (low so far: -1°) Dallas-Fort Worth: 17° Houston: 34° Lubbock: 6° (low so far: 5°; old record: 12°, 2004) The temperature in Houston will likely reach the teens tomorrow morning. The last time that happened was January 17, 2018 when the temperature fell to 19°. The last time before that was January 8, 1996 when the temperature also fell to 19°. Overall, Houston can expect its lowest temperature since December 24, 1989 when the mercury dipped to 11°. Select temperature levels and most recent occurrences: Amarillo: < 0°: February 14, 2021: -1° (through 11 am CST) < -1°: January 7, 2017: -3° < -3°: February 10, 2011: -6° < -6°: December 22, 1989: -8° < -8°: February 11, 1986: -12° < -12°: February 1, 1951: -14° Dallas-Fort Worth: < 16°: January 17, 2018: 13° < 13°: February 4, 1996: 8° < 8°: December 23, 1989: -1° Houston: < 20°: January 17, 2018: 19° < 19°: December 24, 1989: 11° Lubbock: < 10°: February 14, 2021: 5° (through 11 am CST) < 5°: January 1, 2018: 4° < 4°: February 2, 2011: 2° < 2°: December 23, 1989: -1° < -1°: December 22, 1989: -2° < -2°: January 5, 1971: -4° < -4°: January 13, 1963: -16°
-
I remember that heat very well.
-
The sample size is too small to draw conclusions. Below are the outcomes for the February cases where the AO reached -5.000 or below: February 1969: Blocking continued through much of March with 28 days on which the AO was negative and 23 days on which it was -1.000 or below: Minimum: -3.469, March 19. February 1978: Blocking effectively ended after the first week of March. Minimum: -3.217, March 4. February 2010: Blocking returned in late March. Minimum: -2.251, March 28. Winter 2009-10 saw only a trace of snow for the March-April 2010 period.
-
-
There was. Since 1950, there were 11 cases during the January 16-February 28 timeframe that saw the AO rise at least 3 sigma from a minimum value of -4.000 or below within a 7-day period. Four cases saw a major snowstorm in parts of the Middle Atlantic or New England regions within 3 weeks of the AO's reaching its minimum value. The dates of the AO's minimum value for those four cases with storm dates in parentheses are January 25, 1958 (February 14-17, 1958 NESIS: 6.25), January 19, 1969 (February 8-10, 1969 NESIS: 3.51), February 15, 1969 (February 22-28, 1969 NESIS: 4.29), and January 16, 2016 (January 22-24, 2016 NESIS: 7.66).
-
Morning thoughts... Record-cold is now advancing through Texas with falling temperatures and snow. At Dallas, the 6 am CST temperature was 18°. The daily record low maximum temperature of 27°, which was set in 1951, will very likely be broken today. The temperature will then plunge into the single digits tonight. In the Pacific Northwest, Seattle picked up 8.9” snow yesterday. That was Seattle’s biggest daily snowfall since January 27, 1969 when 14.9” snow fell and its 12th biggest daily snowfall on record, tied with December 23, 1965. The daily record for February 13 was 1.1” from 1986. In the northern Middle Atlantic and southern New England regions, much quieter weather will prevail today. It will be mostly cloudy with some pockets of freezing drizzle and drizzle. Temperatures will likely top out in the middle 30s in most of the region. Likely high temperatures around the region include: New York City (Central Park): 36° Newark: 36° Philadelphia: 37° Tomorrow will likely see precipitation overspread the area. In the long-range, there is growing consensus among the ensembles that a sustained milder pattern will develop around or just after February 20.