donsutherland1
-
Posts
24,176 -
Joined
Content Type
Profiles
Blogs
Forums
American Weather
Media Demo
Store
Gallery
Everything posted by donsutherland1
-
Some further commentary in the wake of the ECMWF-AIFS's now consistently outperforming the ECMWF and Google DeepMind's rapid improvement in hurricane track forecasting on how I expect AI to transform the meteorological space over the next decade or two. My thoughts follow with the caveat that I do not possess a crystal ball. This is based largely on how AI has evolved very recently and the assumption that further improvements and integration with other technologies will occur. Prompt libraries executed by agentic AI would interpret/translate modeled outcomes at a local and even hyper-local street-by-street level, generate basic and customized maps/visualizations by tapping into Python and other programming libraries, disseminate a wide range of personalized information through Apps, etc. This will radically change existing value propositions. It would shift substantial value to the public and consumers/users of weather information. It would also upend business models based on charging for maps and graphics that are often based on freely available raw data simply due to the public's lack of access to the ability to generate such graphics on their own (programming knowledge to software). The evolution of AI would also dramatically change the nature of the meteorology profession from routine forecasting to communication of risk/uncertainty, mesoscale/microscale specialist, emergency response consulting, research, etc. I suspect that fairly routine things like 7-day forecasts, marine forecasts, hourly forecasts will be largely automated in a decade or two. Humans will focus more on communicating risk, identifying rare outcomes that could lie outside the AIs' training, advising proactive responses (evacuations, school closures/delays, etc.), and providing judgment in complex situations. AI would largely devalue the hype-based business models that have proliferated on social media to the detriment of professional credibility and public well-being, as the AI-driven outcomes available at little or no cost would be vastly superior to the hypecasters' products, services, and click-bait. Moreover, the AIs will allow users to verify the accuracy of the AI-driven forecasts enhancing credibility for the AI products/services. AI will also integrate large amounts of additional information to provide impacts assessments. AI will translate weather data into information concerning supply chain disruptions, energy demand, insurance exposure, traffic patterns, effects on crops, etc. These AI-driven impact models will likely be offered by major AI companies (Google, etc.) at much lower cost than under today's business models. That will also shift value to the AI companies who will be providing the service and the users of such information who will benefit from discounted pricing. Second order effects could also be unlocked for consumers of products/services (grocery prices, energy prices, etc.). In the end, this won't be the first time that technological change led to broad transformation. Almost certainly, it won't be the last time, either.
-
February 2026 OBS & Discussion
donsutherland1 replied to Stormlover74's topic in New York City Metro
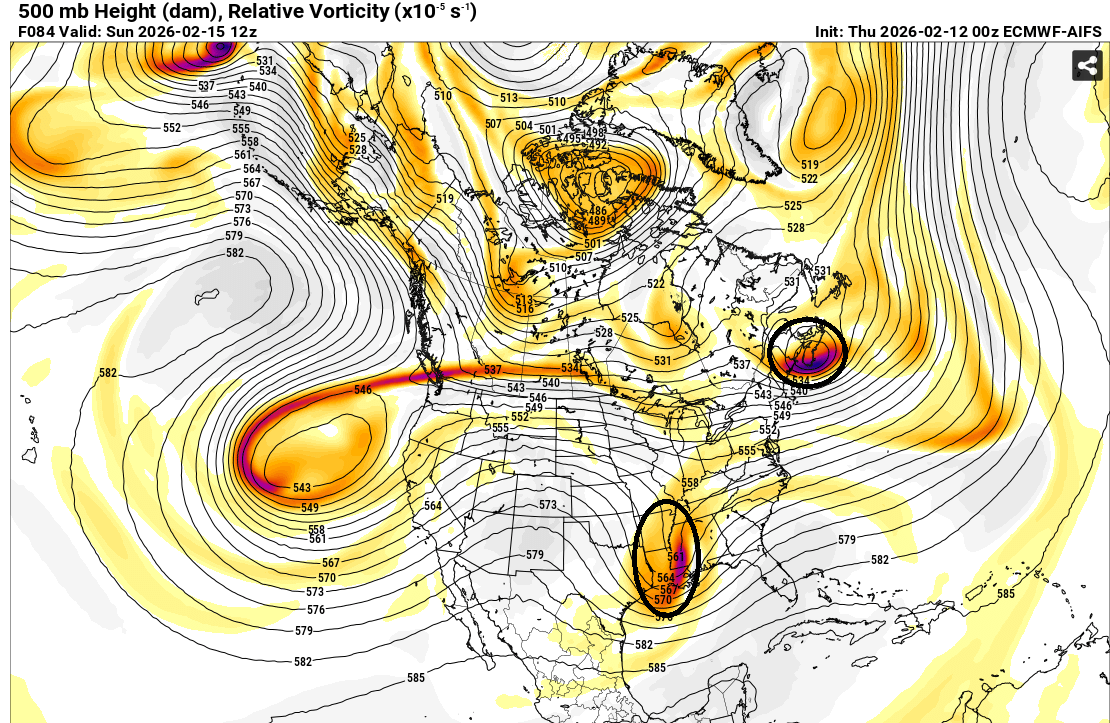
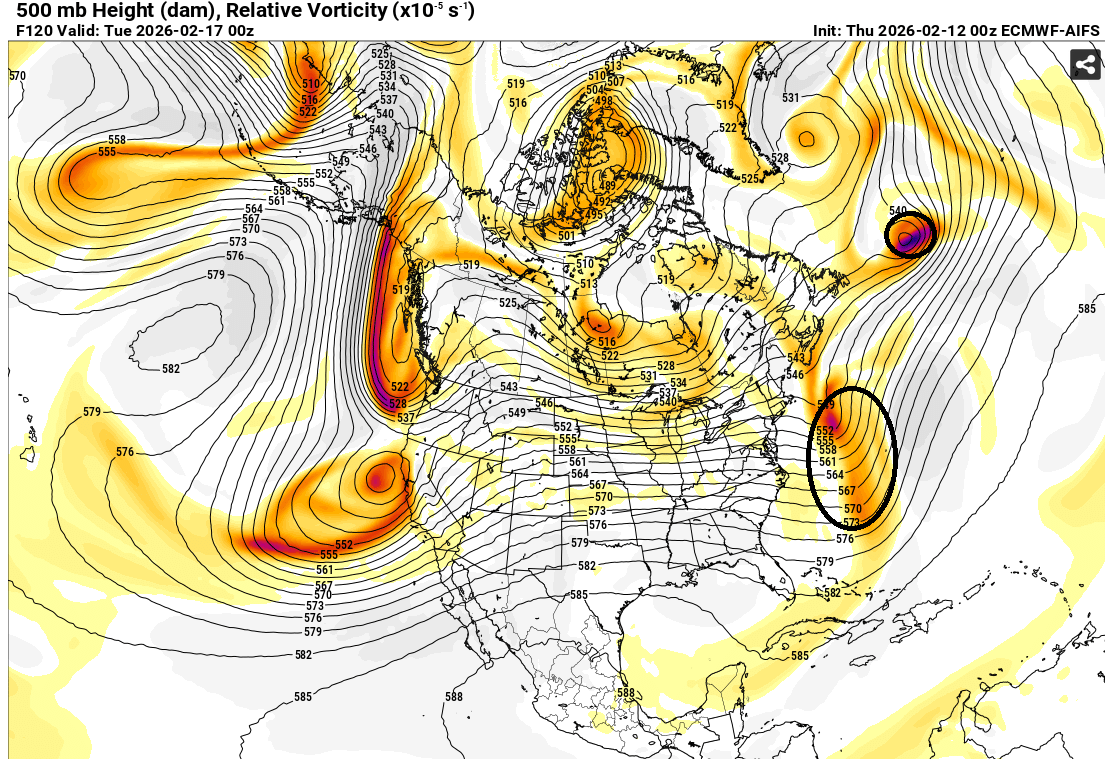
The ECMWF-AIFS is moving into it s high-skill range, where it continues to outperform the non-AI guidance. It continues to show very little prospect for the kind of occasional snowy solution that has popped up from time to time on some of the guidance. At 500 mb, its map tells the story about the low probability of phasing. The northern energy is well in front of the southern energy. This limits the risk of interaction, much less phasing. Not surprisingly, the other guidance now appears to be in line with the AIFS, with none showing a snowy solution for the NYC area. If one looks at the EPS ensembles, 16% showed 6" or more snow and fewer than 6% of members showed 10" or more snow during the 2/12 0z cycle vs. the respective 22% and 12% during the 2/11 0z cycle (in which the operational ECMWF showed a phased solution). Although it's premature to suggest that precipitation, should it arrive, cannot start as a little snow, sleet or mixed precipitation, the idea of a phased solution with significant snowfall appears unlikely. As has been the case much of this winter, should that outcome verify, the ECMWF-AIFS will again have led the way at an impressive lead time. Finally, the ECMWF-AIFS map 36 hours later shows a distinct failure to phase.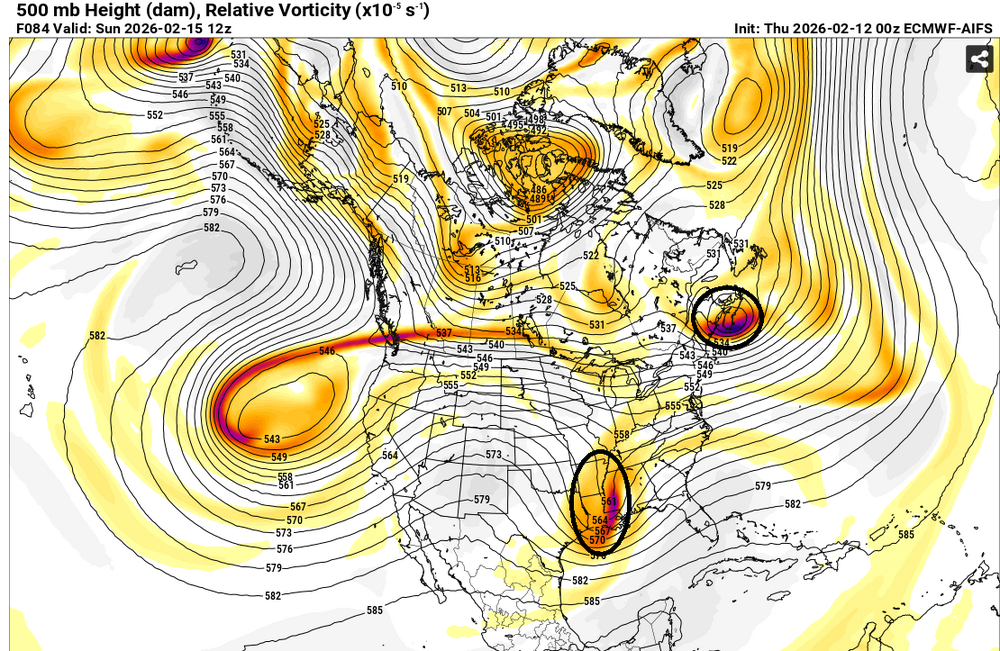

-
February 2026 OBS & Discussion
donsutherland1 replied to Stormlover74's topic in New York City Metro
It will turn somewhat cooler to close the week. Temperatures will mainly top out in the middle to upper 30s on Thursday and Friday. The weekend will see highs in the upper 30s and lower 40s. It could become even milder with highs in the lower to perhaps middle 40s next week. Precipitation could arrive on Sunday or Monday. The ENSO Region 1+2 anomaly was +0.3°C and the Region 3.4 anomaly was -0.5°C for the week centered around February 4. For the past six weeks, the ENSO Region 1+2 anomaly has averaged -0.25°C and the ENSO Region 3.4 anomaly has averaged -0.52°C. La Niña conditions will likely continue into at least late winter. The SOI was -1.20 today. The preliminary Arctic Oscillation (AO) was -1.676 today. Based on sensitivity analysis applied to the latest guidance, there is an implied near 91% probability that New York City will have a cooler than normal February (1991-2020 normal). February will likely finish with a mean temperature near 31.5° (4.4° below normal). Supplemental Information: The projected mean would be 3.8° below the 1981-2010 normal monthly value. Overall, Winter 2025-2026 is on track for a seasonal mean temperature of 31.9°. That would be the lowest winter mean temperature since Winter 2014-2015 when the mean temperature was 31.7°. Winter 2025-2026 would only become the fourth winter of the 21st century with a mean temperature of 32.0° or below. -
February 2026 OBS & Discussion
donsutherland1 replied to Stormlover74's topic in New York City Metro
The April 1841 snowstorm was a really big one from parts of the Mid-Atlantic region into New England. Philadelphia received at least 8”. NYC picked up a foot. Some parts of New England saw 20”. -
February 2026 OBS & Discussion
donsutherland1 replied to Stormlover74's topic in New York City Metro
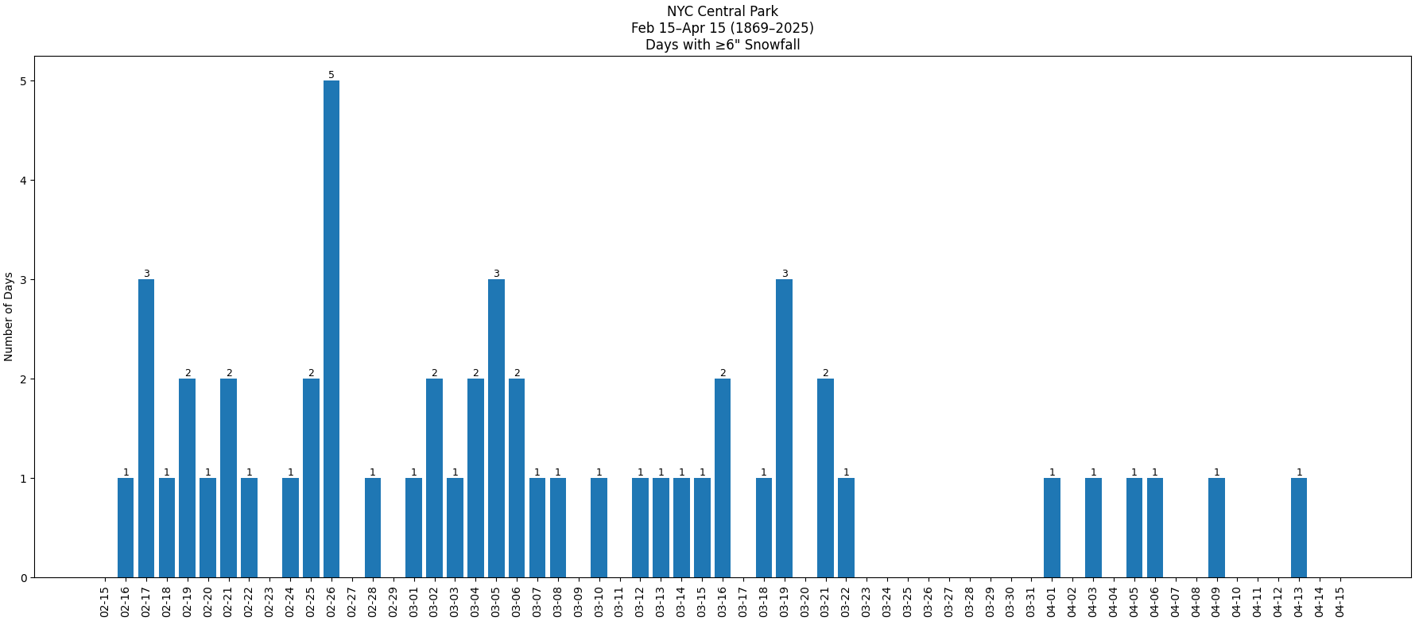
I agree. I think it's a statistical artifact, but can't rule out other factors being involved e.g., an increase in baroclinicity in early April that allows for occasional big storms even as the weather is warming. Interestingly enough, one finds a similar dearth of 6" or above daily snowfalls during March 23-31 in Newark where records go back even farther to 1843.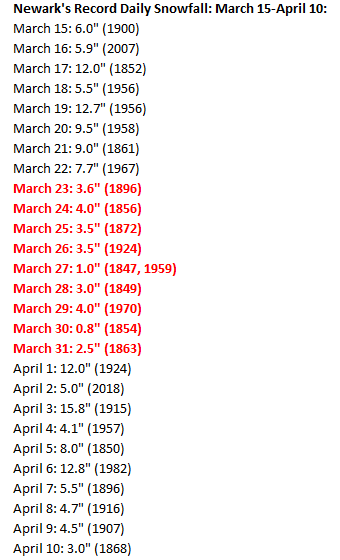
-
February 2026 OBS & Discussion
donsutherland1 replied to Stormlover74's topic in New York City Metro
The operational ECMWF abandoned its call for a big snowstorm, but its AI cousin maintained continuity from its earlier cycles with its call for a lack of snow. FWIW, I've seen some complaints on social media concerning the EC-AIFS. They concern the model's being a "black box." At this point, given what I've seen, it's probably better that the AIFS is, in fact, a "black box," as it limits the ability of those who don't like what they see from injecting their own biases into the mix; a lot of that occurs when the non-AI model solutions are pulled apart (often yielding incorrect solutions from the injection of subjectivity). The AIFS has done quite well this winter, especially within four days. It has sometimes seen changes, but its run-to-run continuity is generally better than its non-AI counterparts, aside from its accuracy. This allows for longer lead time without compromising accuracy.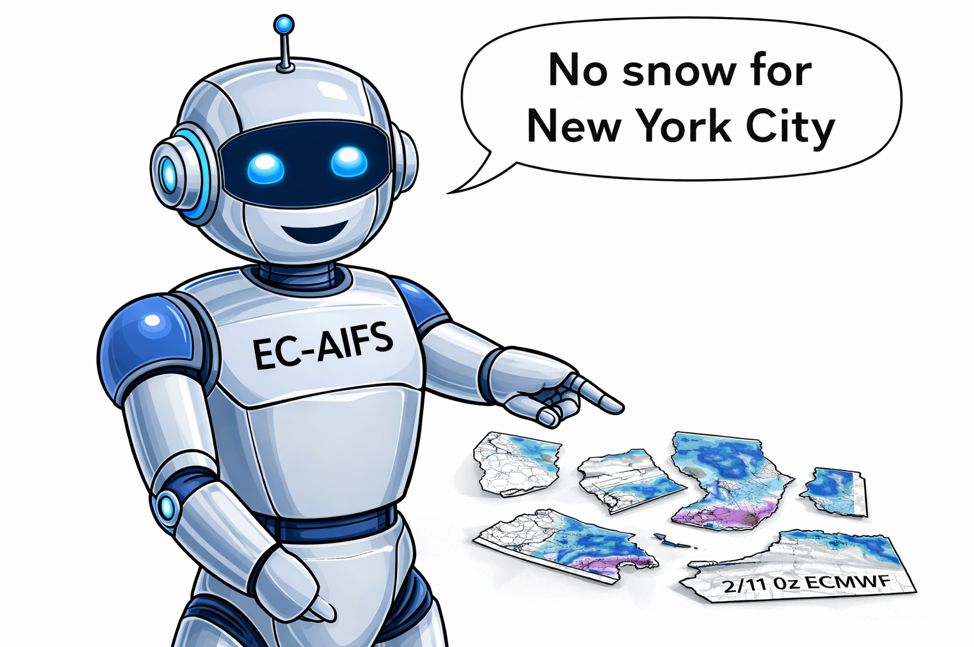
-
February 2026 OBS & Discussion
donsutherland1 replied to Stormlover74's topic in New York City Metro
And its AI cousin says: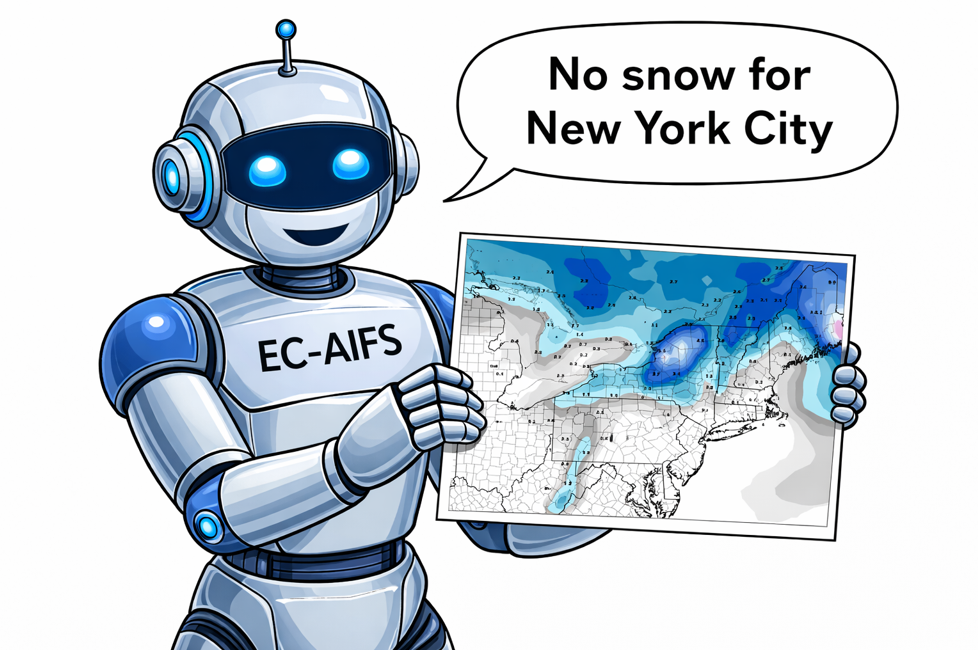
-
February 2026 OBS & Discussion
donsutherland1 replied to Stormlover74's topic in New York City Metro
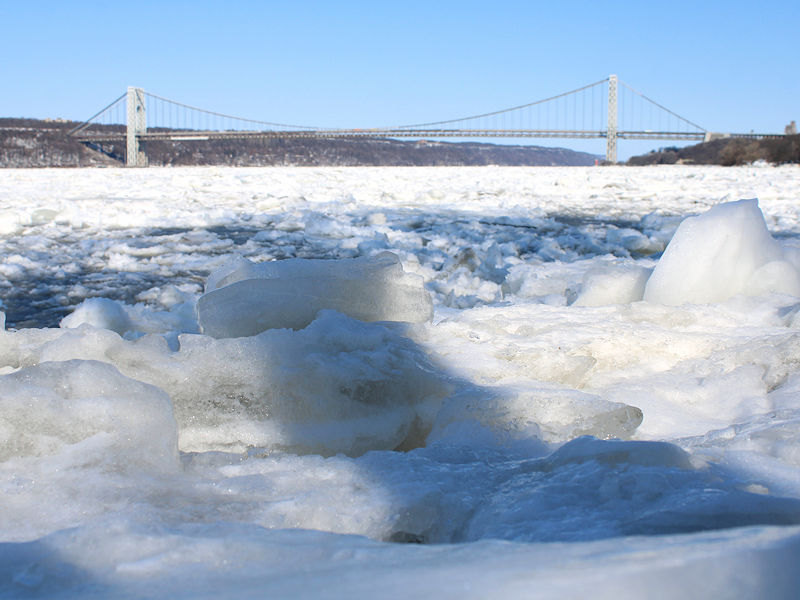
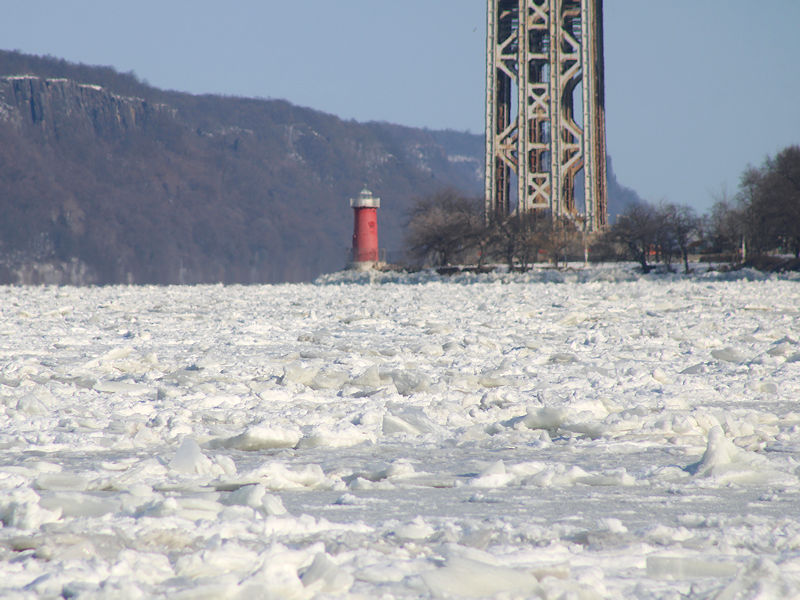
From last night's light freezing rain: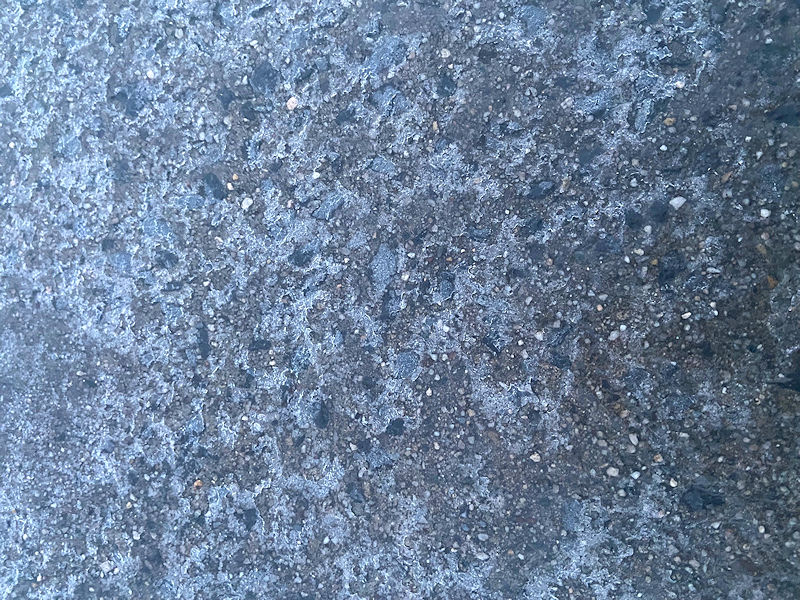

-
February 2026 OBS & Discussion
donsutherland1 replied to Stormlover74's topic in New York City Metro
The persistent and often severely cold pattern is now breaking. Tomorrow will be even milder with the temperature topping out in the upper 30s. A few places could reach 40°. A cold front will likely cross the region, possibly touching off a few snow flurries or rain showers. It will turn somewhat cooler into the weekend. By early next week highs will mainly be in the upper 30s and lower 40s with lows in the lower 30s. 20s are possible outside New York City. Precipitation could arrive on Sunday or Monday. The ENSO Region 1+2 anomaly was +0.3°C and the Region 3.4 anomaly was -0.5°C for the week centered around February 4. For the past six weeks, the ENSO Region 1+2 anomaly has averaged -0.25°C and the ENSO Region 3.4 anomaly has averaged -0.52°C. La Niña conditions will likely continue into at least late winter. The SOI was +5.72 today. The preliminary Arctic Oscillation (AO) was -2.407 today. Based on sensitivity analysis applied to the latest guidance, there is an implied near 91% probability that New York City will have a cooler than normal February (1991-2020 normal). February will likely finish with a mean temperature near 31.3° (4.6° below normal). Supplemental Information: The projected mean would be 4.0° below the 1981-2010 normal monthly value. Overall, Winter 2025-2026 is on track for a seasonal mean temperature of 31.9°. That would be the lowest winter mean temperature since Winter 2014-2015 when the mean temperature was 31.7°. Winter 2025-2026 would only become the fourth winter of the 21st century with a mean temperature of 32.0° or below. -
2025-2026 ENSO
donsutherland1 replied to 40/70 Benchmark's topic in Weather Forecasting and Discussion
While I believe it could still turn colder to end February as per the ECMWF weeklies, I tend to agree that the risk of a return of severe cold in the East is probably largely over. -
2025-2026 ENSO
donsutherland1 replied to 40/70 Benchmark's topic in Weather Forecasting and Discussion
If one takes off about 2.5°, they'd be about as common as they once were. -
2025-2026 ENSO
donsutherland1 replied to 40/70 Benchmark's topic in Weather Forecasting and Discussion
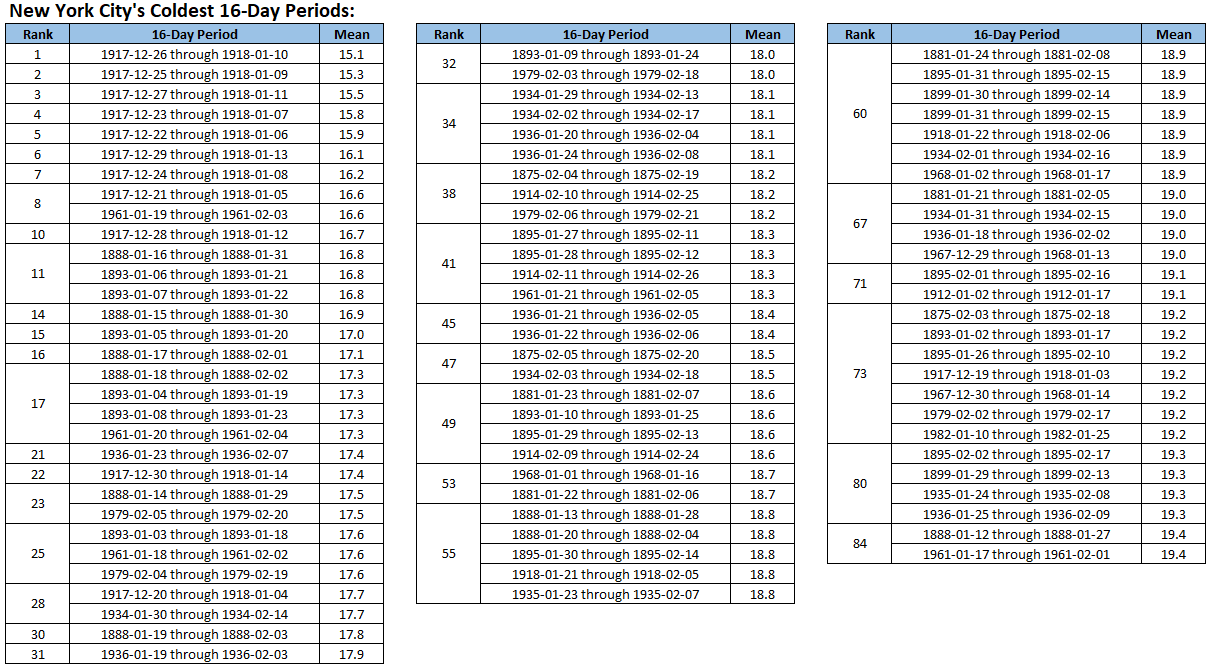
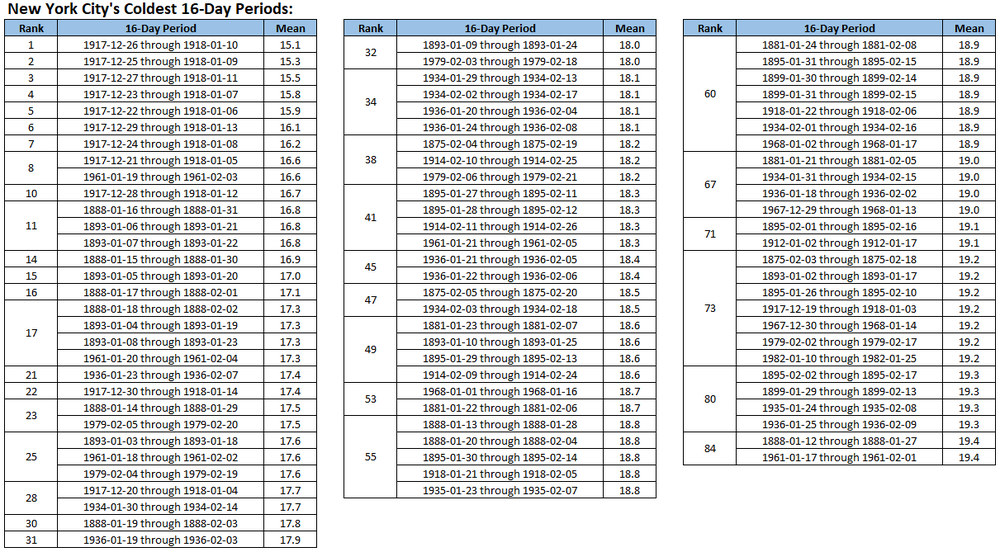
The world is warmer than it has been and is continuing to warm largely due to anthropogenic greenhouse gas emissions. Extreme cold periods are becoming warmer and less frequent than they once were. Nevertheless, that does not mean that such cold, when it occurs regionally, should be dismissed out-of-hand. The kind of sustained deep cold that has occurred in the Great Lakes Region and Northeast is uncommon today. It is not trivial. It is one of this winter's highlights. For example, New York City saw a 16-day mean temperature below 20° for the 125th time since record-keeping began in 1869. However, it was the first such occurrence since 1982. That was 44 years ago. That rarity makes it noteworthy. Moreover, it's plausible that at least some of us might not see such sustained and deep cold again during our lifetimes given how infrequent it has become. That places like Phoenix are on course for their warmest winter on record does not minimize the cold that has just occurred elsewhere. That it has occurred in a warmer and warming world makes it all the more remarkable. -
February 2026 OBS & Discussion
donsutherland1 replied to Stormlover74's topic in New York City Metro
The snow was blinding at times.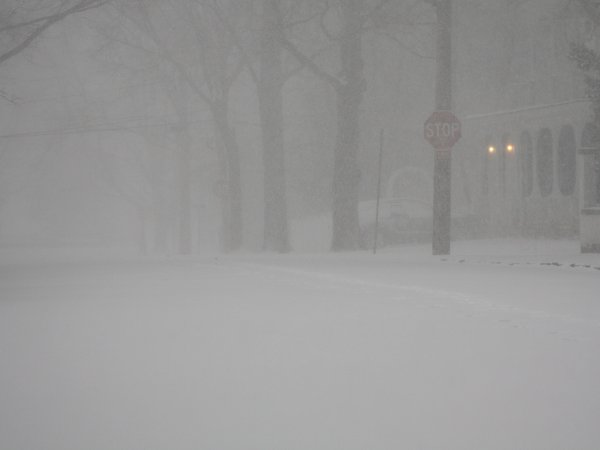
-
February 2026 OBS & Discussion
donsutherland1 replied to Stormlover74's topic in New York City Metro
The persistent and often severely cold pattern is poised to break. However, exceptional warmth appears unlikely through at least mid-February, even as milder readings return. After mid-month, highs could begin to reach the lower 40s. Tomorrow will see the temperature reach or exceed freezing. Wednesday will be even milder with the temperature topping out in the upper 30s. A cold front will likely cross the region, possibly touching off a few snow flurries or showers. It will turn somewhat cooler into the weekend. The ENSO Region 1+2 anomaly was +0.3°C and the Region 3.4 anomaly was -0.5°C for the week centered around February 4. For the past six weeks, the ENSO Region 1+2 anomaly has averaged -0.25°C and the ENSO Region 3.4 anomaly has averaged -0.52°C. La Niña conditions will likely continue into at least late winter. The SOI was +4.66 today. The preliminary Arctic Oscillation (AO) was -2.895 today. Based on sensitivity analysis applied to the latest guidance, there is an implied near 90% probability that New York City will have a cooler than normal February (1991-2020 normal). February will likely finish with a mean temperature near 31.2° (4.7° below normal). Supplemental Information: The projected mean would be 4.1° below the 1981-2010 normal monthly value. Overall, Winter 2025-2026 is on track for a seasonal mean temperature of 31.9°. That would be the lowest winter mean temperature since Winter 2014-2015 when the mean temperature was 31.7°. Winter 2025-2026 would only become the fourth winter of the 21st century with a mean temperature of 32.0° or below. -
February 2026 OBS & Discussion
donsutherland1 replied to Stormlover74's topic in New York City Metro
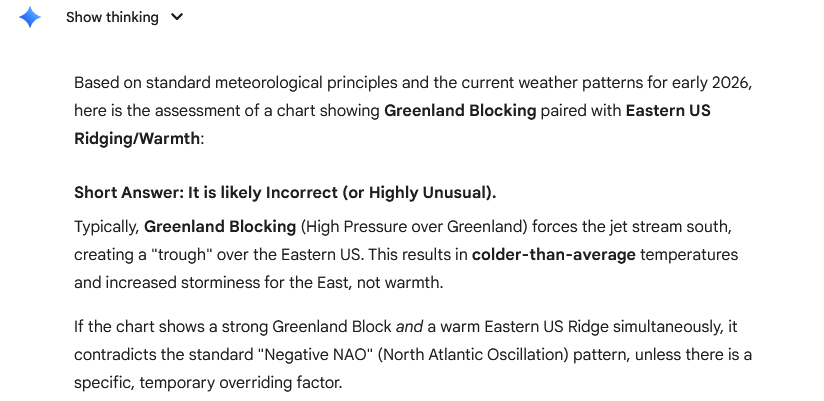
That's incorrect. The opposite is true. Winter/early spring is cold; it flips later spring/summer. Here are 500 mb anomalies and temperature anomalies for March Greenland blocks: Here are mean temperatures for NYC (1980-2025): March 1-15: NAO -0.50 or below: 39.3°; NAO +0.50 or above: 41.5° March 16-31: NAO -0.50 or below: 43.3°; NAO +0.50 or above: 46.4° Finally, what does AI say about the posted map under discussion? Here's ChatGPT 5.2's response: Gemini's Output: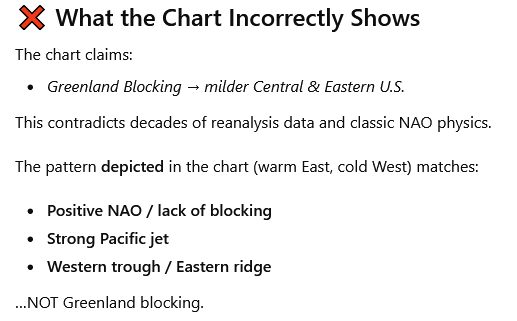
-
February 2026 OBS & Discussion
donsutherland1 replied to Stormlover74's topic in New York City Metro
That's quite worrisome, especially when it comes to science. Science is truly at the cutting edge of knowledge creation and, if expertise is watered down, it will have an adverse impact on that outcome. -
February 2026 OBS & Discussion
donsutherland1 replied to Stormlover74's topic in New York City Metro
I'm interested in his track record. Anyone can put up a .WX on social media, create sites, or apps and "forecast." And, models and ensembles have virtually no skill at the lead time involved. Finally, there's no verification of past claims. The reason I ask, is because he is wrong when it comes to early spring (the transitional period) and Greenland blocking. For both the first and second halves of March (late winter/eaely spring transition), Greenland blocking results in cooler conditions in the East. Getting the basics wrong is a red flag. I am not suggesting right now that March will be cold or warm. I am focusing on the narrower point that Greenland blocking leads to a colder March outcome, not a warmer one. -
February 2026 OBS & Discussion
donsutherland1 replied to Stormlover74's topic in New York City Metro
March 2012 was defined by a lack of Greenland blocking. The NAO was positive on 27 of the 31 days and never strongly negative. -
February 2026 OBS & Discussion
donsutherland1 replied to Stormlover74's topic in New York City Metro
Source: Facebook meteorologist. https://www.facebook.com/MikeCollierWx/posts/a-few-days-ago-i-mentioned-the-potential-for-a-colder-pattern-by-mid-february-ti/1421647855979147/ Does anyone know his track record? -
February 2026 OBS & Discussion
donsutherland1 replied to Stormlover74's topic in New York City Metro
And here are the most common high-low combinations for New York City: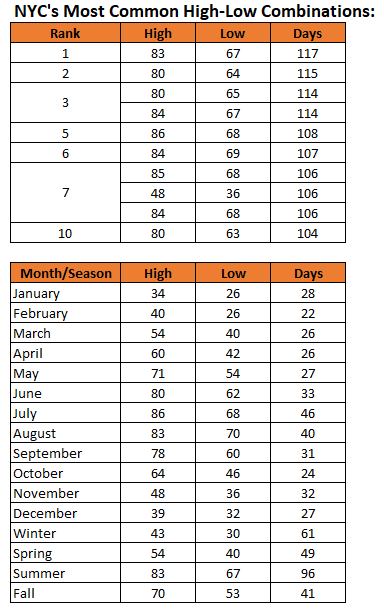
-
February 2026 OBS & Discussion
donsutherland1 replied to Stormlover74's topic in New York City Metro
Negativity bias is real. People often assume that their "crystal ball" is clearer at longer lead times when adverse outcomes (e.g., lack of snowfall) are involved. Psychologically, people tend to give greater weight to negative outcomes than positive ones. Those threats appear clearer or more certain, because they generate stronger cognitive or emotional reaction. In reality, the extended range forecasts showing a bleak outcome for snowfall are no more or less likely to verify than those that show a lot of snowfall at similar ranges. Guidance beyond 10 days has a sharp falloff in skill. Having said that, the frequency of days with significant (6" or above) snowfall declines in New York City, especially after mid-March. Moreover, just over one-in-four years (26.8%) saw no measurable snowfall during February 15-28 but only 3.1% of years (1878, 1925, 2002, 2012, 2020) saw no measurable snowfall from February 15 to the end of snow season. At the current lead time, it is premature to assume that Winter 2025-2026 has seen its last measurable snowfall.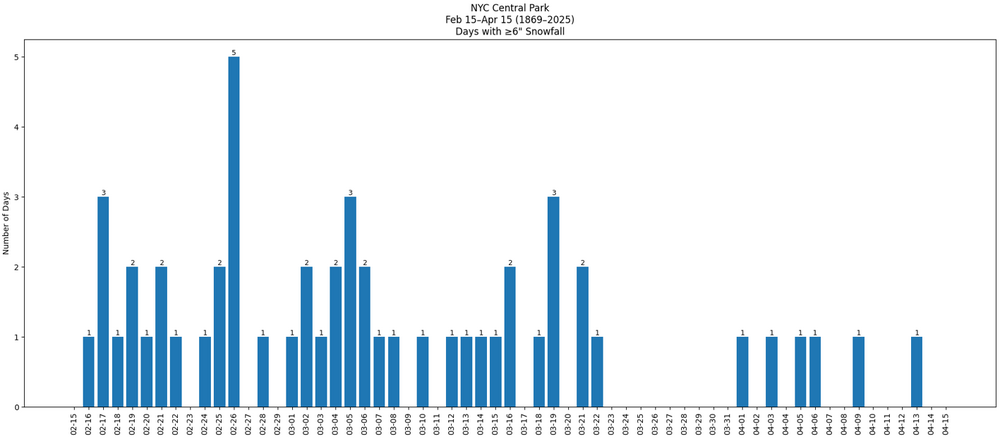
-
February 2026 OBS & Discussion
donsutherland1 replied to Stormlover74's topic in New York City Metro
With a 16-day mean temperature of 19.7°, New York City experienced its coldest 16-day period since January 10-25, 1982 and its first sub-20° 16-day period since January 11-26, 1982.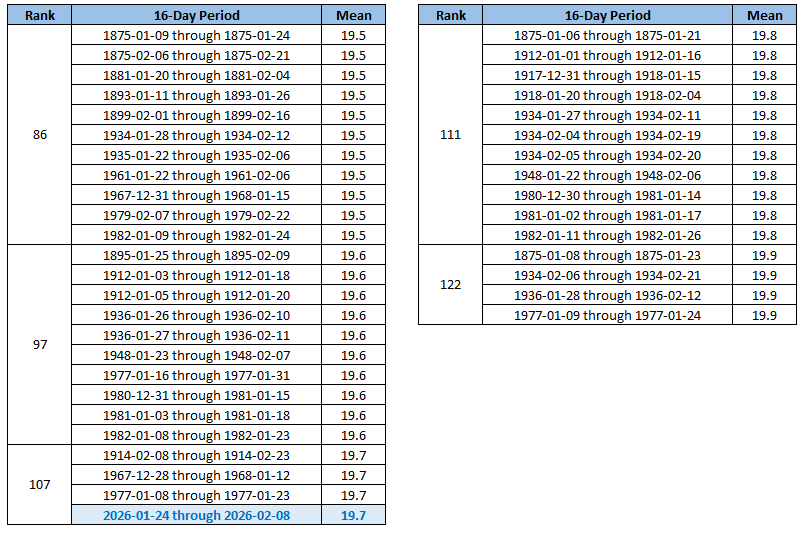
-
February 2026 OBS & Discussion
donsutherland1 replied to Stormlover74's topic in New York City Metro
The coldest day of Winter 2025-2026 is now going into the books. Tomorrow will start very cold, but the afternoon will be less harsh as readings climb into the middle and upper 20s. The temperature will reach or exceed freezing on Tuesday. The persistent and often severely cold pattern is poised to break near February 10th. However, exceptional warmth appears unlikely through at least mid-February, even as milder readings return. After mid-month, highs could begin to reach the lower 40s. The ENSO Region 1+2 anomaly was +0.1°C and the Region 3.4 anomaly was -0.4°C for the week centered around January 28. For the past six weeks, the ENSO Region 1+2 anomaly has averaged -0.38°C and the ENSO Region 3.4 anomaly has averaged -0.57°C. La Niña conditions will likely continue into at least late winter. The SOI was +0.05 today. The preliminary Arctic Oscillation (AO) was -3.397 today. Based on sensitivity analysis applied to the latest guidance, there is an implied near 90% probability that New York City will have a cooler than normal February (1991-2020 normal). February will likely finish with a mean temperature near 31.0° (4.9° below normal). Supplemental Information: The projected mean would be 4.3° below the 1981-2010 normal monthly value. Overall, Winter 2025-2026 is on track for a seasonal mean temperature of 31.8°. That would be the lowest winter mean temperature since Winter 2014-2015 when the mean temperature was 31.7°. Winter 2025-2026 would only become the fourth winter of the 21st century with a mean temperature of 32.0° or below. -
February 2026 OBS & Discussion
donsutherland1 replied to Stormlover74's topic in New York City Metro
Near there. Hudson River Greenway near 158th Street. -
2025-2026 ENSO
donsutherland1 replied to 40/70 Benchmark's topic in Weather Forecasting and Discussion
January 24-February 8, 2026 is on track to record a 16-day mean temperature below 20° in Central Park. The last time that happened was outside the life span of many AmWx members: January 11-26, 1982.