donsutherland1
-
Posts
24,192 -
Joined
Content Type
Profiles
Blogs
Forums
American Weather
Media Demo
Store
Gallery
Everything posted by donsutherland1
-
Blizzard of 2026 Storm Thread/OBS
donsutherland1 replied to Mikeymac5306's topic in Philadelphia Region
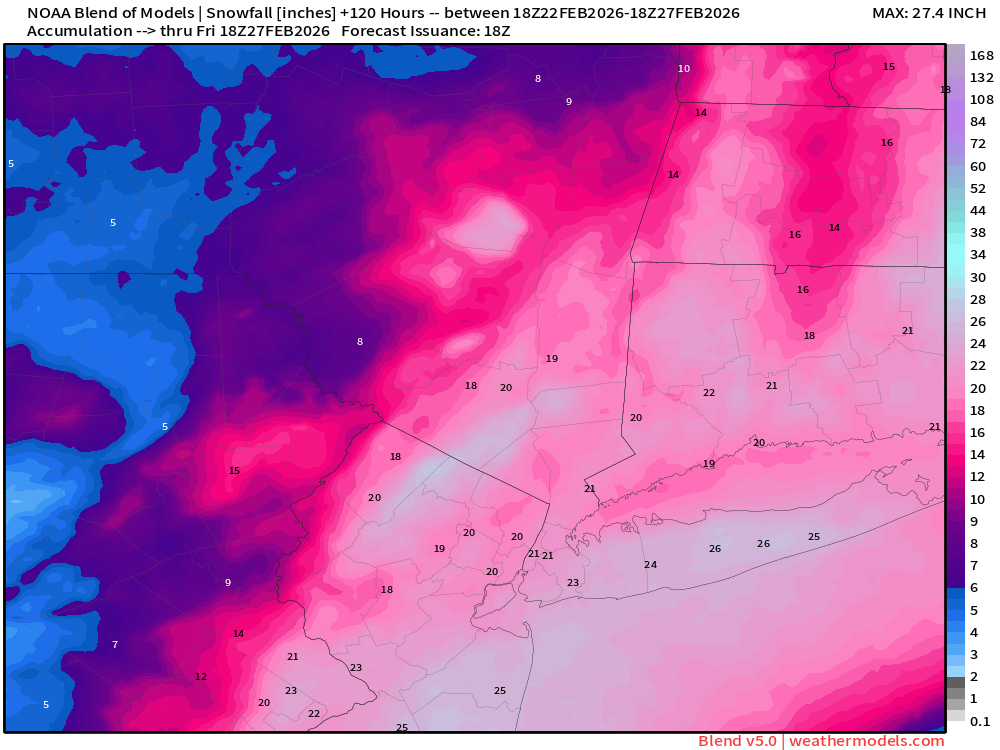
The Pennsylvania map for the NBM:
-
I will post the PA map. Unfortunately, there is no map that zooms in on SE PA, which is surprising given that Philadelphia is a major city.
-
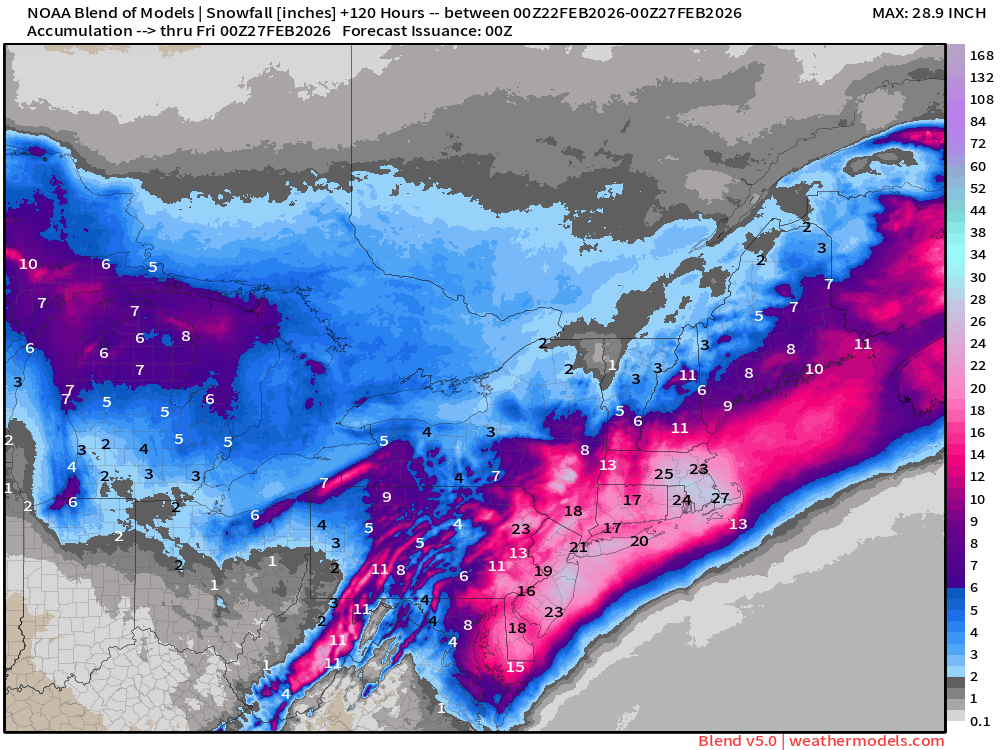
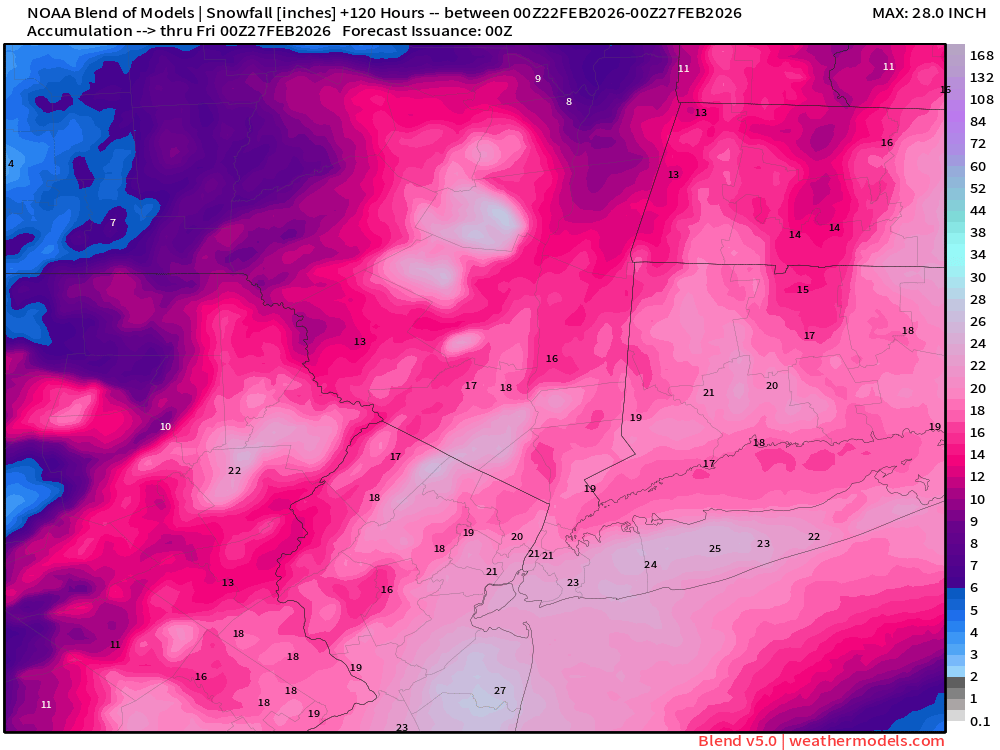
18z NBM (v.5.0): Note: V.4.3, which will be replaced this spring, shows 25” for Central Park. The newer version with the more realistic snow-liquid ratios has been very steady.
-
We'll know tomorrow.
-
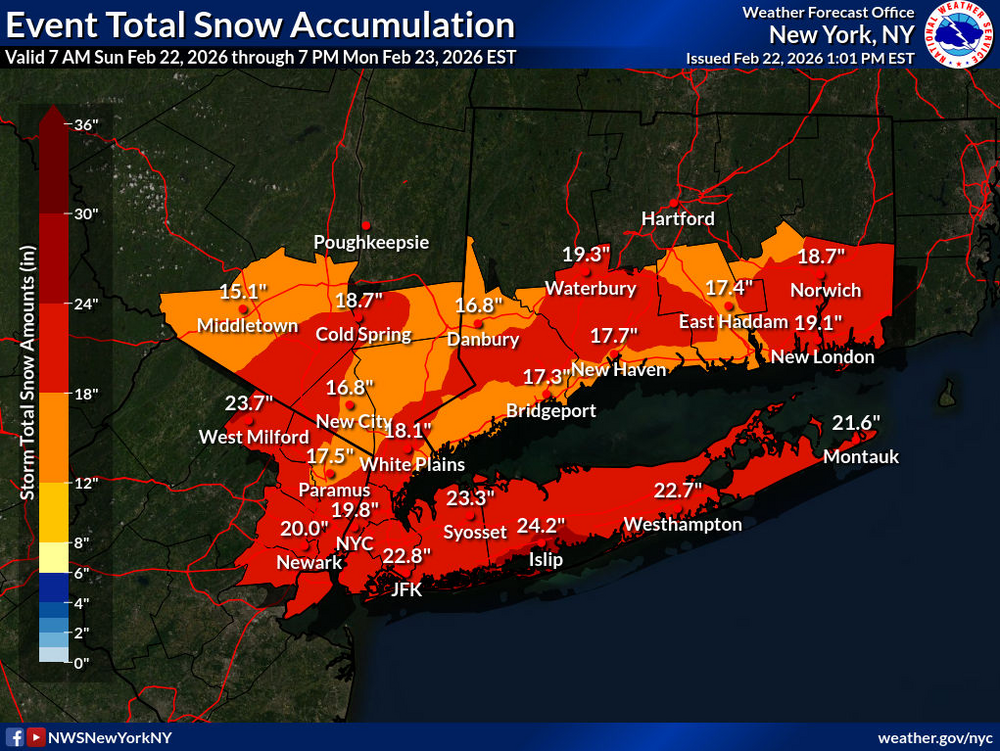
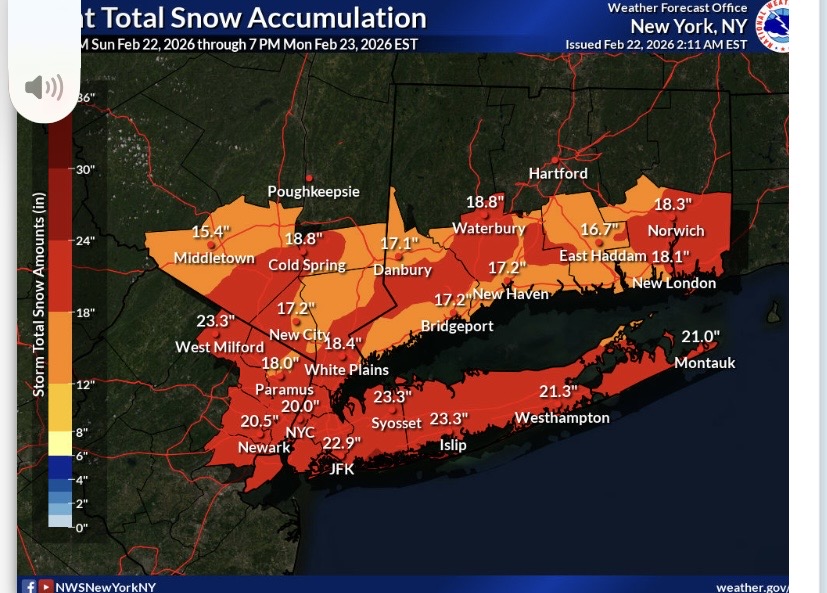
Updated forecast from Upton:
-
We'll know tomorrow how this fared. But something to keep in mind: A new study led by scientists from the University of Chicago, in collaboration with New York University and the University of California Santa Cruz, is testing the limits of AI-powered weather prediction. In research published May 21 in Proceedings of the National Academy of Sciences, they found that neural networks cannot forecast weather events beyond the scope of existing training data—which might leave out events like 200-year floods, unprecedented heat waves or massive hurricanes. https://news.uchicago.edu/story/ai-good-weather-forecasting-can-it-predict-freak-weather-events
-
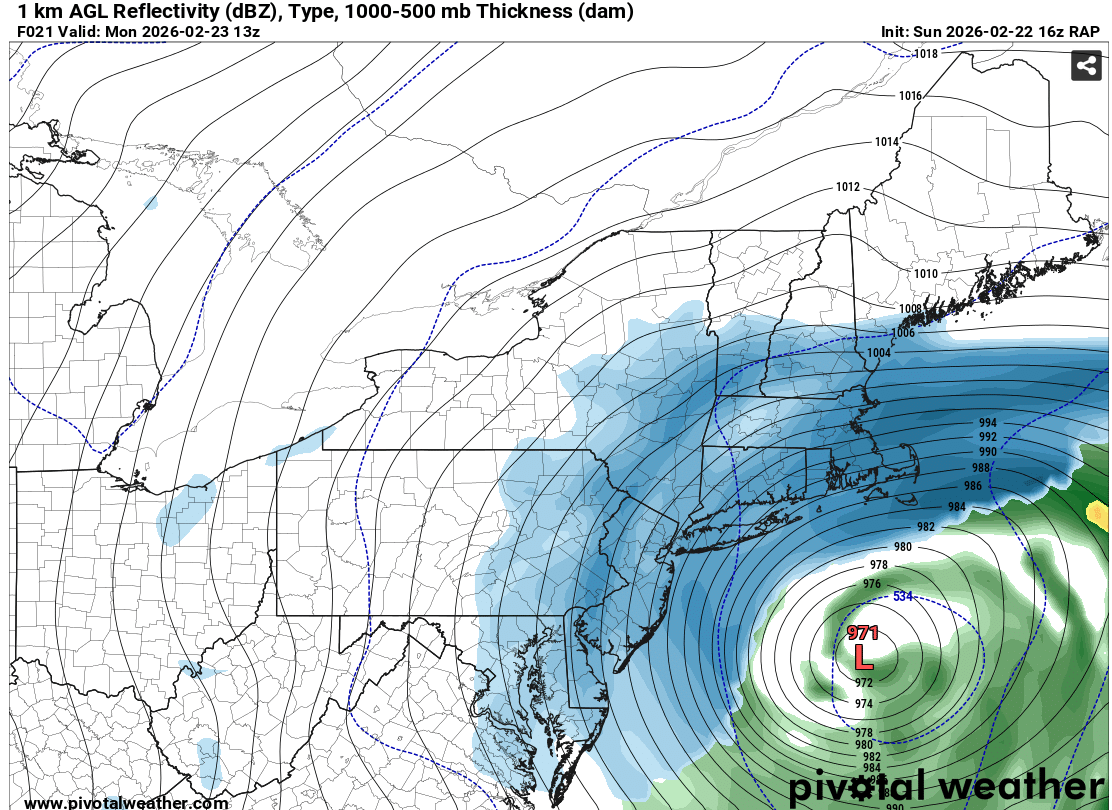
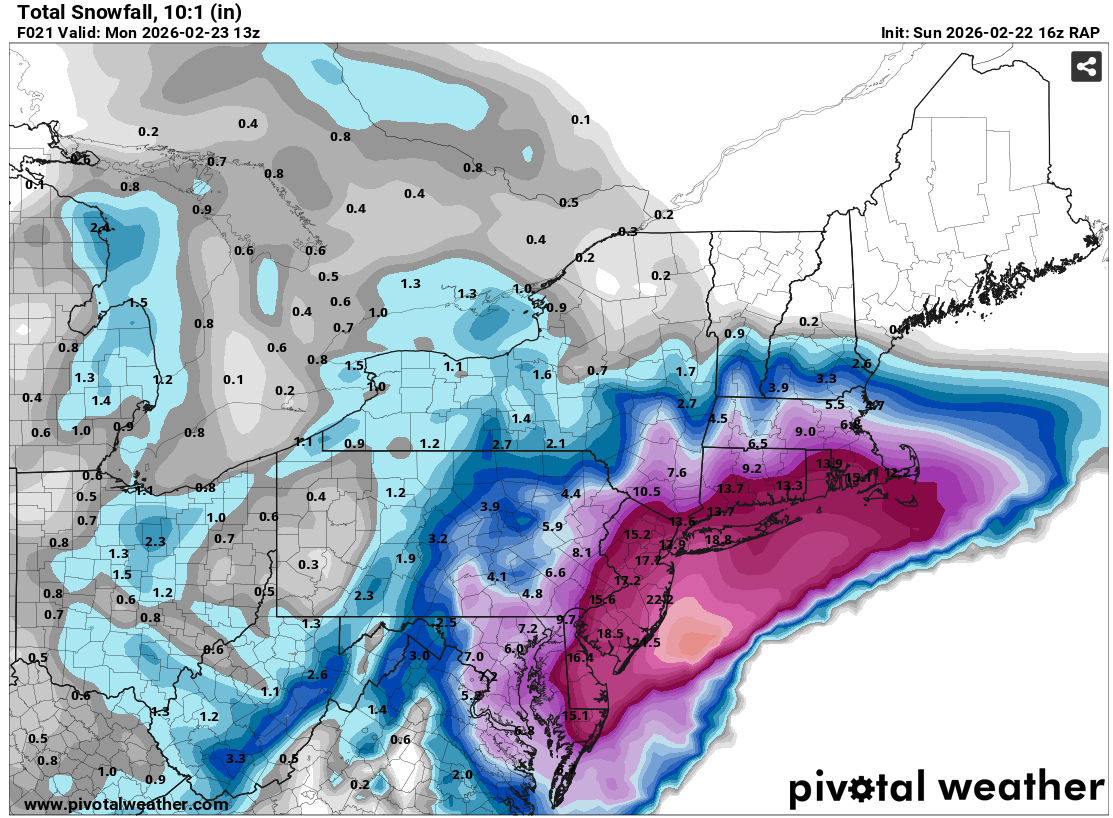
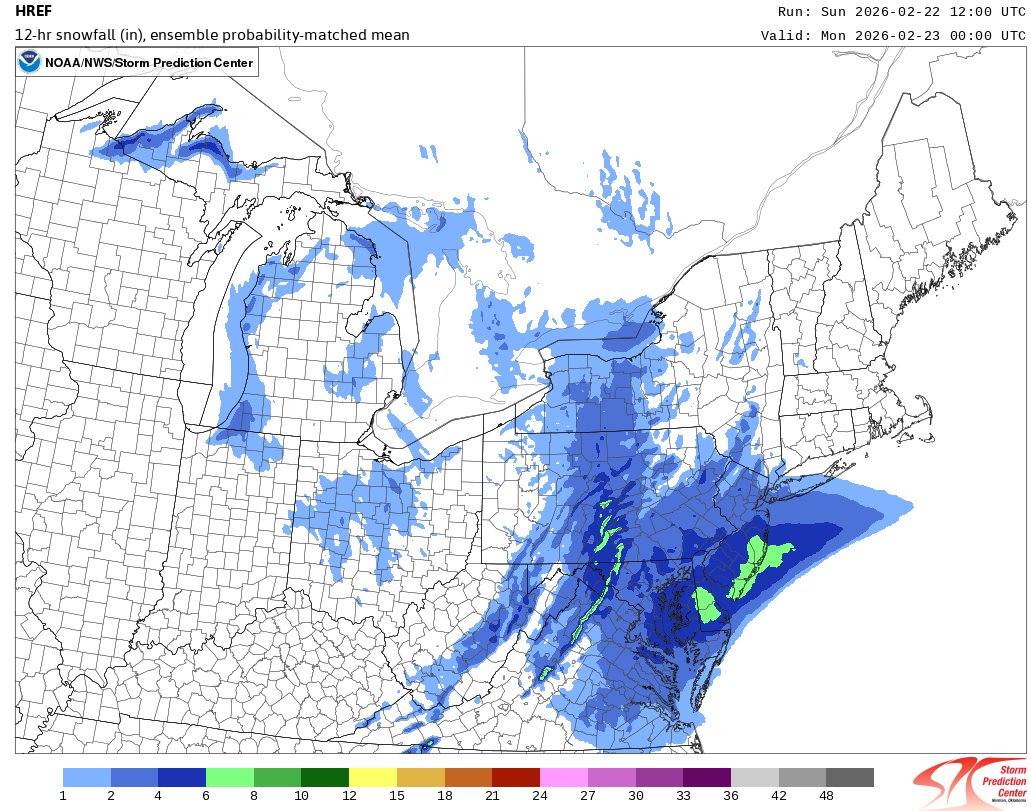
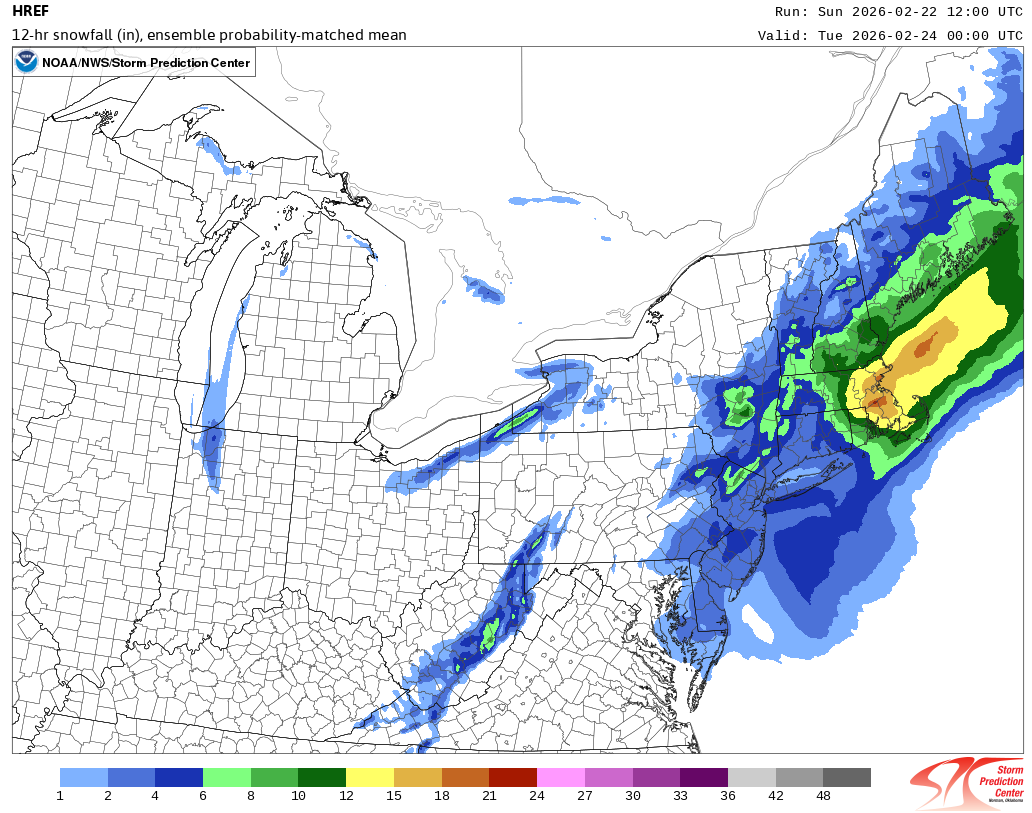
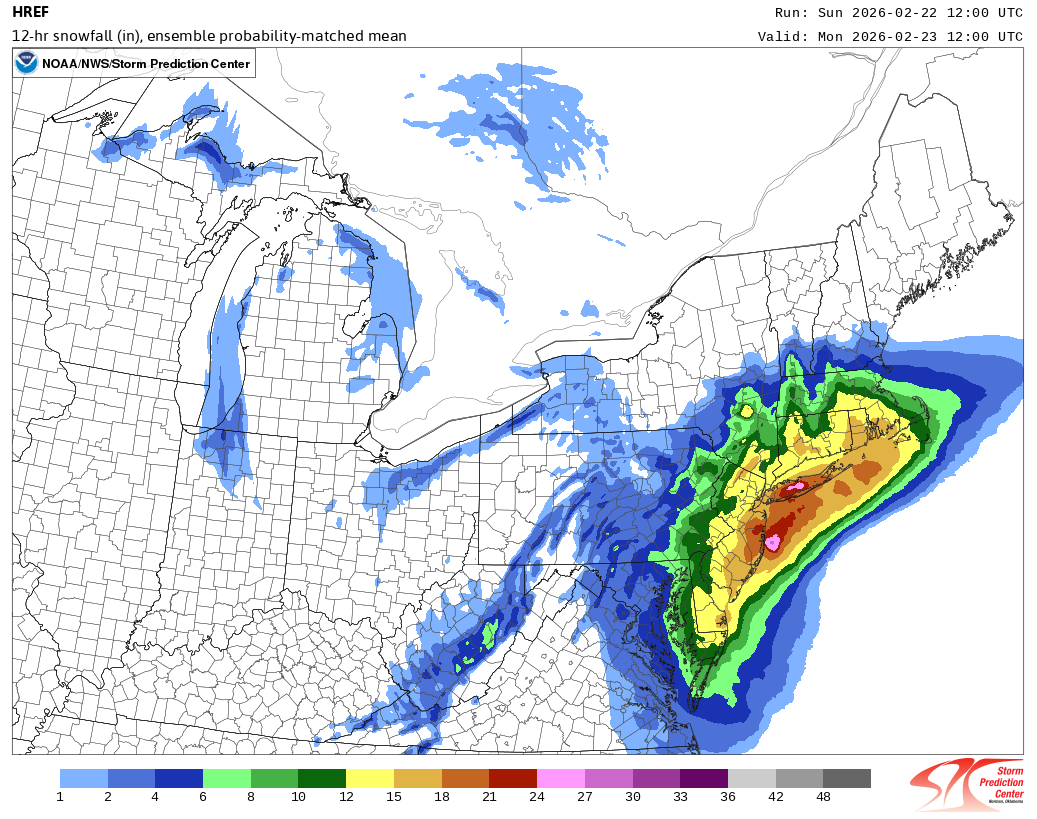
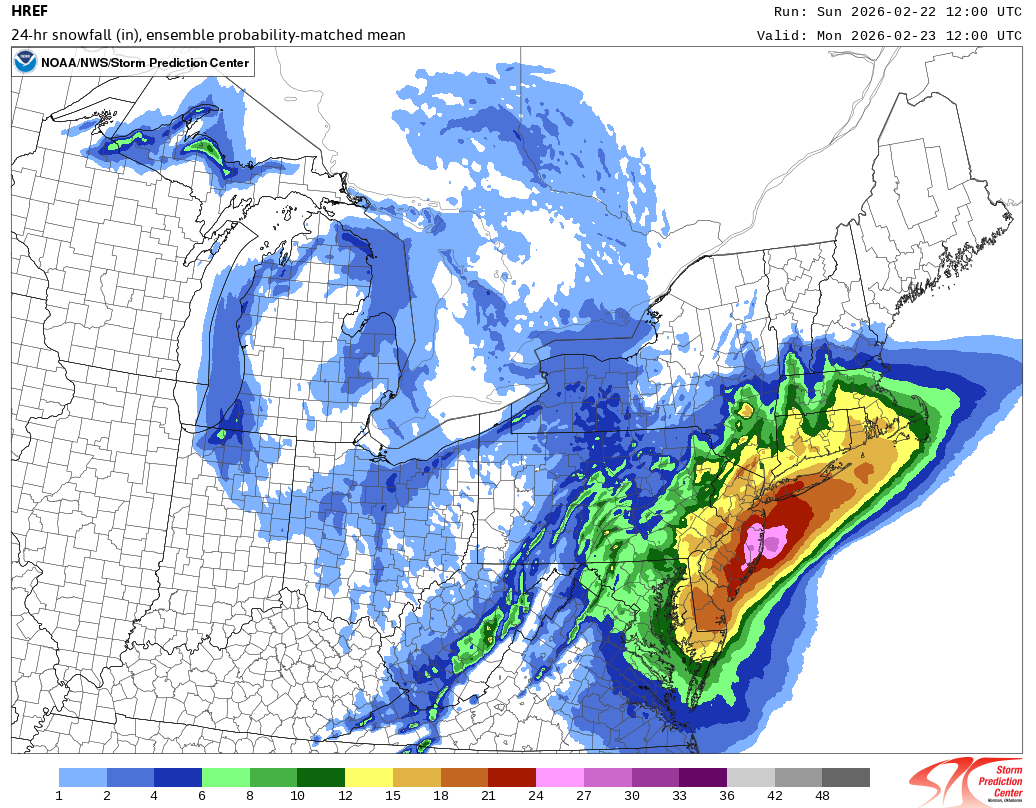
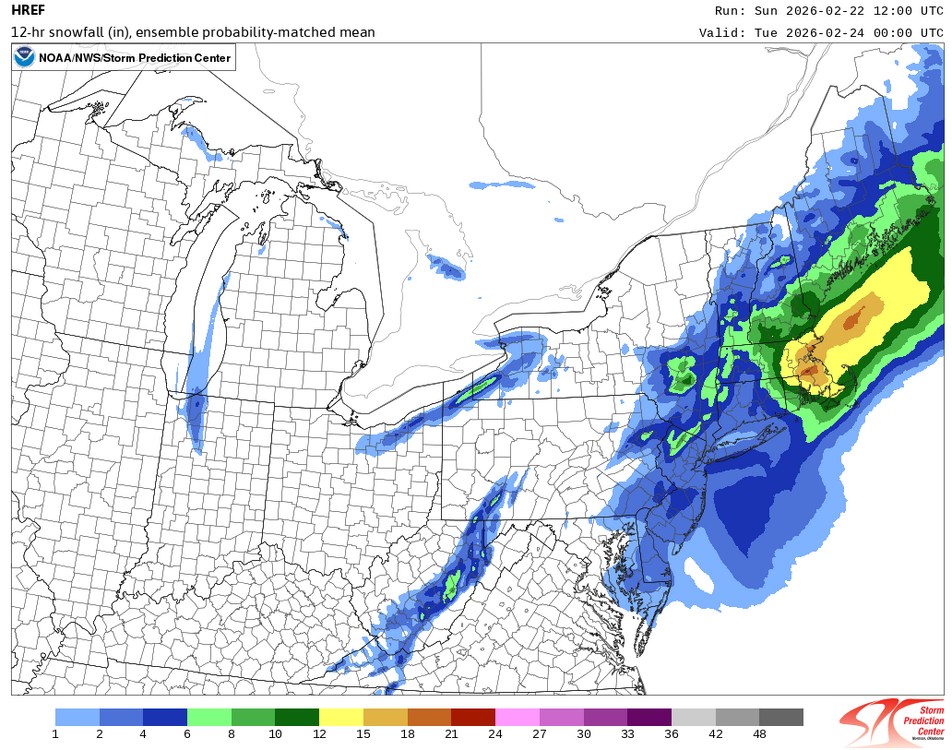
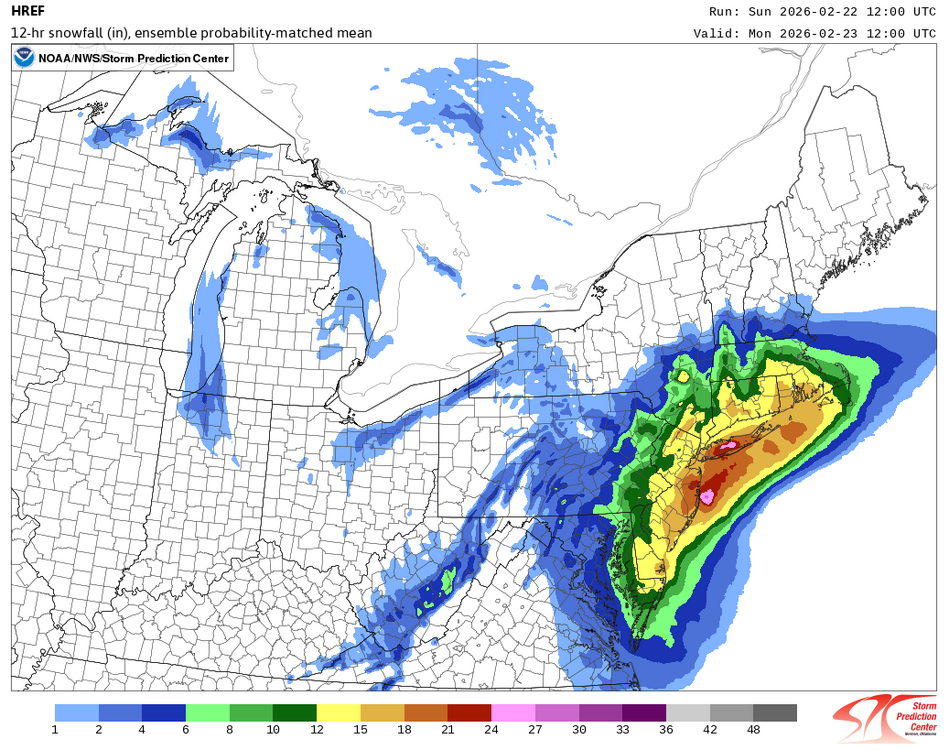
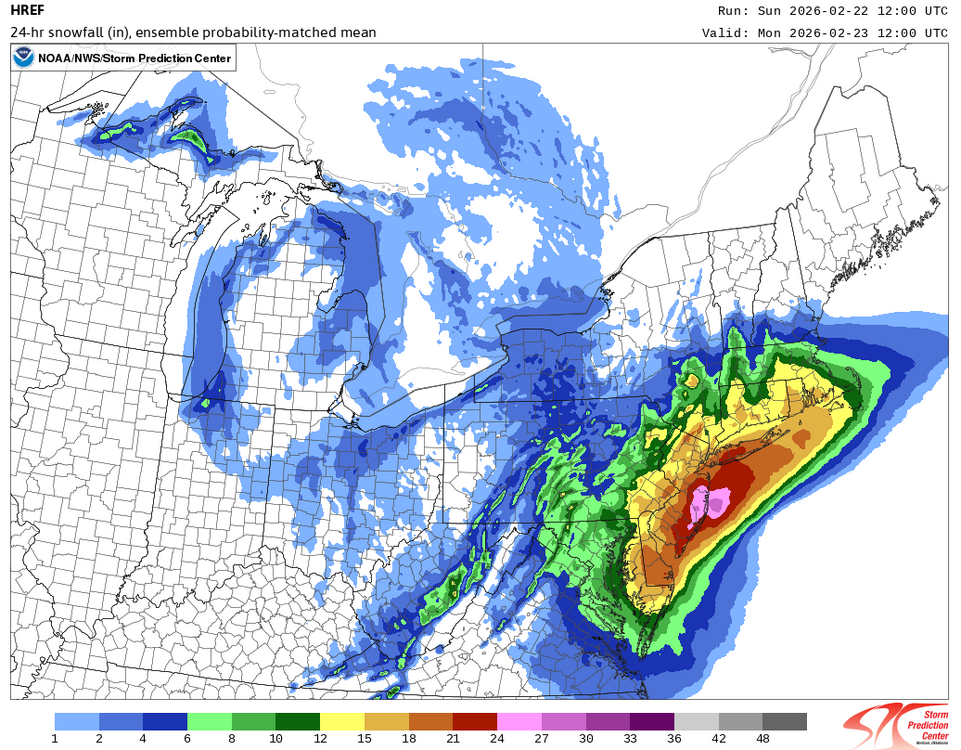
While we wait for the Board psychiatrist to arrive to address the gloom, the 12z UKMET held serve. Moreover, the 16z RAP at 21 hours showed: The 12 hour intervals for the 12z HREF were: 2/22 12z-2/23 0z: 2/23 0z-12z: 2/23 12z-2/24 0z:


-
I'm still thinking 18"-24" with some locally higher amounts.
-
Once it drops another degree, JFK should flip. The above freezing layer from the surface extends to around 975 mb. That's a bit too thick.
-
This will have to be watched. I suspect things will level off and we'll wind up with around 1.50" QPF in much of the area. I still think 14"-20" is plausible for BDR at this time, unless the shift continues through the 18z cycle. Let's see where things are at 18z. If the storm develops explosively, one will see higher than 12:1 ratios even with the wind, especially where the banding sets up. The mesoscale models will provide insight into banding, frontogenic forcing, etc.
-
12z HREF through tomorrow 12z: Even if on deducts one category, NYC has 12"-15" of snow by 12z tomorrow on the HREF.
-
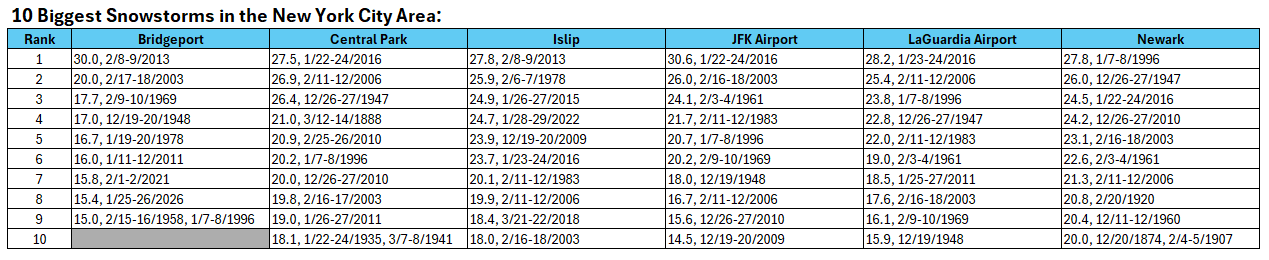
IMO, the major blizzard remains on track. My thinking of 16"-22" in the City and nearby areas and 18"-24" in parts of Long Island and central NJ with locally higher amounts is unchanged. That the NAM has come to Earth doesn't change things. Were the storm not expect to develop as explosively as expected and were it not to approach or surpass 970 mb, I'd be thinking 12"-18" based on a preponderance of the guidance. However, explosively deepening and super intense storms have very efficient and powerful dynamics that maximize snowfall. Thus, it makes sense to add about a third to the figures one would normally expect. One saw such a case during February 11-12, 2006. The blizzard's dynamics outran the models and the forecasts. What had been expected to be about a foot of snow in NYC wound up being 26.9". Forecast amounts were increased several times when the blizzard was underway. So, at least for now, I'm quite comfortable with my amounts listed above.
-
For reference:
-
The ground is coated from the light snow in Larchmont.
-
Seems reasonable.
-
-
Here’s the 0z NBM (v.5.0):
-
Yes. The latest was the Blizzard of 1983 (2/11-12/1983).
-
September 1963.
-
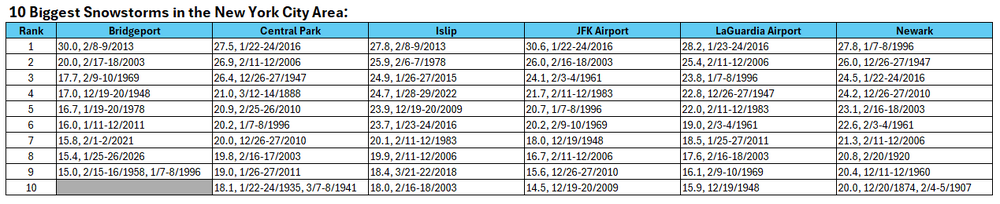
For reference, Islip's all-time record is 27.8" from February 8-9, 2013.
-
Blizzard of 2026 Storm Thread/OBS
donsutherland1 replied to Mikeymac5306's topic in Philadelphia Region
Here’s the 23z NBM v.5.0: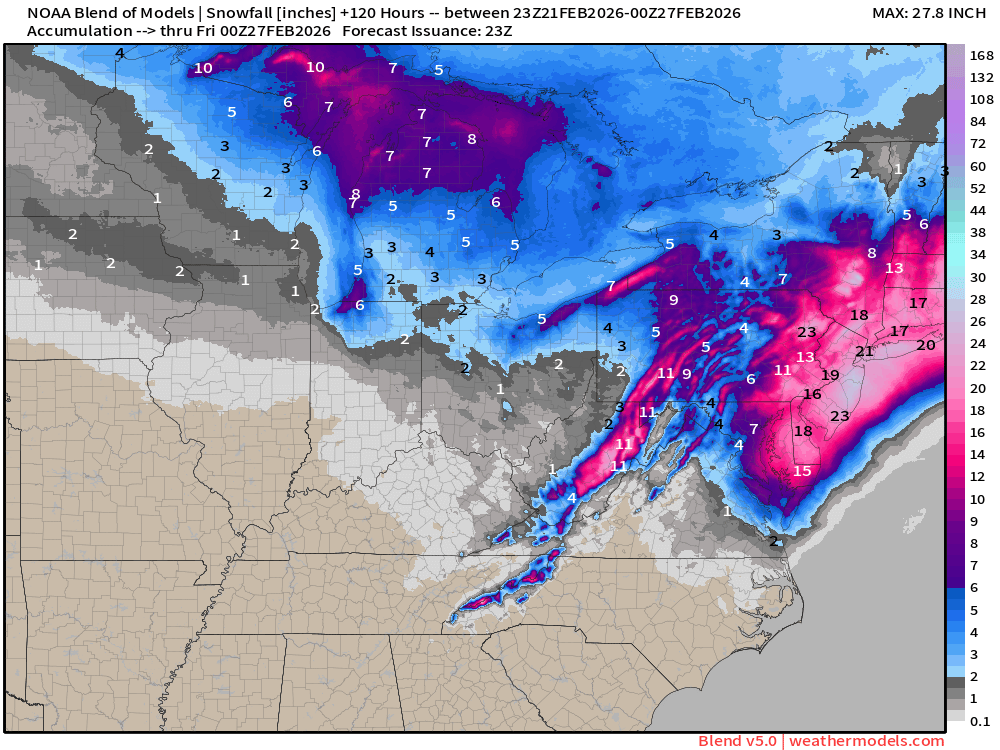
-
Blizzard of 2026 Storm Thread/OBS
donsutherland1 replied to Mikeymac5306's topic in Philadelphia Region
That’s the current version (4.3), which tends to run high. The experimental version (5.0), which will become operational this spring, is lower. -
NYC 17.8" LGA 18.5" ISP 23.0" JFK 20.0" EWR 18.0"
-
February 2026 OBS & Discussion
donsutherland1 replied to Stormlover74's topic in New York City Metro
Following a day when springlike warmth brought about a torrent of melting and hint that the worst of winter is now in the past, a major blizzard is poised to engulf the region in a blinding, swirling wall of white. Last Tuesday, the AIFS signaled a possible major storm. Afterward, when all the other guidance retreated, the GFS kept the torch burning. Now, the region is set to experience its most severe blizzard in perhaps a decade. A rapidly developing storm will bring heavy snow and high winds to the region later tomorrow into Monday. Any early snow or mixed precipitation during the morning will be light and inconsequential. At present, a 16"-22" snowfall appears likely in New York City and its nearby suburbs. Somewhat lesser amounts are likely north and west of New York City. A 18"-24" snowfall is likely across central New Jersey and part of Long Island. Blizzard conditions are likely at the height of the storm late Sunday night into Monday morning across much of the region. Winds will likely gust near 60 mph creating extremely low visibilities and large drifts. Final estimates: Allentown: 8"-12" Atlantic City: 8"-16" Baltimore: 4"-8" Binghamton: 2"-4" Boston: 18"-24" Bridgeport: 14"-20" Harrisburg: 4"-8" Hartford: 8"-12" Islip: 18"-24" New York City: 16"-22" Newark: 16"-22" Philadelphia: 12"-18" Providence: 18"-24" Scranton: 3"-6" Washington, DC: 3"-6" Wilmington: 12"-18" As a result, Winter 2025-2026 will become just the 10th winter with two 10" or above snowstorms in New York City. The others are 1895-1996, 1925-1926, 1960-1961, 1977-1978, 1995-1996, 2003-2004, 2009-2010 (3 such storms), 2010-2011, and 2013-2014. Even more impressive, Winter 2025-2026 will be on track to join Winters 1960-1961 and 1977-1978 as the only winters with two or more 10" snowstorms, a seasonal mean temperature of 32° or below and seasonal snowfall of 30.0" or above. The ENSO Region 1+2 anomaly was +0.7°C and the Region 3.4 anomaly was -0.2°C for the week centered around February 11. For the past six weeks, the ENSO Region 1+2 anomaly has averaged -0.03°C and the ENSO Region 3.4 anomaly has averaged -0.47°C. Neutral ENSO conditions are now developing. Neutral ENSO conditions will develop during the close of winter. The SOI was +3.70 today. The preliminary Arctic Oscillation (AO) was -0.601 today. Based on sensitivity analysis applied to the latest guidance, there is an implied near 100% probability that New York City will have a cooler than normal February (1991-2020 normal). February will likely finish with a mean temperature near 31.7° (4.2° below normal). Supplemental Information: The projected mean would be 3.6 below the 1981-2010 normal monthly value. Overall, Winter 2025-2026 is on track for a seasonal mean temperature of 32.0°. If a 32.0° or below seasonal mean temperature occurs, that would be the lowest winter mean temperature since Winter 2014-2015 when the mean temperature was 31.7°. Winter 2025-2026 would only become the fourth winter of the 21st century with a mean temperature of 32.0° or below. -
A long and detailed AFD: 193 FXUS61 KOKX 212051 AFDOKX Area Forecast Discussion National Weather Service New York NY 351 PM EST Sat Feb 21 2026 .WHAT HAS CHANGED... Blizzard warnings are now in effect for the entire area except Orange and Putnam counties where a winter storm warning remains in effect. The warnings start at 1pm Sunday Snowfall amounts have been increased slightly && .KEY MESSAGES... 1) An intense coastal storm will bring heavy snowfall and strong winds from Sunday afternoon into Monday afternoon. Blizzard conditions are expected across much of the area with near-blizzard conditions across Orange and Putnam counties Sunday night into the first half of Monday. 2) Potential for widespread moderate to locally major coastal flooding and dune erosion/overwashes Sunday night. Additional coastal flooding is possible on Monday. 3) Low pressure and a cold front will bring another chance for precipitation during mid next week. Temperatures rising into the 40s by the end of the week will allow for snow melt. && .DISCUSSION... .KEY MESSAGE 1... Major winter storm impacts the Tri-State Sunday into Monday. Model guidance has continued to converge on the evolution, track, and intensity of the system. Low pressure will quickly develop off along the North Carolina coast Sunday morning and rapidly intensify Sunday evening into Monday morning as it slowly lifts north-north east towards the 40N/70W bookmark. There have been some minor fluctuation within the guidance on the exact location of the low and whether it passes just inside, over, or just east of the benchmark. However, little change to the overall impacts would occur in these scenarios. Ensemble solutions that were passing much further offshore with a graze scenario are continuing to look less and less likely. Model guidance shows pressures rapidly falling Sunday night with the low deepening around 970 mb as it nears the benchmark. Some guidance even has it a few mb lower. The low occludes and gets captured by the upper low with deepening ending and the low beginning to level off as it lifts NE to off the Cape Monday night. Light snow, or a mix of rain and snow, may develop Sunday morning, but steadier snow should begin overspreading the area from south to north in the afternoon and evening. Surface temperatures initially will be above freezing so little to no impact from any snow expected through early afternoon. Once the precip intensity increases mid to late Sunday afternoon, accumulations should begin more efficiently on colder surfaces, and then roadways Sunday evening as temperatures drop below freezing. Since there will be little to no impact in the morning, the start time of the Blizzard Warnings and Winter Storm Warnings have been moved to 1pm Sunday. This may still be a bit early, but overall conditions will deteriorate as the evening approaches. The explosive development of the low pressure will aid in the expansion of snow well north and west of the low center. Bands of moderate to heavy snow will rotate from the southeast to the northwest during the evening into the overnight as the cyclone rapidly deepens. These bands of moderate to heavy snow will continue into Monday morning withing the comma head of the storm (typically to the N and W of the center of low pressure). These lingering bands will diminish as the low pulls away Monday afternoon. The system is now getting within the range of the high res guidance and we are beginning to see notable trends of an uptick in QPF. These changes may move around a bit in the next 24 hours, but overall the trend supports increasing snowfall totals from the previous forecast. Total snowfall ranges from 12-16 inches inland and S CT to around 15-20 inches closer to the coast. There is a reasonable worse case for around 2 ft+ of snow. The chance for these amounts may be closer to the coast/Long Island, but cannot entirely rule this out even inland if heavier bands shift further NW away from the low center. There are still several ECMWF-EPS ensemble members that are very likely skewing the overall distribution of the probabilistic snow. These members have started trending up with the latest 12z EPS, lending more confidence that the low end amounts are unlikely to be correct. Intense dynamics are expected with this storm including strong difluence and intense frontogenesis all lead to heavy banding potential and heavy snowfall rates Sunday night into Monday morning. The cold conveyor belt late Sunday night and Monday morning appears to sit right on top of the area which will help the bands remain in place for a while and generally snow themselves out as the storm starts departing. Snowfall rates increase Sunday evening, becoming 1-2" per hour with locally up to 3 inches per hour at times. Several major winter storms in recent history have produced large heavy snow bands in the deformation zone with rates locally as high as 4" per hour. This cannot be ruled out given the type of storm being depicted by the models. There is also a chance of a few lightning strikes in the heavier banding Sunday night into Monday morning. Have not included thunder in the forecast yet, but cannot ruled this potential out. Winds will also be quite strong with this storm. Model soundings show boundary layer winds along the coast 40-60kt with decent mixing. Coastal locations can expect to see gusts up 45 to 55 mph, possibly even stronger across far eastern LI and southeast CT up to 60 or 65 mph. Inland areas will be weaker, but could still see frequent gusts 35 to 45 mph. The highest winds will occur Sunday night into the first half of Monday. The blizzard warnings were expanded to higher confidence in considerable falling snow, strong winds, and poor visibility well away from the coast. Near-blizzard conditions are possible outside the blizzard warning. The snowfall character will start wet and then gradually become drier as the event matures Sunday night into Monday. Ratios likely average around 10:1 early on, possibly lower Sunday afternoon, before averaging around 11-13:1 overnight Sunday into Monday morning. .KEY MESSAGE 2... Strengthening E-NE winds Sunday into Sunday night could produce a surge of 2.5-3.5 ft, producing widespread moderate to locally major coastal flooding along the back bays of western Suffolk and srn Nassau, Peconic Bay, and western Long Island Sound, and widespread minor to locally moderate flooding in NY Harbor and Jamaica Bay, the lower Hudson River, and ern Long Island Sound. The main high tide cycle of concern is Sunday night. Areas of dune erosion are likely, with localized overwashes possible along the ocean beachfront Sunday night into Monday morning. Additional coastal flooding will likely linger into the Monday afternoon high tide cycle, with a strong northerly flow limiting impacts somewhat to minor/locally moderate categories. .KEY MESSAGE 3... There may be a few frontal systems that move across in a mostly zonal flow mid to late next week. Precip chances have come up a bit late in the week with mostly rain expected at this point. Temperatures Tuesday range from the upper 20s to low 30s. Temperatures then trend closer to normal the rest of the week. This will allow for snowmelt each day and with mostly sub- freezing temperatures at night into early morning, subsequent refreeze of snow melt. && .AVIATION /20Z SATURDAY THROUGH THURSDAY/... **HIGH IMPACT WINTER STORM SUNDAY INTO MONDAY** Weak high pressure noses in from the north tonight. A strong nor`easter then impacts the area Sunday into Monday. Ceilings lower to MVFR tonight into early Sunday. Cigs then lower to IFR through the day on Sunday. potential for light rain/snow showers to move in from the north tonight, but confidence remains low at this point and will likely not be impactful. Have added PROB30 to KGON for now. Any snow or rain/snow Sunday morning will be light. Snowfall rates don`t pick up until Sunday afternoon. Started LIFR conditions at 21z for NYC terminals. Winds veer NE tonight at 5-10 kt ahead of a nor`easter. Winds increase to 15 kt by 18Z, then around 20 kt by 21z. ...NY Metro (KEWR/KLGA/KJFK/KTEB) TAF Uncertainty... No unscheduled amendments expected today. .OUTLOOK FOR 12Z SUNDAY THROUGH THURSDAY... Sunday Night: IFR/LIFR with vsby 1/4 at times in +SN. NE Sunday night with G35-40 kt with up to 45 kt at KISP and KGON. Isolated 50-55kt kt gusts possible mainly at KISP and KGON. Likely LLWS with 50-55kt at 2kft. Monday: MVFR or lower in snow. N winds G30-40 kt. Total Forecast Snow Amounts KSWF: 12 inches KHPN and KBDR: 16 inches KGON: 18 inches NYC terminals: 17-19 inches KISP: 20 inches KISP: 20 inches Tuesday: VFR. Wednesday and Thursday: MVFR or lower in snow or rain/snow mix possible. Detailed information, including hourly TAF wind component forecasts, can be found at: https:/www.weather.gov/zny/n90 && .MARINE... Storm watches have been upgraded to storm warnings and now include the Great South Bay. The Gale watch has been upgraded to a gale warning. A major coastal storm will take shape along the Mid Atlantic coast Sunday, rapidly deepening some 25 to 30 mb by early Monday morning. The low drop to around 970mb as it reaches the 40N/70W benchmark Monday morning. Gales and storm force gusts are increasing likely with seas building as high as 20 feet on the ocean and 5 to 10 ft on LI Sound (highest eastern sound). Conditions ramp down to SCA on all waters for Mon night. SCA potential remains Tuesday through Thursday on the ocean, but should remain below on the non-waters will have SCA potential for wind gusts Tuesday and mainly below SCA wind gusts Tuesday night through Thursday. && .CLIMATE... With the potential major snowstorm Sunday into Monday, there is the potential for some snowfall records to be broken. Here are the records for Sunday and Monday for the climate sites: Sun 2/22 Mon 2/23 Central Park, NY: 6.0/2008 4.8/1972 LaGuardia, NY: 6.4/2008 4.1/1972 John F Kennedy, NY: 6.9/2008 6.1/1987 Newark, NJ: 6.8/2008 4.1/1987 Islip, NY: 5.5/2008 6.7/1987 Bridgeport, CT: 7.0/2008 2.6/1987 && .OKX WATCHES/WARNINGS/ADVISORIES... CT...Blizzard Warning from 1 PM Sunday to 6 PM EST Monday for CTZ005>012. Coastal Flood Warning from midnight Sunday night to 5 AM EST Monday for CTZ009-010. Coastal Flood Advisory from 11 PM Sunday to 5 AM EST Monday for CTZ011-012. NY...Blizzard Warning from 1 PM Sunday to 6 PM EST Monday for NYZ069>075-078>081-176>179. Coastal Flood Warning from midnight Sunday night to 5 AM EST Monday for NYZ071-073-078-176-177. Coastal Flood Warning from 10 PM Sunday to 2 AM EST Monday for NYZ072-074-075-178. Winter Storm Warning from 1 PM Sunday to 6 PM EST Monday for NYZ067-068. Coastal Flood Warning from 10 PM Sunday to 6 AM EST Monday for NYZ079-081. Coastal Flood Warning from 10 PM Sunday to 4 AM EST Monday for NYZ080-179. NJ...Blizzard Warning from 1 PM Sunday to 6 PM EST Monday for NJZ002-004-006-103>108. Coastal Flood Warning from 10 PM Sunday to 2 AM EST Monday for NJZ006-104-106-108. MARINE...Storm Warning from 7 PM Sunday to 6 PM EST Monday for ANZ331- 332-340-345-350-353-355. Gale Warning from 7 PM Sunday to 6 PM EST Monday for ANZ335- 338. && $$ DISCUSSION...DS AVIATION...JT MARINE...DS