donsutherland1
-
Posts
24,176 -
Joined
Content Type
Profiles
Blogs
Forums
American Weather
Media Demo
Store
Gallery
Everything posted by donsutherland1
-
Here you go:
-
2025-2026 ENSO
donsutherland1 replied to 40/70 Benchmark's topic in Weather Forecasting and Discussion
Ray, you did an exceptional job. Those of us who read your work appreciate the time you devote and the value your insights and effort bring. -
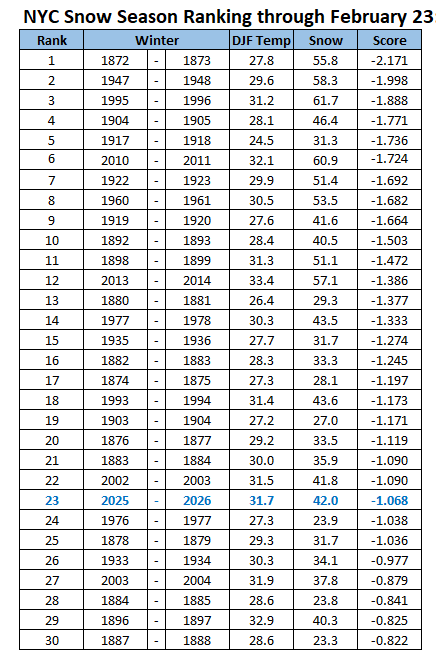
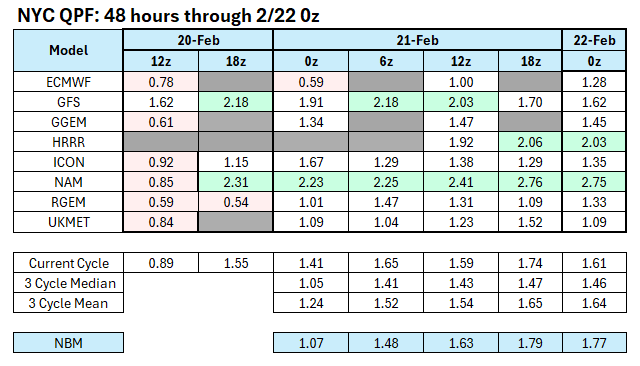
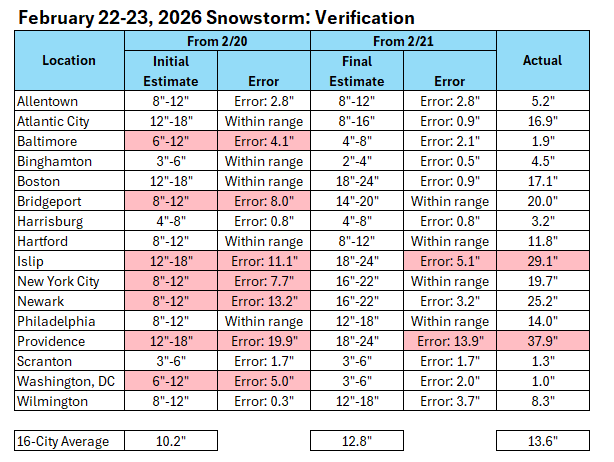
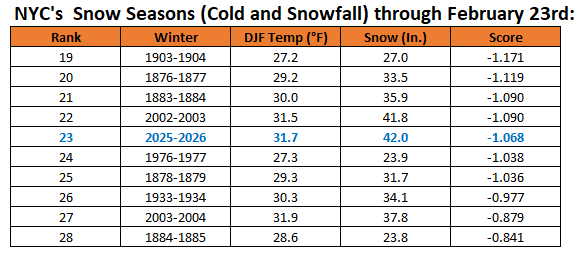
The final precipitation for NYC was 1.92". The NBM came closest while many of the global models, especially the ECMWF and UKMET badly underforecast the precipitation. The QPF and snowfall amounts were trimmed further by 6z on February 22. Some of the social media "forecasters" chased the models into a dead-end and missed the much larger magnitude of snowfall. As noted previously, social media (and increasingly TV) isn't a good source of credible weather information. Anyone can play forecaster where meteorological knowledge is superficial, hype reigns and verification is non-existent. A potent clue that the "low-balled" idea was a bad one rest in the storm's forecast dynamics. Explosively deepening and super intense storms have very efficient and powerful dynamics that maximize snowfall. One saw such a case during February 11-12, 2006. The blizzard's dynamics outran the models and the forecasts. What had been expected to be about a foot of snow in NYC wound up being 26.9". Forecast amounts were increased several times when the blizzard was underway. The region experienced a top-tier blizzard. Newark experienced its first-ever case of two consecutive days with 10.0" or above snowfall: February 22: 10.1"; February 23: 17.1". Records go back to May 1843. In terms of verification, I had several large errors (4" or more outside of the forecast range), as the snowfall was far more intense in Islip and Providence than I had forecast. That intense banding was likely somewhere on Long Island and Rhode Island/southeast Massachusetts was not the issue. Placement of the banding was the issue for me. Even with today's mesoscale guidance, the placement of banding often isn't possible until the storm is underway and the banding is developing/has developed. The NWS did a terrific job in its forecasting. Mount Holly's, Taunton's, and Upton's discussions and forecasts were outstanding in advance of the storm and throughout the storm. Finally, the blizzard lifted winter 2025-2026 into a Top 25 place for New York City where records go back to Winter 1869-1870. Additional snowfall would lock in a Top 25-Top 30 ranking.
-
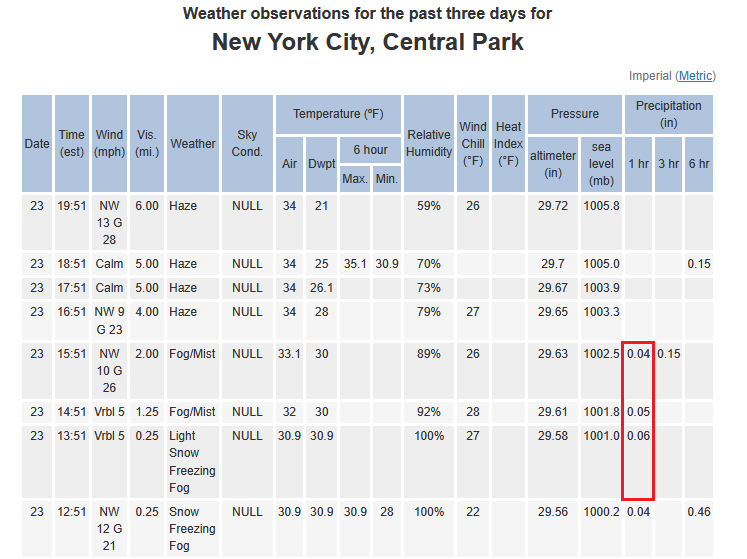
As of 1 pm, Central Park reported 19.7" of snow. Yet, after 1 pm, there was additional measurable precipitation. Based on the additional precipitation, the final figure should probably be close to 21". We'll see what is reported tonight, as no 7 pm update was provided.
-
"Don’t do it" 2026 Blizzard obs, updates and pictures.
donsutherland1 replied to Ginx snewx's topic in New England
706 SXUS71 KBOX 240003 RERPVD RECORD EVENT REPORT NATIONAL WEATHER SERVICE BOSTON/NORTON, MA 700 PM EST MON FEB 23 2026 ...RECORD SNOWSTORM FOR PROVIDENCE RI... THE BLIZZARD OF 2026 BROKE SEVERAL SNOWFALL RECORDS AT RHODE ISLAND T.F. GREEN INTERNATIONAL AIRPORT IN PROVIDENCE: - STORM TOTAL SNOWFALL OF 37.9 INCHES BROKE THE RECORD FOR THE GREATEST SINGLE SNOWSTORM ON RECORD, WHICH WAS 28.6 INCHES SET DURING THE BLIZZARD OF `78, ON FEBRUARY 6-7, 1978. - DAILY SNOWFALL OF 35.5 INCHES BROKE THE RECORD ONE-DAY SNOWFALL, WHICH WAS 19.0 INCHES SET DURING THE BLIZZARD OF `96, ON JANUARY 8, 1996. - FINALLY, THE DAILY SNOWFALL OF 35.5 INCHES BROKE THE RECORD SNOWFALL FOR FEBRUARY 23, WHICH WAS JUST 3.8 INCHES IN 1967. A FINAL UPDATE WILL BE SENT JUST AFTER MIDNIGHT. $$ JWD/KJC -
February 2026 OBS & Discussion
donsutherland1 replied to Stormlover74's topic in New York City Metro
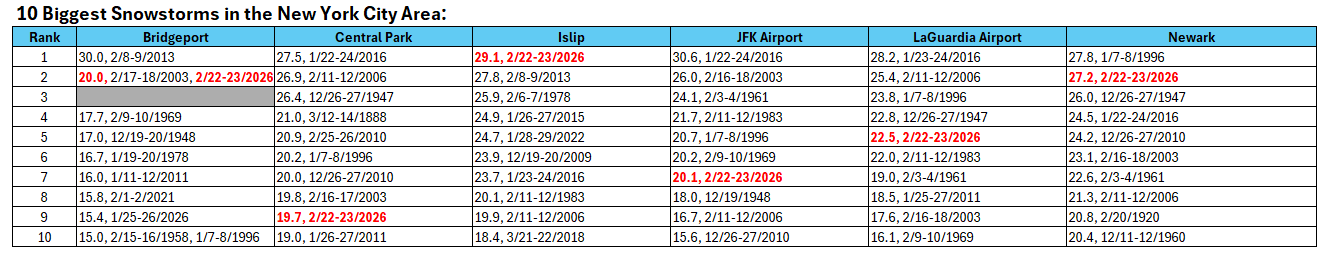
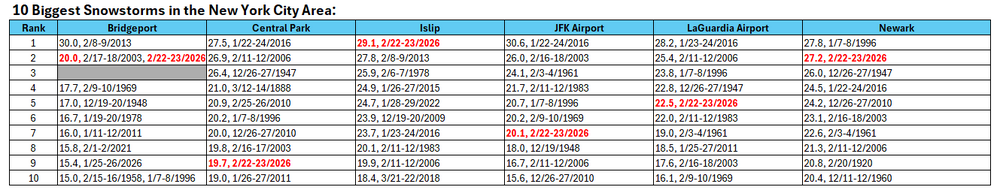
A monster blizzard has departed the region after leaving its mark in the record books. Central Park saw its 9th biggest snowstorm on record. Newark experienced its second largest snowstorm. Bridgeport's 20.0" snowfall tied February 17-18, 2003 for the second biggest on record. Both Islip and Providence set new records for their biggest snowstorm on record. 1 SE Warwick, RI picked up 36.2" of snow. New York City's 10 Biggest Snowstorms: 1 27.5", January 22-24, 2016 2 26.9", February 11-12, 2006 3 26.4", December 26-27, 1947 4 21.0", March 12-14, 1888 5 20.9", February 25-26, 2010 6 20.2", January 7-8, 1996 7 20.0", December 26-27, 2010 8 19.8", February 16-17, 2003 9 19.7", February 22-23, 2026 10 19.0", January 26-27, 2011 As a result, Winter 2025-2026 has become just the 10th winter with two 10" or above snowstorms in New York City. The others were 1895-1996, 1925-1926, 1960-1961, 1977-1978, 1995-1996, 2003-2004, 2009-2010 (3 such storms), 2010-2011, and 2013-2014. Even more impressive, Winter 2025-2026 will is on track to join Winters 1960-1961 and 1977-1978 as the only winters with two or more 10" snowstorms, a seasonal mean temperature of 32° or below and seasonal snowfall of 40.0" or above. Following the blizzard, tomorrow will be fair and unseasonably cold. Wednesday will be somewhat milder with some rain showers. A period of rain or wet snow is possible late Thursday and Thursday night. The ENSO Region 1+2 anomaly was +1.2°C and the Region 3.4 anomaly was -0.1°C for the week centered around February 11. For the past six weeks, the ENSO Region 1+2 anomaly has averaged +0.37°C and the ENSO Region 3.4 anomaly has averaged -0.32°C. Neutral ENSO conditions have now developed. Neutral ENSO conditions will continue through at least mid-spring. The SOI was +5.96 today. The preliminary Arctic Oscillation (AO) was +0.459 today. Based on sensitivity analysis applied to the latest guidance, there is an implied near 100% probability that New York City will have a cooler than normal February (1991-2020 normal). February will likely finish with a mean temperature near 31.5° (4.4° below normal). Supplemental Information: The projected mean would be 3.8° below the 1981-2010 normal monthly value. Overall, Winter 2025-2026 is on track for a seasonal mean temperature of 31.9°. If a 32.0° or below seasonal mean temperature occurs, that would be the lowest winter mean temperature since Winter 2014-2015 when the mean temperature was 31.7°. Winter 2025-2026 would only become the fourth winter of the 21st century with a mean temperature of 32.0° or below. -
It already broke the 1978 record (28.6").
-
Yes. Its period of record is relatively short.
-
The 17.4" includes the February 2-3 amounts.
-
PVD is in the process of destroying its 1978 record. So far, it has seen 32.8" and it continues to snow heavily.
-
Islip: 29.1". That breaks the all-time record of 27.8" from February 8-9, 2013.
-
"Don’t do it" 2026 Blizzard obs, updates and pictures.
donsutherland1 replied to Ginx snewx's topic in New England
BOX local storm report summary: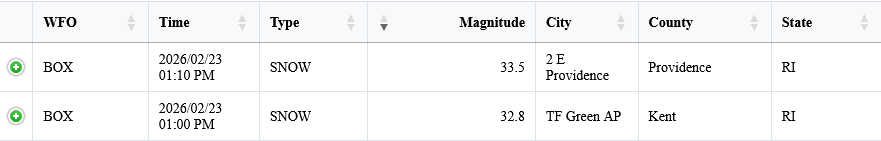
-
"Don’t do it" 2026 Blizzard obs, updates and pictures.
donsutherland1 replied to Ginx snewx's topic in New England
Providence has received 32.8" of snow so far. That smashes the old record of 28.6" from the Blizzard of 1978 (February 6-7, 1978). -
Not yet.
-
1843.
-
At a minimum, they should let the public know when the measurement was made. Next report will be shortly after 1 pm.
-
That was the 7 am figure.
-
Larchmont, NY.
-
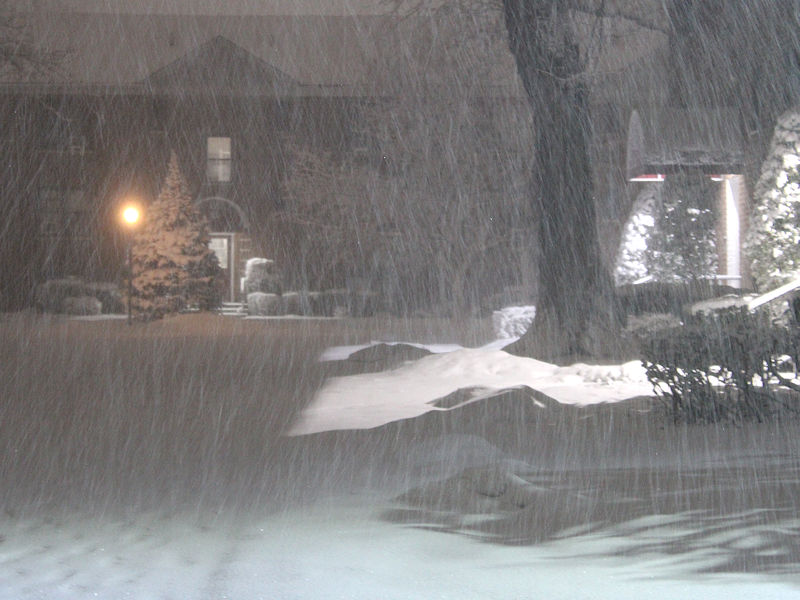
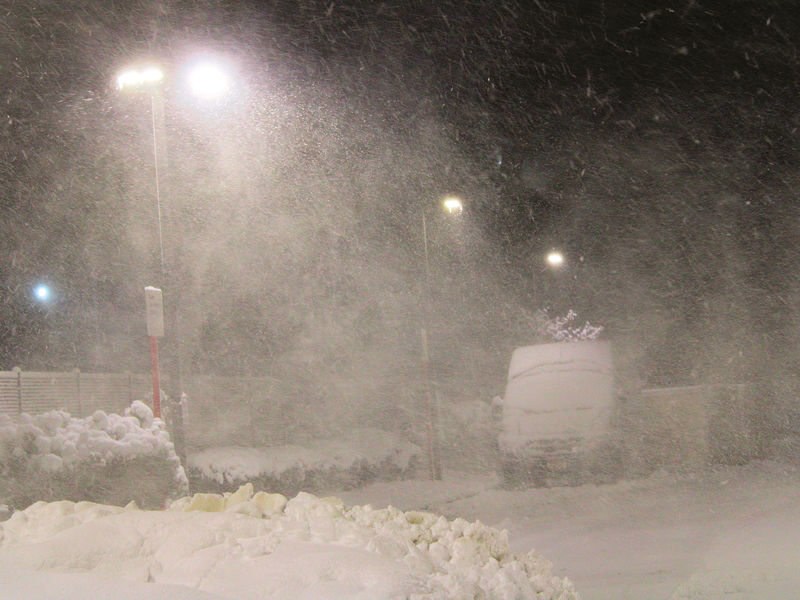
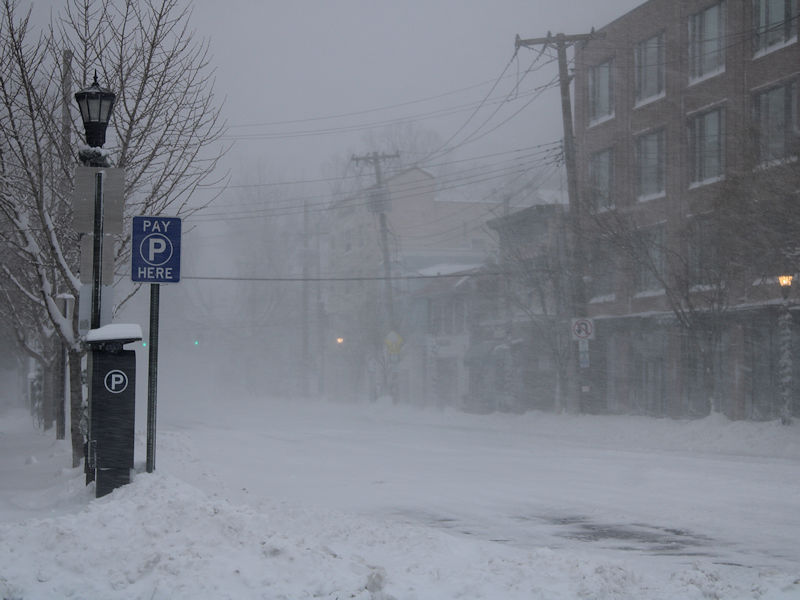
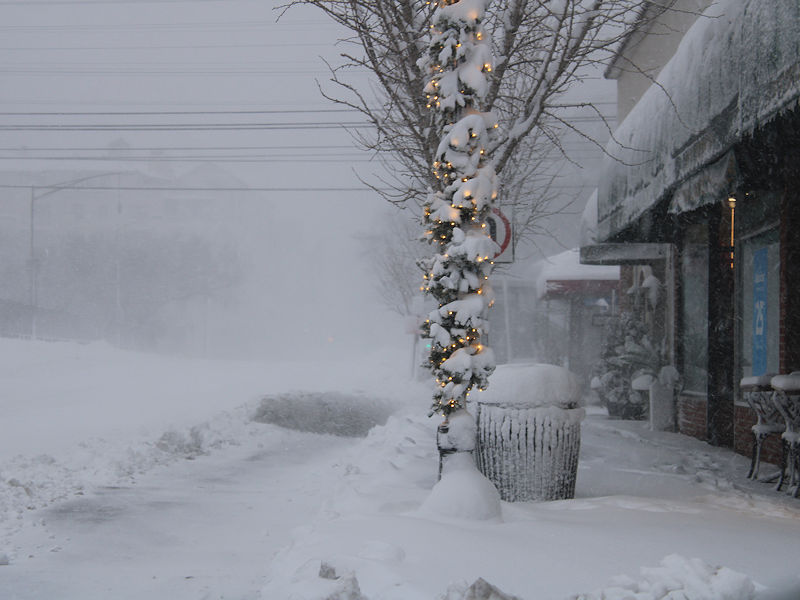
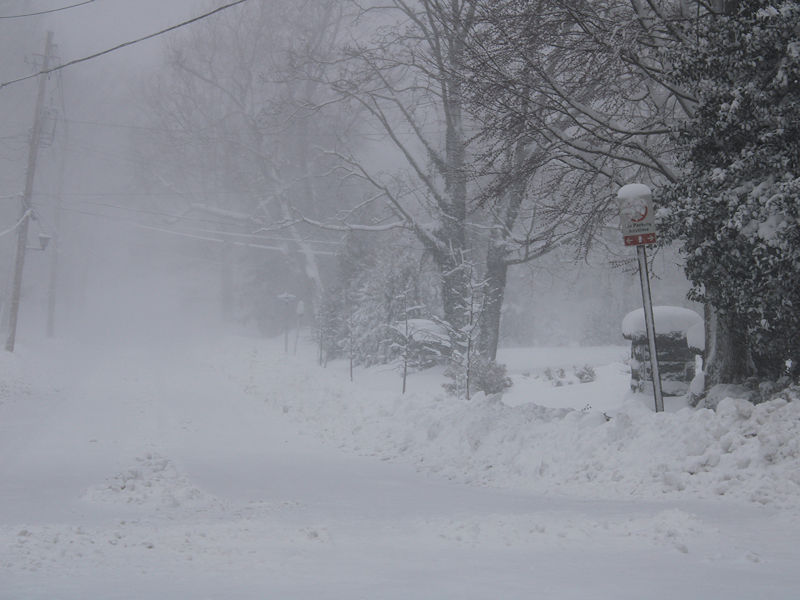
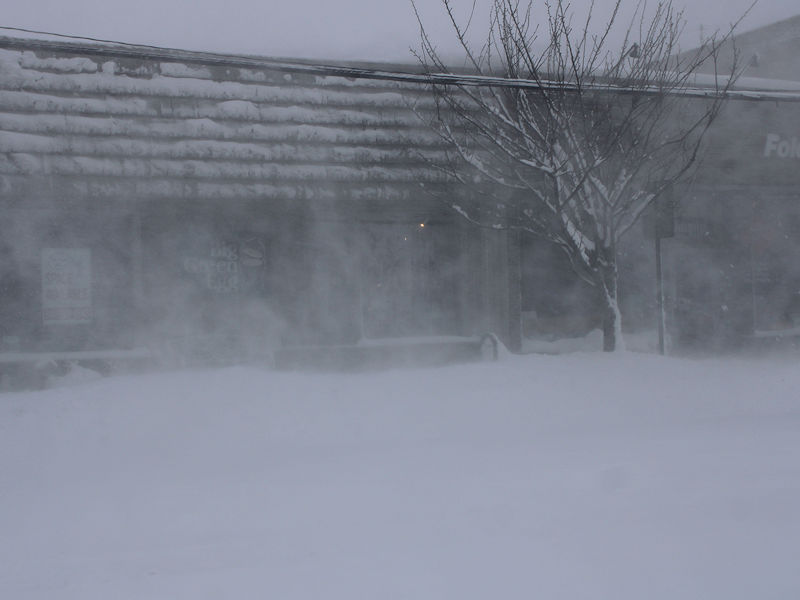
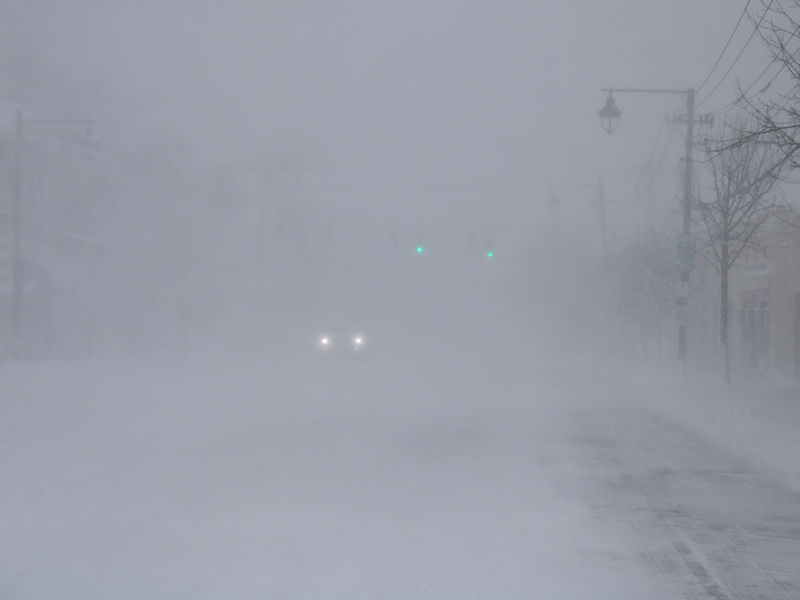
Five photos from the ongoing blizzard:
-
Some snow measurements: Islip: 22.5" New York City-Central Park: 15.1" Newark: 18.3"
-
Islip: 20.0". That now ranks as Islip's 8th biggest snowstorm on record. Islip's figure will climb higher in the rankings.
-
Short video from around 5:15 am:
-
1 W Nesconset and 2 SSE Manorville are leading the way in terms of snowfall with 8.8" and 8.0" respectively so far.
-
Around 4" when I went to Mamaroneck. Larchmont has about the same.
-
Two photos from Mamaroneck, NY. The wind is starting to pick up.