donsutherland1
-
Posts
24,195 -
Joined
Content Type
Profiles
Blogs
Forums
American Weather
Media Demo
Store
Gallery
Everything posted by donsutherland1
-
Occasional Thoughts on Climate Change
donsutherland1 replied to donsutherland1's topic in Climate Change
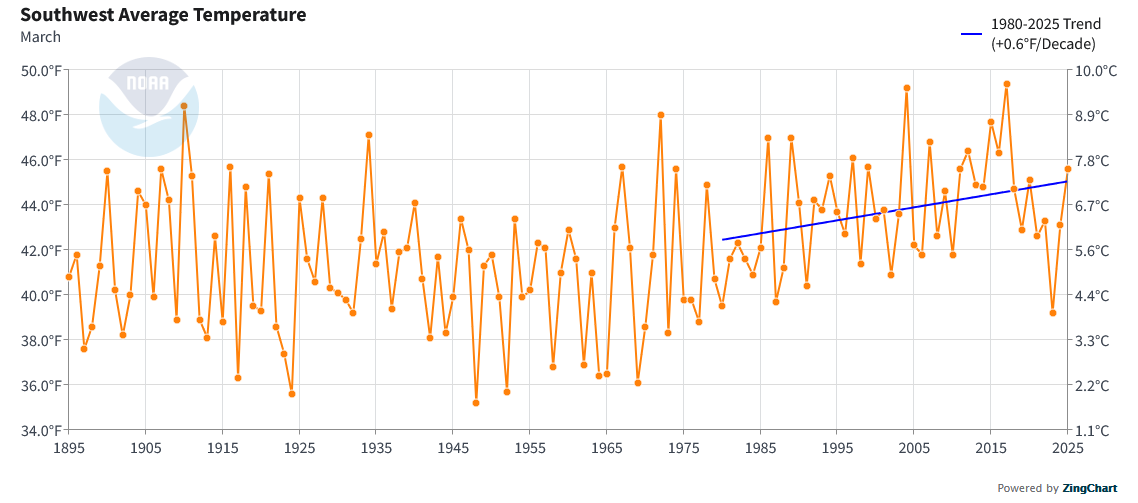
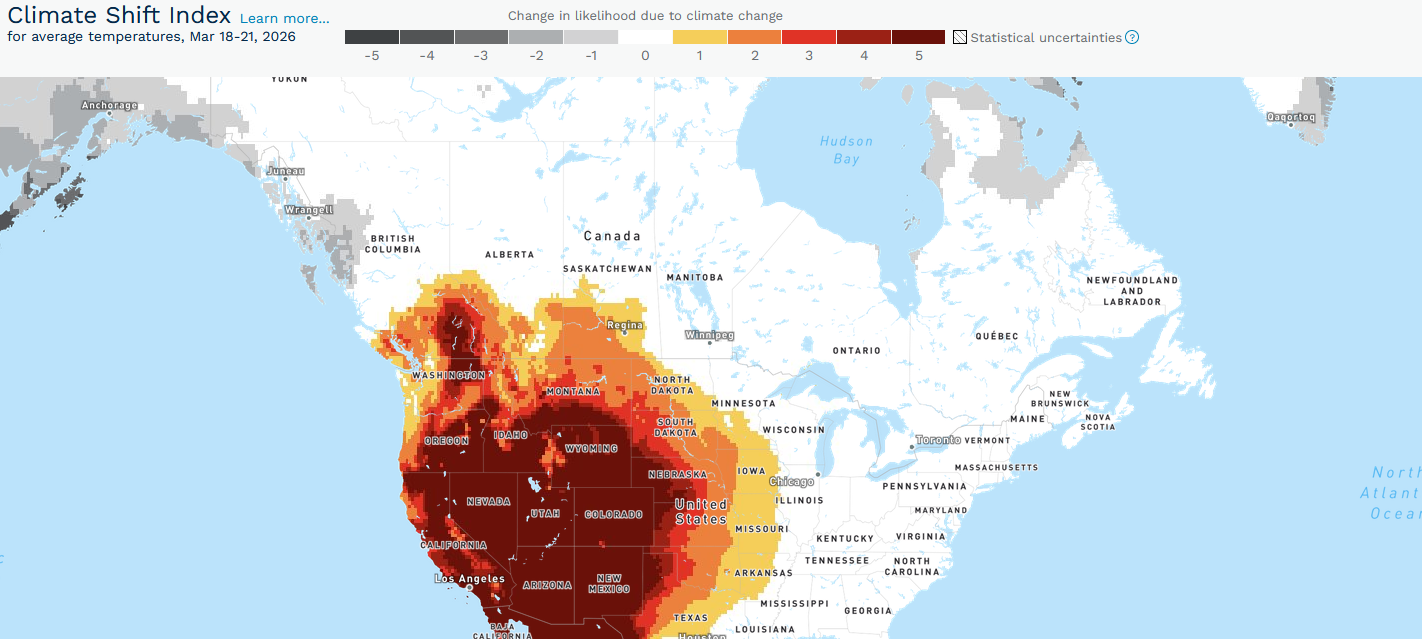
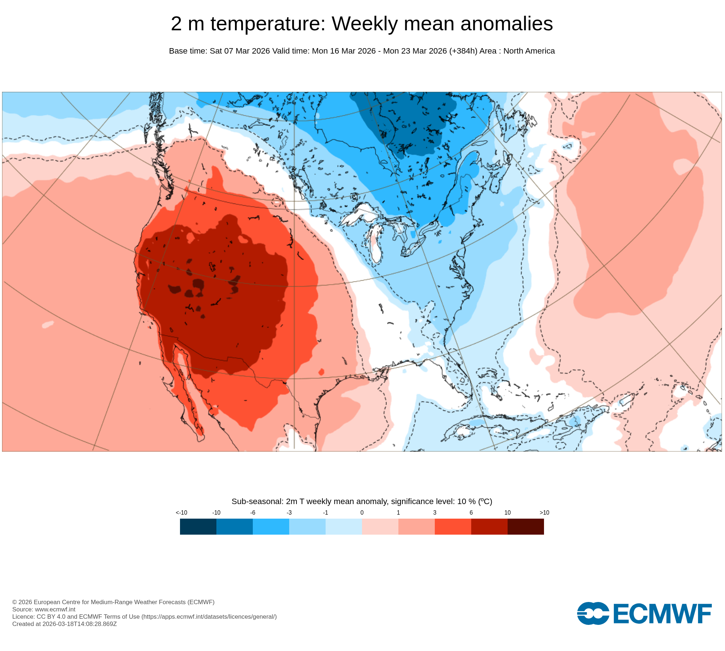
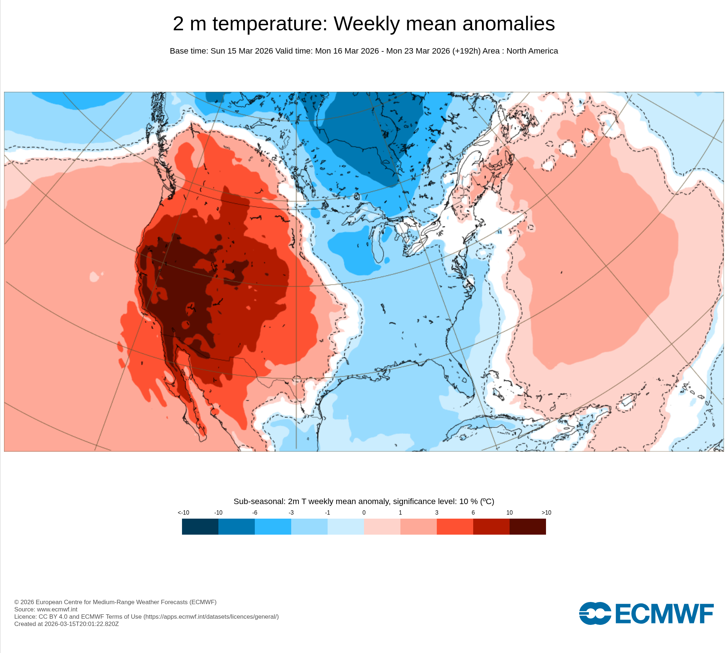
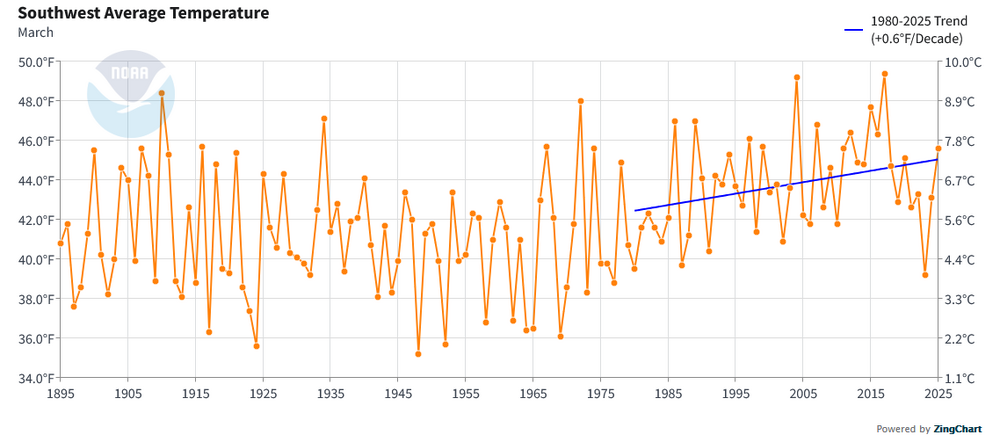
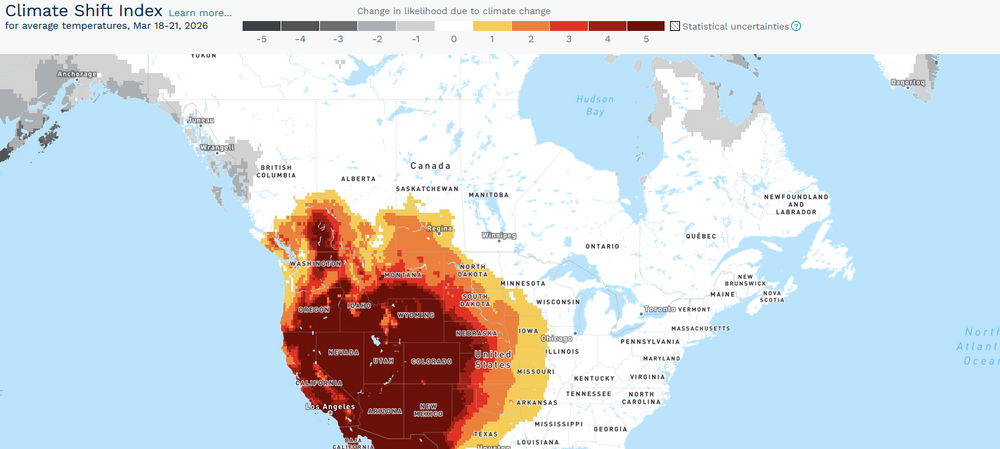
The long-advertised historic March heatwave is now gathering force in the Southwest. Already, monthly high temperature records have fallen in Burbank, Camarillo, and Thermal. Monthly marks were tied in Flagstaff and San Francisco. Downtown Los Angeles missed its longstanding monthly record from 1879 by 1°. Although Palm Springs missed its monthly record by 1° yesterday, it demolished its monthly warmest minimum temperature record by 5° with a low of 75° (a level not seen previously until April 21st). Following the conclusion of a winter that was the warmest on record for many parts of the region, the signature for a possible heat event appeared far in advance. ECMWF Weeklies: March 1: The guidance remained persistence and moved toward an extreme event as the lead time shortened. ECMWF Weeklies: March 7: The final ECMWF weekly forecast from March 15 showed a record-breaking event was imminent. ECMWF Weeklies: March 15: Despite the attention high-profile urban areas receive, the entire region has been warming. Southwest (1980-2025): Warming can produce a non-linear increase in the frequency and severity of heat events, including outside of summer. The March 2012 and September-October 2024 heat events are examples. Climate Central has estimated that climate change has made the forecast event for the Southwest/West at least 5 times more likely in much of those regions. One can expect an avalanche of monthly records over the coming days. Some records could reach or exceed April monthly marks.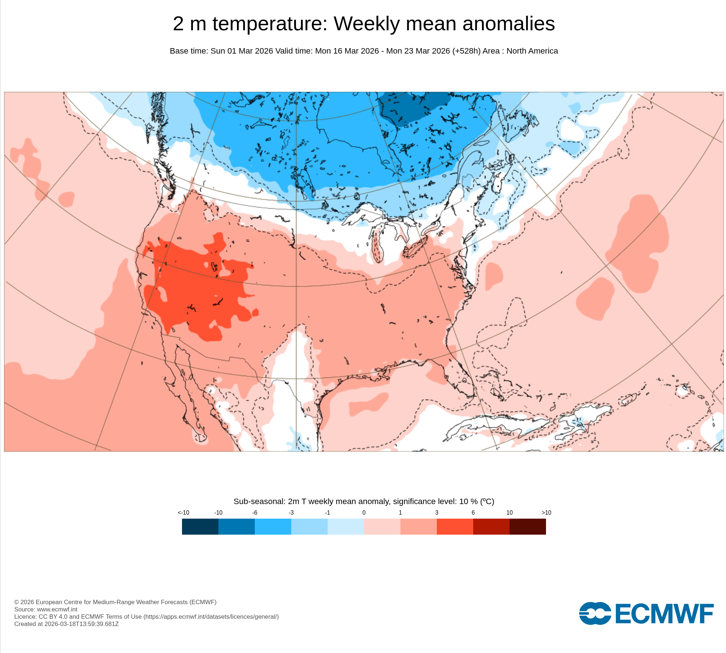
-
Colder air has returned to the region. After a low in the upper 20s tomorrow morning, New York City will see a high near or just below 40°. Thursday will see the temperature return to the middle 40s. Readings will then return to the 50s for Friday through the weekend. The major weather story this week will be the super March heatwave that is now developing in much of the western U.S. March monthly records are likely to be smashed in numerous cities, including Albuquerque, Flagstaff, Fresno, Las Vegas, Palm Springs, Phoenix, Reno, Salt Lake City, and Yuma. Already, Camarillo, CA reached a March record 96° today. The ENSO Region 1+2 anomaly was +1.5°C and the Region 3.4 anomaly was 0.0°C for the week centered around March 11. For the past six weeks, the ENSO Region 1+2 anomaly has averaged +0.98°C and the ENSO Region 3.4 anomaly has averaged -0.15°C. Neutral ENSO conditions will continue through at least mid-spring. The SOI was +1.87 today. The preliminary Arctic Oscillation (AO) was +0.492 today. Based on sensitivity analysis applied to the latest guidance, there is an implied 84% probability that New York City will have a warmer than normal March (1991-2020 normal). March will likely finish with a mean temperature near 45.1° (2.3° above normal). Supplemental Information: The projected mean would be 2.6° above the 1981-2010 normal monthly value.
-
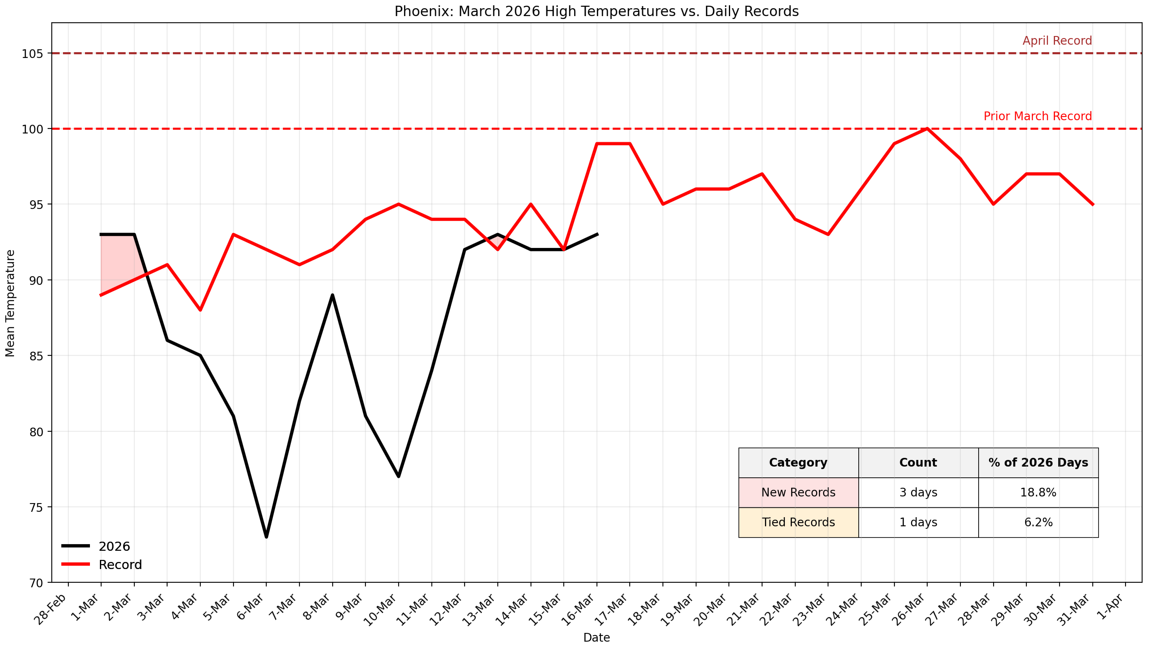
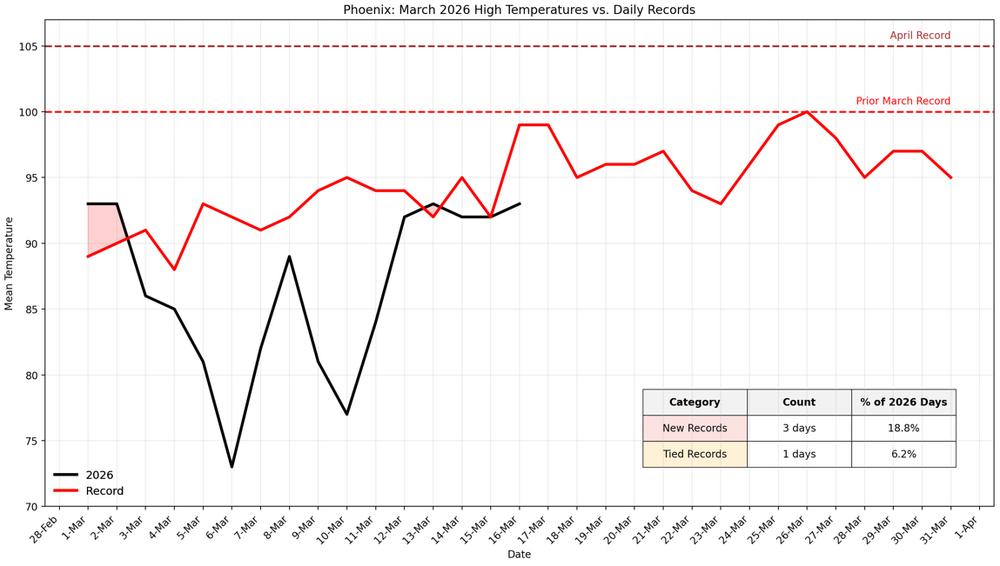
The unprecedented March heatwave is starting to build in the Phoenix area. As a result, March 2026 will very likely surpass the existing monthly mark by the largest margin on record for Phoenix. Through March 16th, Phoenix has a mean temperature of 73.3°. The prior March 1-16 record was 72.3° in 1972. So far, 25% of days have either tied or set daily records. So, even without the upcoming historic heatwave, March was running exceptionally warm.
-
This is very sad news. He was a fantastic member. May he rest in peace.
-
I am very sorry to learn this sad news. He was a great member and good person.
-
Following this evening's rain and thunderstorms, a shot of much cooler air will arrive for tomorrow. Lows in New York City could fall to the middle and upper 20s with highs in the upper 30s and lower 40s tomorrow and Wednesday However, with the AO likely to remain generally positive through around March 20th, the cool period likely won't be as prolonged as had been the case during this past winter's cold regimes. Temperatures should return to the middle and upper 40s by Thursday and the 50s to end the week. Uncertainty about the closing 7-10 days of March has increased. The major weather story this week will be the super March heatwave that will develop in much of the western U.S. March monthly records are likely to be smashed in numerous cities, including Albuquerque, Flagstaff, Fresno, Las Vegas, Palm Springs, Phoenix, Reno, Salt Lake City, and Yuma. The ENSO Region 1+2 anomaly was +1.5°C and the Region 3.4 anomaly was 0.0°C for the week centered around March 11. For the past six weeks, the ENSO Region 1+2 anomaly has averaged +0.98°C and the ENSO Region 3.4 anomaly has averaged -0.15°C. Neutral ENSO conditions will continue through at least mid-spring. The SOI was -4.88 today. The preliminary Arctic Oscillation (AO) was +0.744 today. Based on sensitivity analysis applied to the latest guidance, there is an implied 72% probability that New York City will have a warmer than normal March (1991-2020 normal). March will likely finish with a mean temperature near 44.6° (1.8° above normal). Supplemental Information: The projected mean would be 2.1° above the 1981-2010 normal monthly value.
-
@bluewavewas referring to the New York City region. Yes, the March 2012 heatwave, June 2021 PNW heatwave, April 1976 one (no longer as anomalous today due to the 2002 heatwave) are also benchmark heat events.
-
Yes. February 2018 is probably best comparison for this region. It's incredible that the Southwest/West is seeing such an extreme event so soon after the September-October 2024 heat during which Phoenix set or tied daily records on 21 consecutive days and easily set new September and October monthly records.
-
Yes. Only once on March 26, 1988
-
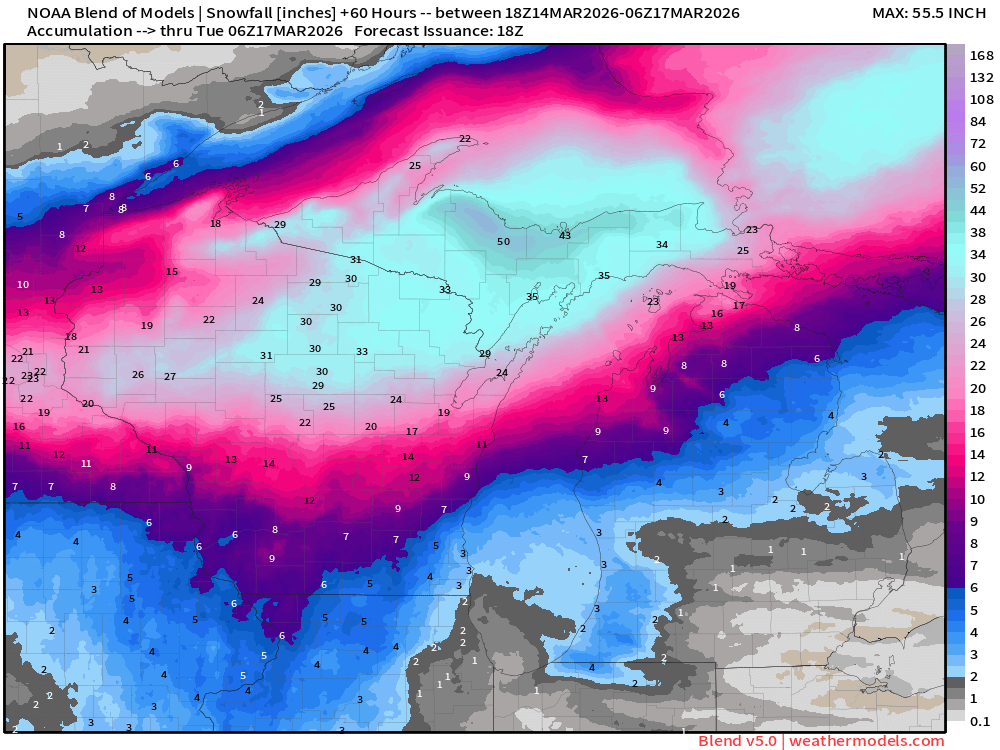
The storm currently bringing blizzard conditions to parts of the Upper Midwest will bring a soaking rain to the New York City region tonight and tomorrow. A general 0.50"-1.50" rainfall with locally higher amounts is likely. Strong thunderstorms are possible in parts of the area. The rain could end as flurries or a period of wet snow in some of the distant northern and western suburbs. Following storm, a shot of much cooler air could arrive on Tuesday. Lows in New York City could fall to the middle and upper 20s with highs in the upper 30s and lower 40s on Tuesday and Wednesday However, with the AO likely to remain generally positive through around March 20th, the cool period likely won't be as prolonged as had been the case during this past winter's cold regimes. Temperatures should return to the middle and upper 40s by Thursday and the 50s to end the week. Uncertainty about the closing 7-10 days of March has increased. The major weather story this week will be the super March heatwave that will develop in much of the western U.S. March monthly records are likely to be smashed in numerous cities, including Albuquerque, Flagstaff, Fresno, Las Vegas, Palm Springs, Phoenix, Reno, Salt Lake City, and Yuma. The ENSO Region 1+2 anomaly was +0.9°C and the Region 3.4 anomaly was -0.1°C for the week centered around March 4. For the past six weeks, the ENSO Region 1+2 anomaly has averaged +0.80°C and the ENSO Region 3.4 anomaly has averaged -0.23°C. Neutral ENSO conditions have now developed. Neutral ENSO conditions will continue through at least mid-spring. The SOI was -9.19 today. The preliminary Arctic Oscillation (AO) was +1.602 today. Based on sensitivity analysis applied to the latest guidance, there is an implied 70% probability that New York City will have a warmer than normal March (1991-2020 normal). March will likely finish with a mean temperature near 44.5° (1.7° above normal). Supplemental Information: The projected mean would be 2.0° above the 1981-2010 normal monthly value.
-
2025-2026 ENSO
donsutherland1 replied to 40/70 Benchmark's topic in Weather Forecasting and Discussion
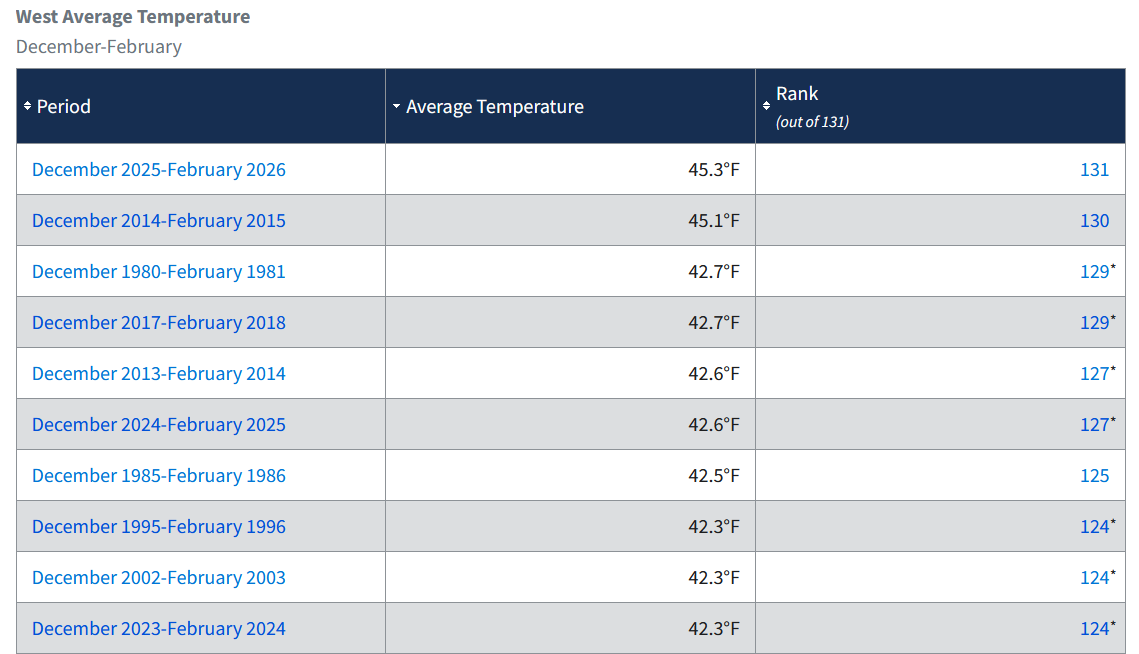
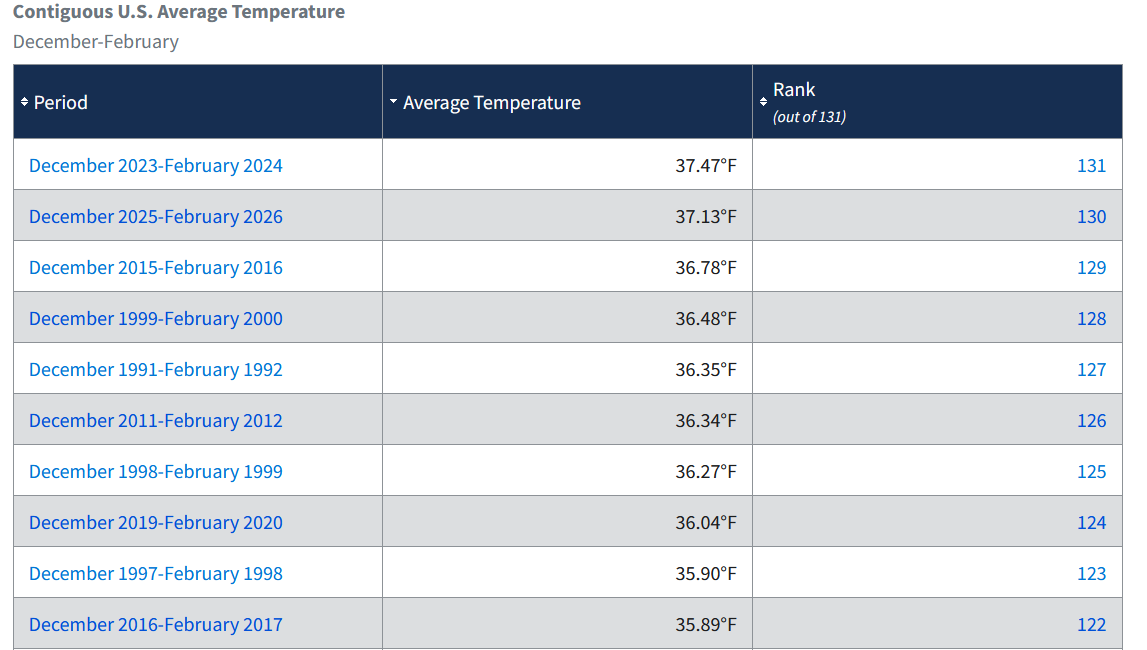
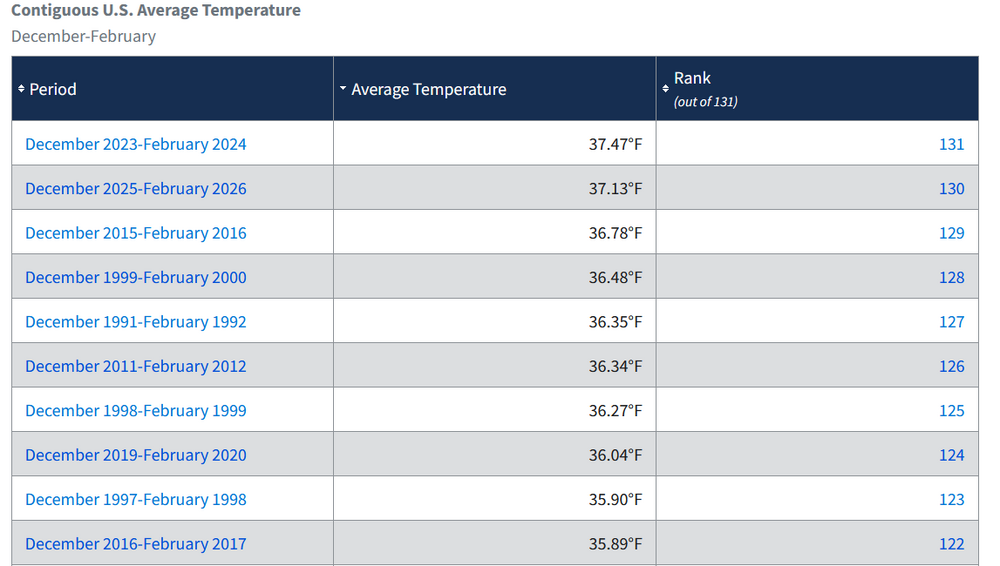
The last three winters have all ranked among the 10 warmest in the West: A disproportionate share of top 10 warm winters in the West and nationwide have occurred since 2000: The Great Lakes and Northeast were fortunate to have a cold and snowy (especially in the Northeast) winter. Such winters can still occur, and likely will occur for decades to come, but they have become notably less frequent on a nationwide basis.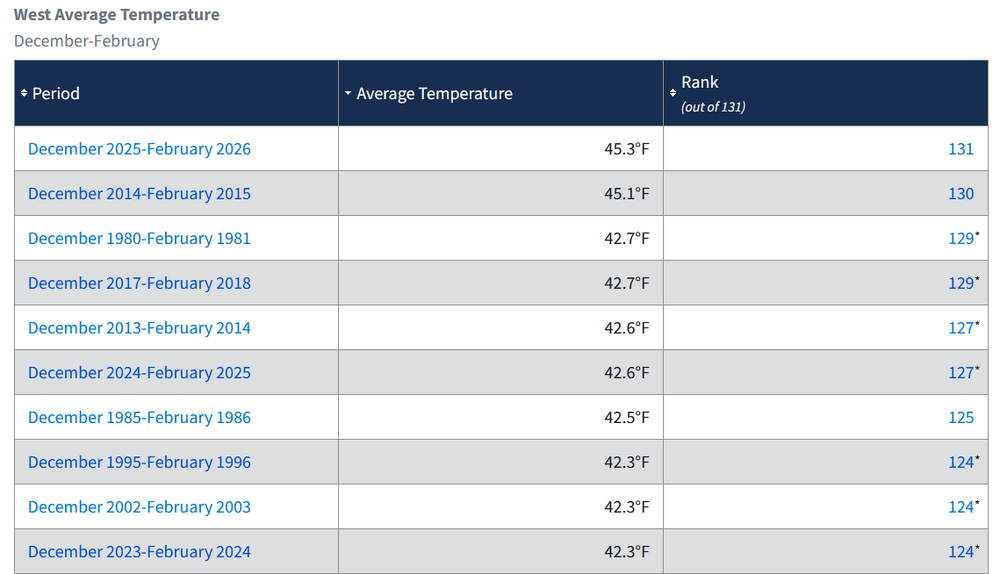
-
This heat event will be among the most impressive heat events on record relative to climatology. It will rank up there with the March 2012, June 2021 PNW, September-October 2024 Southwest heat events in terms of peak temperatures relative to normal. The national March high temperature mark of 108° should fall. Numerous cities will surpass not just March, but also April monthly records.
-
Webcam for Marquette:
-
Generally cooler weather will prevail through the weekend. A storm will bring a soaking rain to the New York City region Sunday night and Monday. A general 0.50"-1.50" rainfall with locally higher amounts is likely. The rain could end as flurries or a period of wet snow in some of the distant northern and western suburbs. Following storm, a shot of much cooler air could arrive on Tuesday. Lows in New York City could fall to the middle and upper 20s with highs in the upper 30s and lower 40s on Wednesday and Thursday. However, with the AO likely to remain generally positive through around March 20th, the cool period likely won't be as prolonged as had been the case during this past winter's cold regimes. Uncertainty about the closing 7-10 days of March has increased. The major weather story next week will be the super March heatwave that will develop in much of the western U.S. March monthly records are likely to be smashed in numerous cities, including Albuquerque, Flagstaff, Fresno, Las Vegas, Palm Springs, Phoenix, Reno, Salt Lake City, and Yuma. The ENSO Region 1+2 anomaly was +0.9°C and the Region 3.4 anomaly was -0.1°C for the week centered around March 4. For the past six weeks, the ENSO Region 1+2 anomaly has averaged +0.80°C and the ENSO Region 3.4 anomaly has averaged -0.23°C. Neutral ENSO conditions have now developed. Neutral ENSO conditions will continue through at least mid-spring. The SOI was +10.43 today. The preliminary Arctic Oscillation (AO) was +2.305 today. Based on sensitivity analysis applied to the latest guidance, there is an implied 70% probability that New York City will have a warmer than normal March (1991-2020 normal). March will likely finish with a mean temperature near 44.6° (1.8° above normal). Supplemental Information: The projected mean would be 2.1° above the 1981-2010 normal monthly value.
-
NBM 5.0:
-
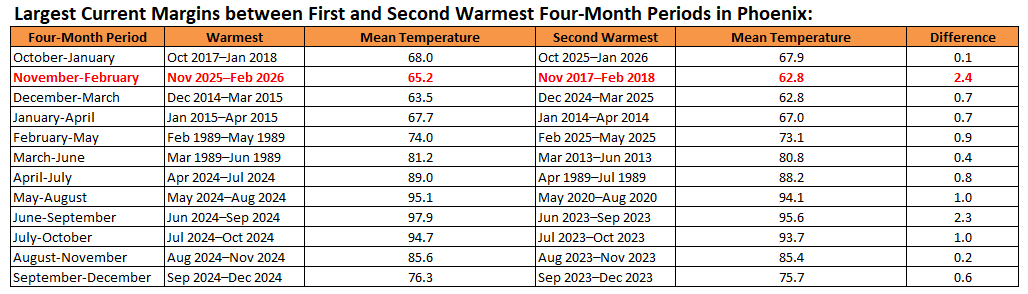
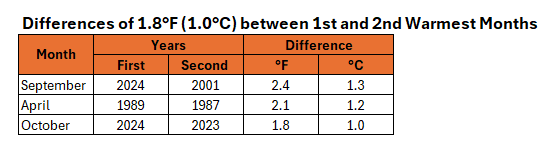
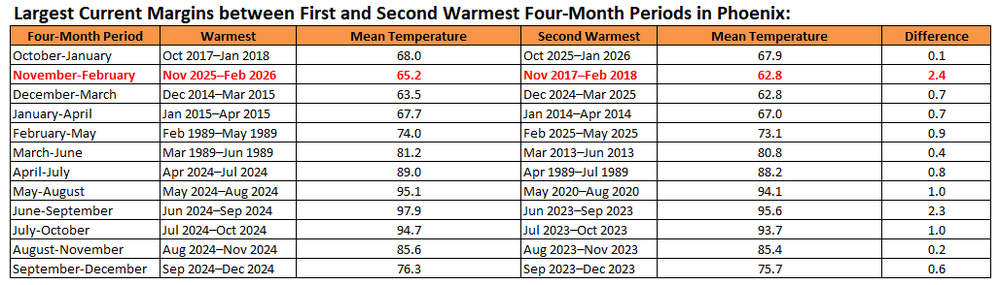
That would break the four-month record that was set during November-February 2025-2026 (2.4°), which is currently the largest such margin for any four-month period. For reference:
-
Generally cooler weather will prevail through the weekend. Following a soaking rain on Monday, a shot of much cooler air could arrive on Tuesday. Lows in New York City could fall to the middle and upper 20s with highs in the upper 30s and lower 40s on Wednesday and Thursday. However, with the AO likely to remain generally positive, the cool period likely won't be as prolonged as had been the case during this past winter's cold regimes. The major weather story next week will be the super March heatwave that will build in much of the western U.S. March monthly records are likely to be smashed in numerous cities. The ENSO Region 1+2 anomaly was +0.9°C and the Region 3.4 anomaly was -0.1°C for the week centered around March 4. For the past six weeks, the ENSO Region 1+2 anomaly has averaged +0.80°C and the ENSO Region 3.4 anomaly has averaged -0.23°C. Neutral ENSO conditions have now developed. Neutral ENSO conditions will continue through at least mid-spring. The SOI was +26.18 today. The preliminary Arctic Oscillation (AO) was +3.365 today. Based on sensitivity analysis applied to the latest guidance, there is an implied 76% probability that New York City will have a warmer than normal March (1991-2020 normal). March will likely finish with a mean temperature near 44.9° (2.1° above normal). Supplemental Information: The projected mean would be 2.4° above the 1981-2010 normal monthly value.
-
Yes. I will do so.
-
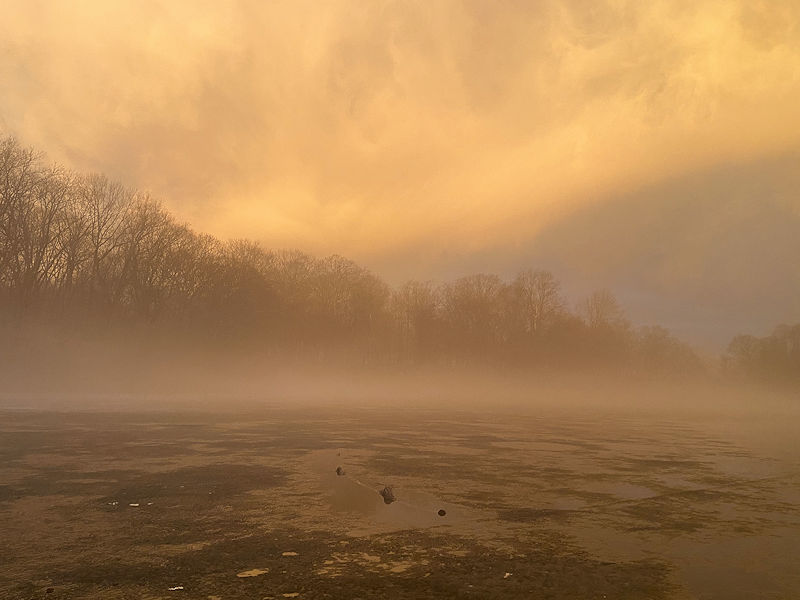
Sky this morning over a still largely ice-covered Larchmont Reservoir:
-
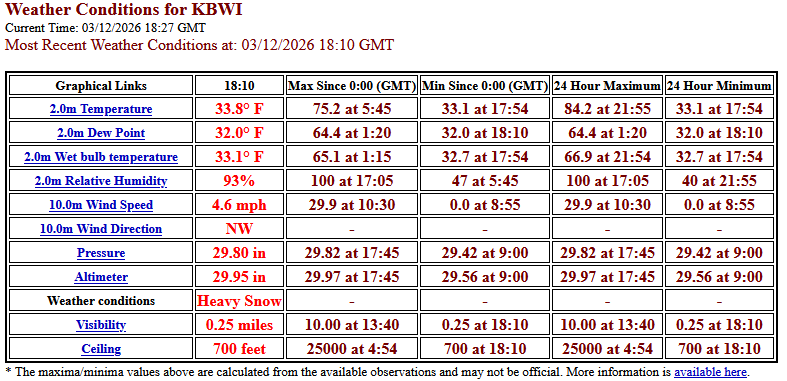
With today's snowfall, Central Park tied the record for fewest days between an 80° or above temperature at Central Park and a trace or more of snow. The records are below: April 7, 1942: 82°; April 9, 1942: 2.1" March 20, 1945: 83°; March 22, 1945: Trace April 1, 1978: 81°; April 3, 1978: Trace March 10, 2026: 80°; March 12, 2026: Trace Generally cooler weather will prevail through the weekend. Following a soaking rain on Monday, a shot of much cooler air could arrive on Tuesday. Lows in New York City could fall to the middle and upper 20s with highs in the upper 30s and lower 40s on Wednesday and Thursday. However, with the AO likely to remain generally positive, the cool period likely won't be as prolonged as had been the case during this past winter's cold regimes. There may be a short window of opportunity for some snow, but snow is not assured. The ENSO Region 1+2 anomaly was +0.9°C and the Region 3.4 anomaly was -0.1°C for the week centered around March 4. For the past six weeks, the ENSO Region 1+2 anomaly has averaged +0.80°C and the ENSO Region 3.4 anomaly has averaged -0.23°C. Neutral ENSO conditions have now developed. Neutral ENSO conditions will continue through at least mid-spring. The SOI was +24.08 today. The preliminary Arctic Oscillation (AO) was +3.714 today. Based on sensitivity analysis applied to the latest guidance, there is an implied 75% probability that New York City will have a warmer than normal March (1991-2020 normal). March will likely finish with a mean temperature near 44.8° (2.0° above normal). Supplemental Information: The projected mean would be 2.3° above the 1981-2010 normal monthly value.
-
Snowing in the Bronx.
-
DCA picked up 0.1" today after an early morning high of 78°. Yesterday's high there was 86°.
-
80 Degrees to Ripping Snow: March 12th
donsutherland1 replied to SnowenOutThere's topic in Mid Atlantic
-
There is now sleet in the Bronx.
-
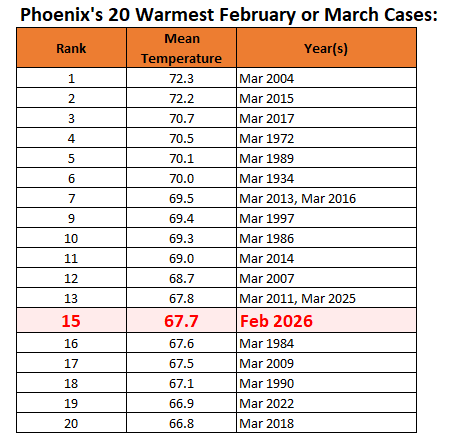
While Phoenix awaits the development of what will likely become a super March heatwave, a look back at February's exceptional warmth reveals that February 2026 would currently rank as the 15th warmest March on record. February and March records go back to 1896.