donsutherland1
-
Posts
24,118 -
Joined
Content Type
Profiles
Blogs
Forums
American Weather
Media Demo
Store
Gallery
Everything posted by donsutherland1
-
Occasional Thoughts on Climate Change
donsutherland1 replied to donsutherland1's topic in Climate Change
Brunswick 23S (2005-2025), Newton 11 SW (2003-2025), Newton 8W (2003-2025) are warming about 0.9°/decade. That matches Georgia's statewide warming during 2003-2025/2005-2025. Watkinsville 5 SSE (2005-2025) is warming 0.6°/decade, which is somewhat slower than the statewide average. -
Periods of rain are likely into early tomorrow. The temperature will reach the middle and upper 40s tomorrow. Additional rain is likely on Thursday into Friday. Highs will likely reach the lower 40s on both days. It will turn noticeably warmer during the weekend. Long Island and coastal sections could be noticeably cooler than interior sections on a number of days on account of a chilly onshore flow. The ENSO Region 1+2 anomaly was +1.0°C and the Region 3.4 anomaly was -0.1°C for the week centered around February 25. For the past six weeks, the ENSO Region 1+2 anomaly has averaged +0.62°C and the ENSO Region 3.4 anomaly has averaged -0.28°C. Neutral ENSO conditions have now developed. Neutral ENSO conditions will continue through at least mid-spring. The SOI was +19.34 today. The preliminary Arctic Oscillation (AO) was +0.253 today.
-
Should the AO stay positive, it will probably be a one-week or so window of opportunity. If, however, blocking develops, then the probability of a multi-week cold period would increase. Hopefully, we can get a decent storm during the window of opportunity.
-
Yes, you can use it.
-
Here’s a link: https://mrcc.purdue.edu/research/awssi
-
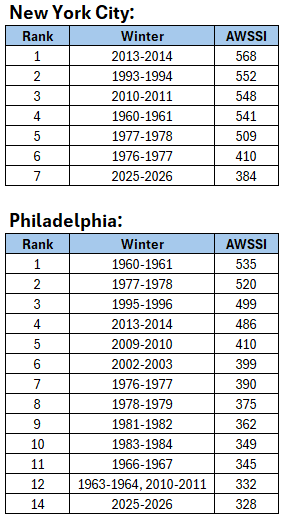
Here's the data: Note: The Index begins with 1950-51. Moreover, lots of data are missing e.g., 1995-1996 for New York City. The short timespan and missing data limit the Index's value.
-
Clouds will increase tonight and cloud cover will likely impede viewing of the lunar eclipse near sunrise tomorrow. Periods of mixed precipitation giving way to periods of rain are likely later Tuesday and Tuesday night. The temperature will reach the upper 30s and lower 40s. A sustained warming trend will commence on Wednesday. The second week of March could feature springlike readings. Long Island and coastal sections could be noticeably cooler than interior sections on a number of days on account of a chilly onshore flow. The ENSO Region 1+2 anomaly was +1.0°C and the Region 3.4 anomaly was -0.1°C for the week centered around February 25. For the past six weeks, the ENSO Region 1+2 anomaly has averaged +0.62°C and the ENSO Region 3.4 anomaly has averaged -0.28°C. Neutral ENSO conditions have now developed. Neutral ENSO conditions will continue through at least mid-spring. The SOI was +16.18 today. The preliminary Arctic Oscillation (AO) was -0.670 today.
-
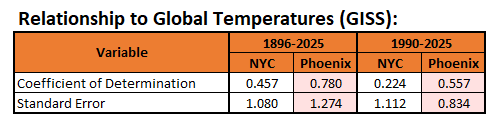
For what it's worth, it appears that global temperatures explain a larger share of Phoenix's (and perhaps the Southwest's) annual temperature variance than they do for such cities as New York.
-
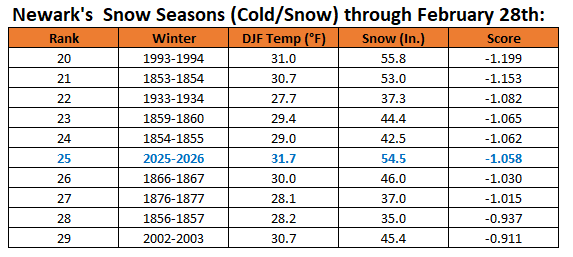
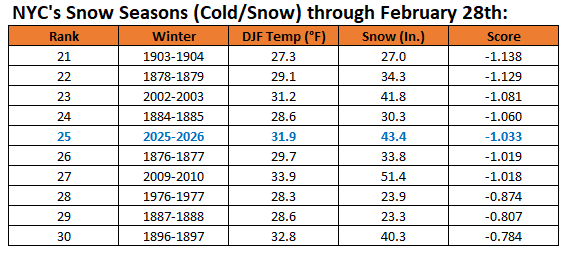
Here's the Top 30 data for through March 1st. The ranking is higher, as I excluded years with 25 or more missing days. Their inclusion previously skewed some of the results. I also used average of days (not months) when calculating the DJF mean temperature. That also led to minor adjustments from the prior list e.g., 1854-55 had a mean temperature of 29.1° vs. 29.0° (when all months were weighted equally). Rank Winter DJF Temp Snow Score 1 1872-1873 25.7 62.5 -2.225 2 1867-1868 25.0 53.3 -2.027 3 1904-1905 25.4 49.8 -1.856 4 1960-1961 30.6 69.5 -1.752 5 1917-1918 24.9 42.3 -1.684 6 1855-1856 26.4 46.8 -1.616 7 1947-1948 28.9 57.6 -1.609 8 1919-1920 26.7 45.9 -1.544 9 1977-1978 28.7 52.9 -1.485 10 1874-1875 25.6 38.9 -1.474 11 1864-1865 27.9 49.0 -1.473 12 1995-1996 31.6 62.8 -1.392 13 2013-2014 31.3 60.5 -1.360 14 1922-1923 28.9 48.9 -1.327 15 2010-2011 32.8 66.0 -1.324 16 1903-1904 24.7 29.9 -1.311 17 1906-1907 28.9 46.9 -1.262 18 1993-1994 31.0 55.8 -1.250 19 1853-1854 30.7 53.0 -1.203 20 1851-1852 28.0 41.0 -1.199 21 2025-2026 31.7 54.5 -1.108 22 1866-1867 29.8 46.0 -1.104 23 1854-1855 29.1 42.5 -1.090 24 1933-1934 28.0 37.0 -1.069 25 1876-1877 27.9 35.4 -1.032 26 1859-1860 29.4 41.4 -1.012 27 1856-1857 27.9 34.5 -1.002 28 2002-2003 30.7 44.8 -0.936 29 1898-1899 29.2 36.5 -0.881 30 1870-1871 29.6 37.1 -0.844
-
Thanks. I wasn't aware of it either.
-
With an AO+ likely to prevail through at least mid-March, there seems to be no mechanism that could drive the cold from Canada into the New York City area. Some fleeting cool shots are possible, but a sustained very cold regime appears unlikely. That means prospects for a 50.0" or above snow season at Central Park will decrease markedly. The percentage of cases with sufficient snowfall (6.6") to raise the seasonal total to 50.0" or above are below: On or after 3/15: 10.8% On or after 3/20: 6.3% On or after 3/25: 2.5% No meaningful snowfall is likely through at least March 15th.
-
It's 21st on the current final season ratings (through 2024-2025).
-
Here it is through February 28th:
-
Tomorrow will be blustery and cold. After an early morning low in the upper teens or lower 20s, New York City will see the temperature out near freezing. Clouds will increase tomorrow night and cloud cover could impede viewing of the lunar eclipse near sunrise Tuesday. Periods of mixed precipitation giving way to periods of rain is likely later Tuesday and Tuesday night. The temperature will reach the upper 30s and lower 40s. A sustained warming trend will commence on Wednesday. The second week of March could feature springlike readings. Long Island and coastal sections could be noticeably cooler than interior sections on a number of days on account of a chilly onshore flow. The ENSO Region 1+2 anomaly was +1.2°C and the Region 3.4 anomaly was -0.1°C for the week centered around February 11. For the past six weeks, the ENSO Region 1+2 anomaly has averaged +0.37°C and the ENSO Region 3.4 anomaly has averaged -0.32°C. Neutral ENSO conditions have now developed. Neutral ENSO conditions will continue through at least mid-spring. The SOI was +17.10 today. The preliminary Arctic Oscillation (AO) was -0.211 today.
-
It’s not final, as snow season isn’t finished. I will post it shortly.
-
There’s a similar situation in NYC: JFK reported 8” snow cover while Central Park had just 1”.
-
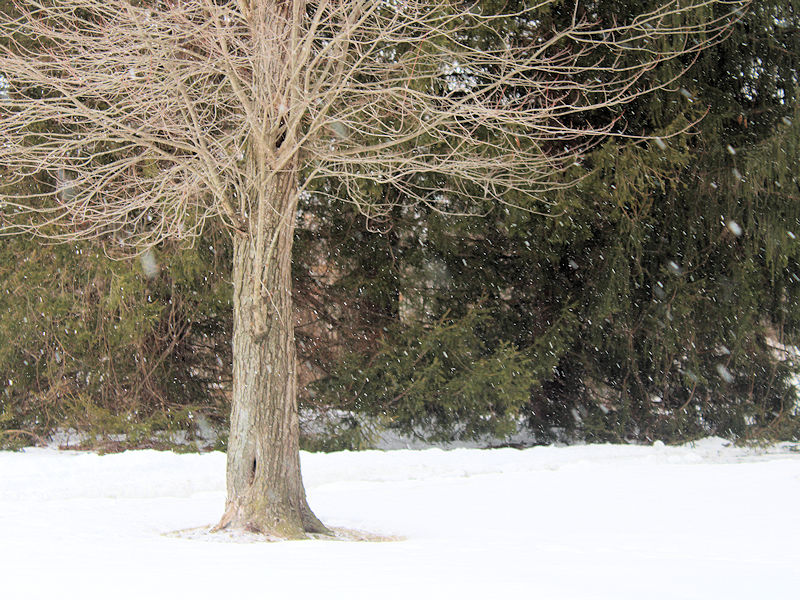
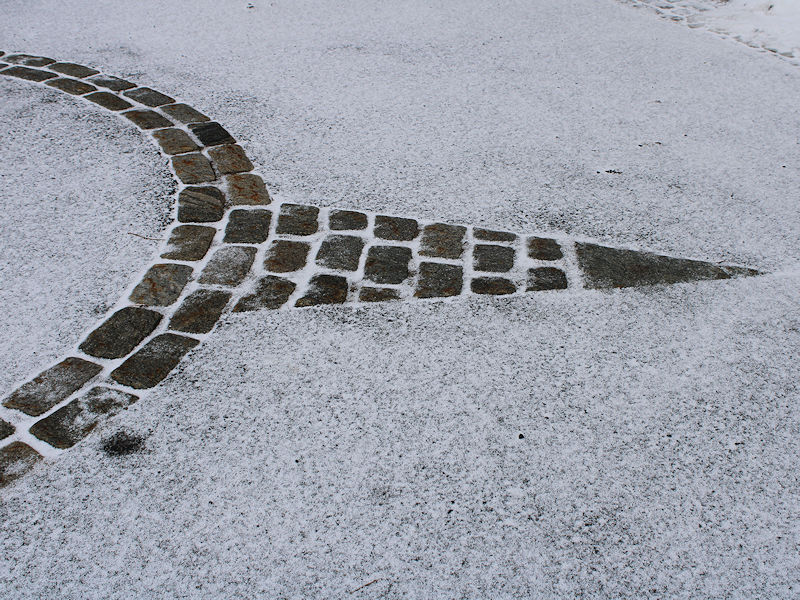
Light snow and thin coatings in Armonk, NY:
-
February 2026 OBS & Discussion
donsutherland1 replied to Stormlover74's topic in New York City Metro
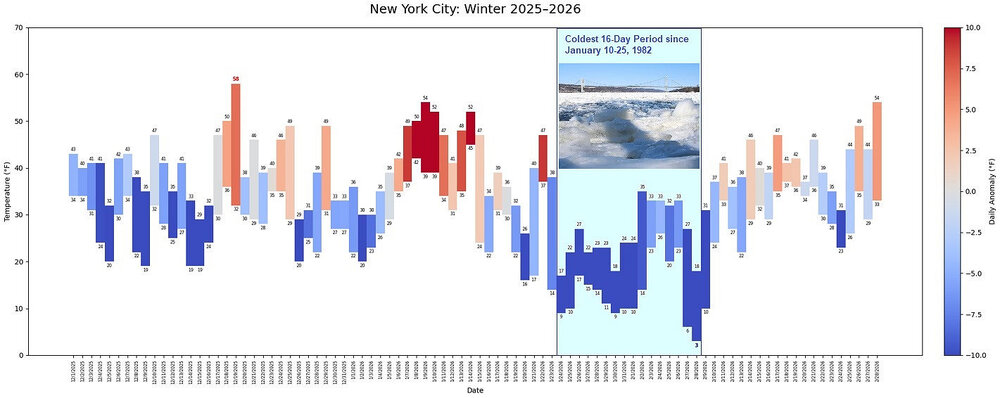
Final Winter 2025-2026 Chart:
-
February 2026 OBS & Discussion
donsutherland1 replied to Stormlover74's topic in New York City Metro
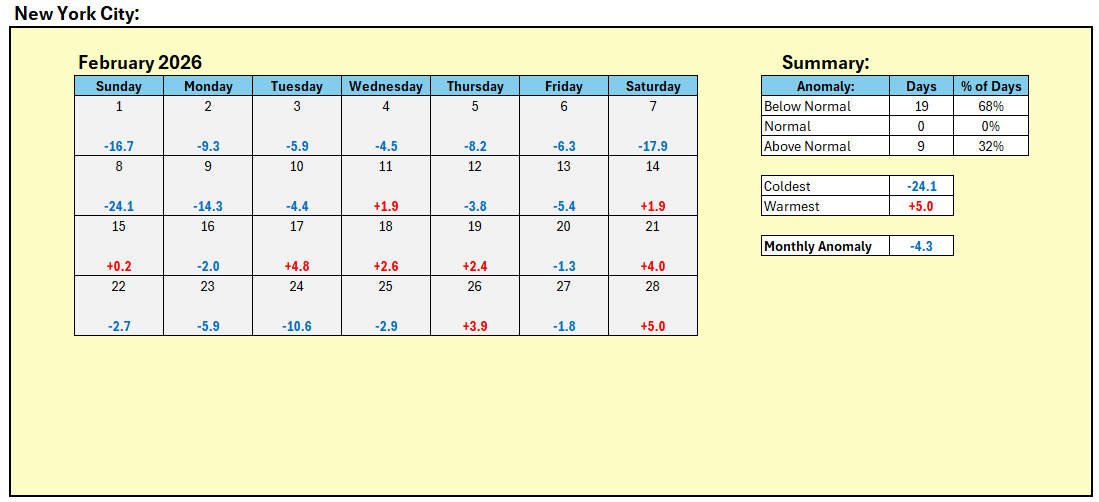
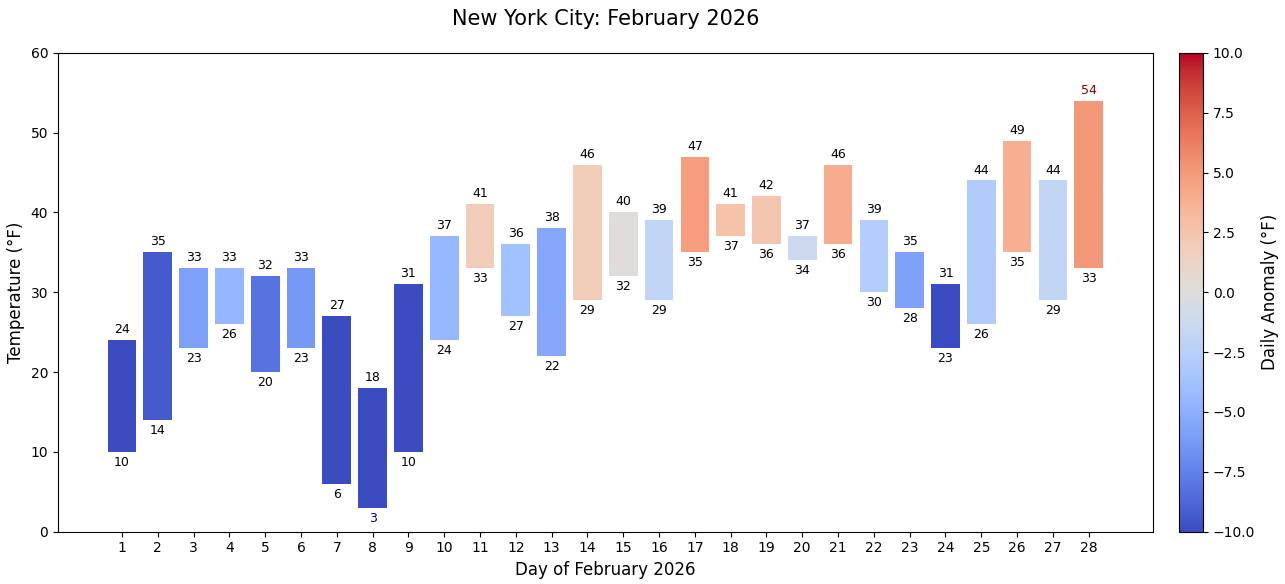
February 2026 in New York City: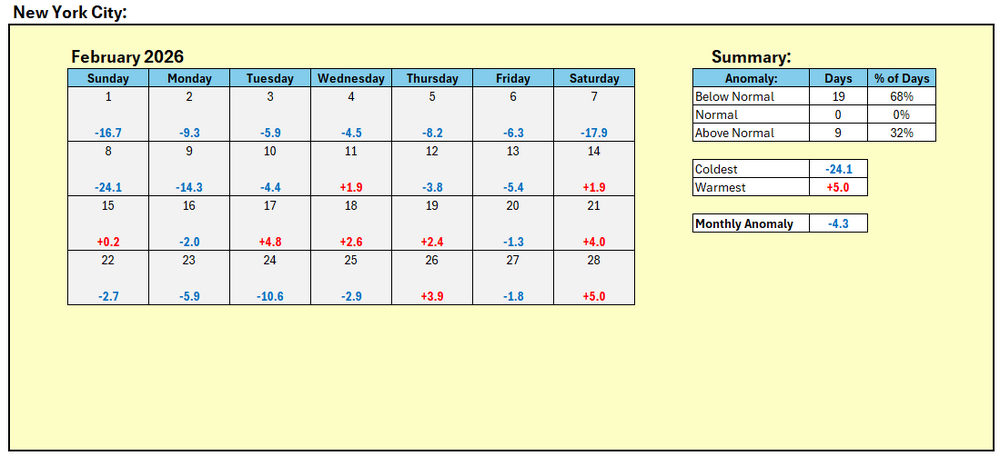

-
February 2026 OBS & Discussion
donsutherland1 replied to Stormlover74's topic in New York City Metro
February 2026 is finishing with a mean temperature of 31.5°, which is 4.4° below normal (1991-2020 baseline). It would also be 3.8° below the 1981-2010 baseline. Winter 2025-2026 is finishing with a seasonal mean temperature of 31.9°. That is the coldest winter mean temperature since Winter 2014-2015 when the mean temperature was 31.7°. Winter 2025-2026 is only the fourth winter of the 21st century with a mean temperature of 32.0° or below. Winter 2025-2026 is just the third winter with two or more 10" snowstorms, a seasonal mean temperature of 32° or below and seasonal snowfall of 40.0" or above. The others are 1960-1961 and 1977-1978. Colder air will return for tomorrow through Tuesday. A light snowfall with coatings in places, especialy north and west of New York City, is possible tomorrow. Monday could see the temperature top out near or even below freezing in New York City after starting in the upper teens. After mid-week, a warming trend will commence. The second week of March could feature springlike readings. Long Island and coastal sections could be noticeably cooler than interior sections on a number of days on account of a chilly onshore flow. The ENSO Region 1+2 anomaly was +1.2°C and the Region 3.4 anomaly was -0.1°C for the week centered around February 11. For the past six weeks, the ENSO Region 1+2 anomaly has averaged +0.37°C and the ENSO Region 3.4 anomaly has averaged -0.32°C. Neutral ENSO conditions have now developed. Neutral ENSO conditions will continue through at least mid-spring. The SOI was +17.10 today. The preliminary Arctic Oscillation (AO) was -0.236 today. -
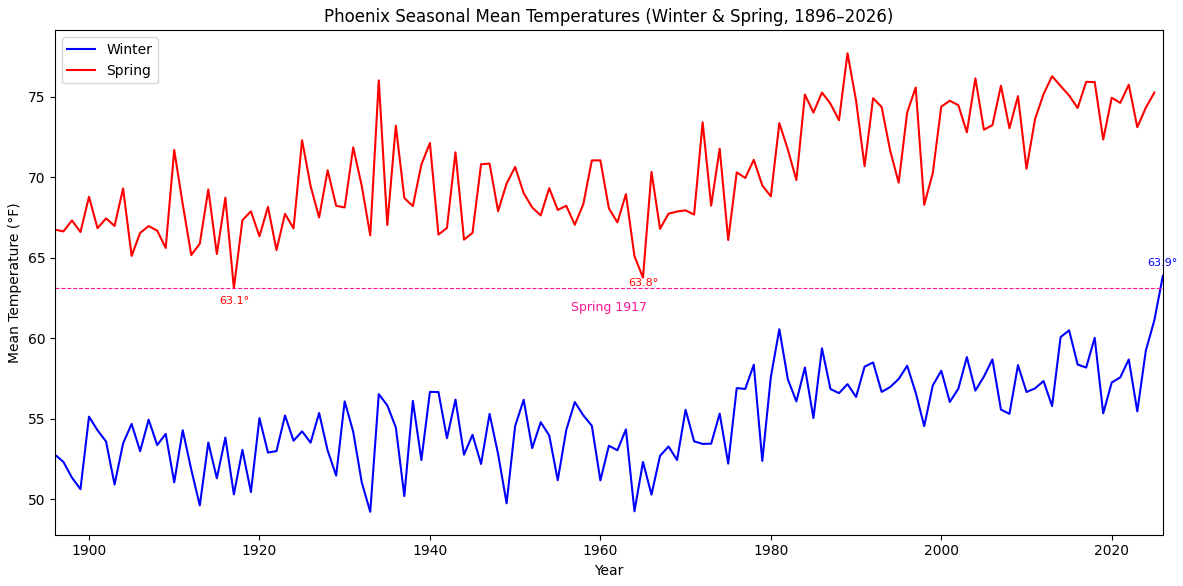
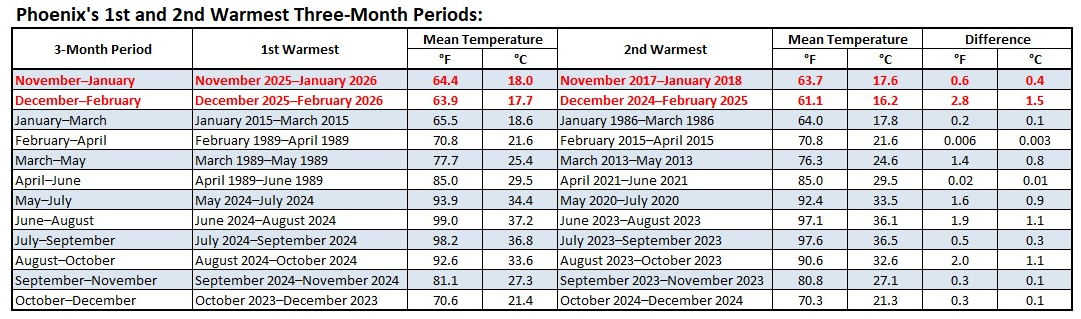
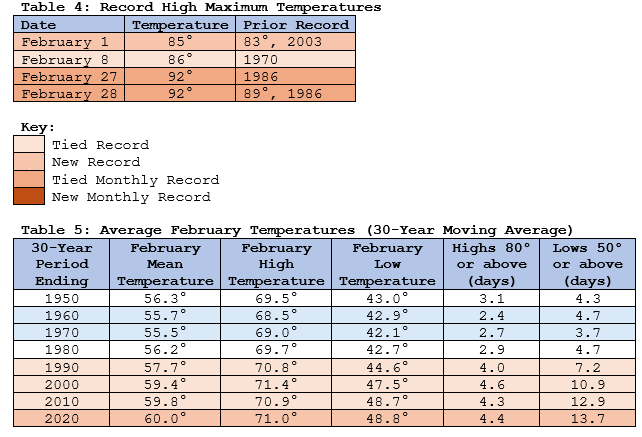
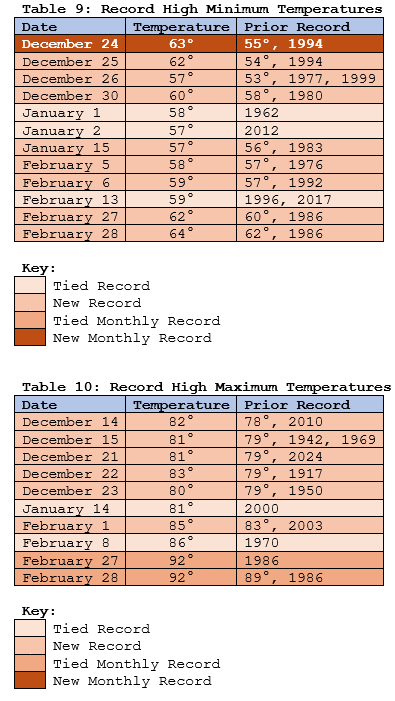
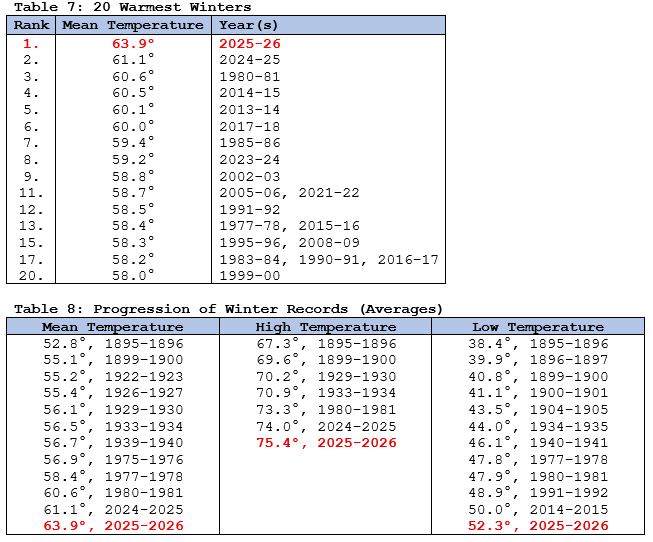
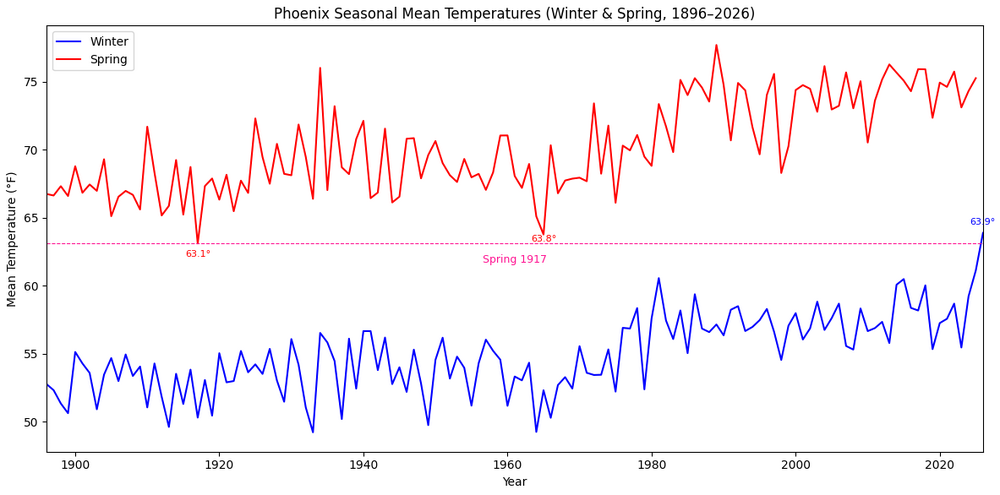
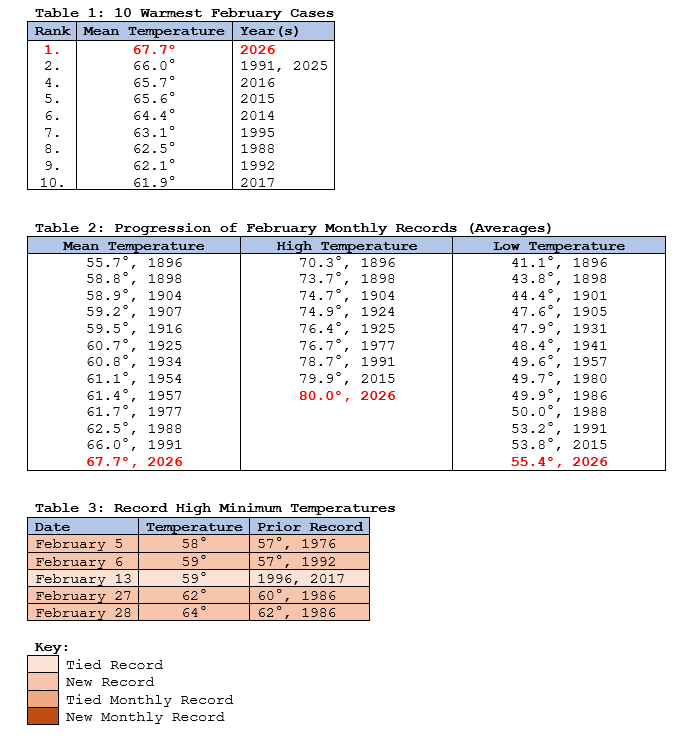
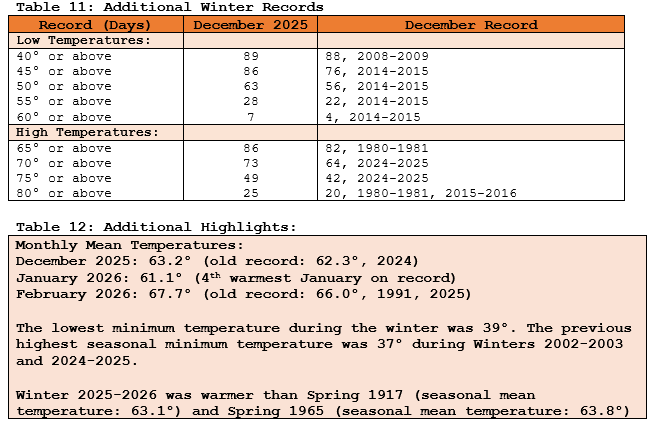
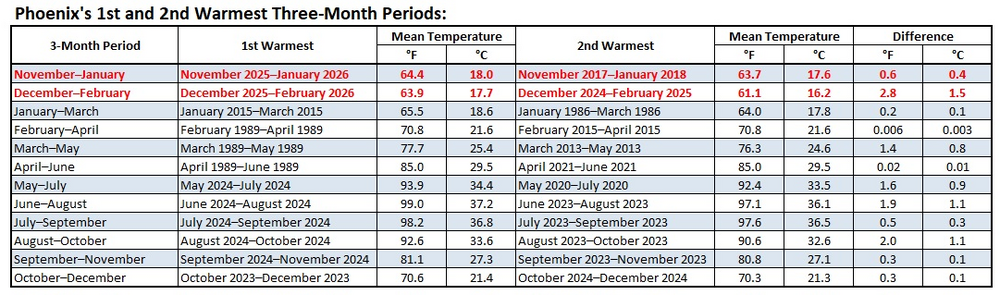
Phoenix experienced its warmest February on record with a monthly mean temperature of 67.7°. That broke the prior record of 66.0°, which was set in 1991 and tied just last year. Powered by the warmest December and February on record, Phoenix experienced its warmest winter on record, by far. Its winter mean temperature of 63.9° was similar to a typical winter in Melbourne, FL. Its seasonal mean temperature also exceeded the figure from March-May 1917. Table 6: Winter and Spring Mean Temperatures: Table 12: Largest Difference between 1st and 2nd Warmest 3-Month Periods: Updates: World Weather Attribution's Flash Analysis of Western North America's March Heatwave Phoenix Experiences Mind-Boggling March Warmth March 2026 vs. April Comparisons
-
2025-2026 ENSO
donsutherland1 replied to 40/70 Benchmark's topic in Weather Forecasting and Discussion
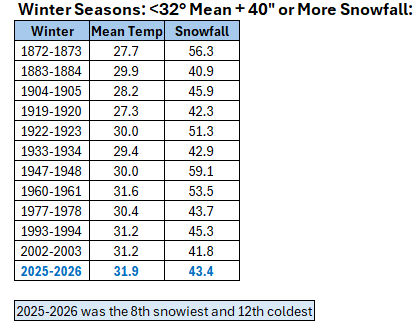
It was an elite winter in the NYC area. Winter season statistics are below: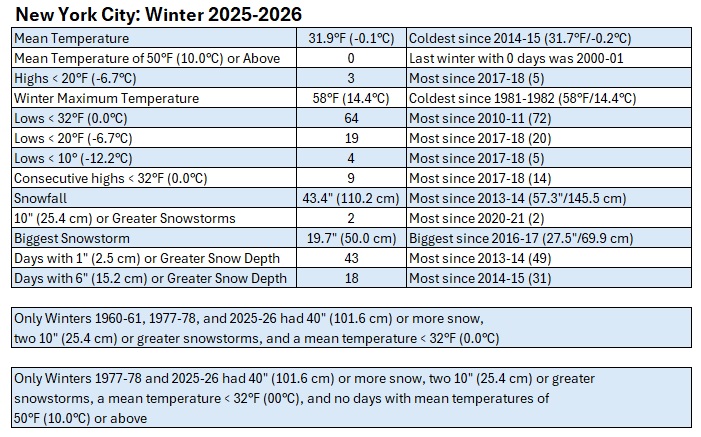
-
He might be referring to March 19, 1992 with 6.2”
-
February 2026 OBS & Discussion
donsutherland1 replied to Stormlover74's topic in New York City Metro
It was a fantastic winter in New York City. I'm not sure why some find the need to make exaggerated claims like the one you cited. Perhaps they know that most in the general public don't have access to the data, are not familiar with the historic record, and/or are not inclined to verify the claims. If one is using only the December 1-February 28 timeframe both winters 1977-78 and 1993-94 were somewhat colder and snowier than winter 2025-26. Here's how Winter 2025-2026 actually stacked up against all past winters (December-February periods):