donsutherland1
-
Posts
24,130 -
Joined
Content Type
Profiles
Blogs
Forums
American Weather
Media Demo
Store
Gallery
Everything posted by donsutherland1
-
2025-2026 ENSO
donsutherland1 replied to 40/70 Benchmark's topic in Weather Forecasting and Discussion
As always. He always calls for a wild end to winter. -
No. The record for Denver is 40.2° during Winter 1933-34.
-
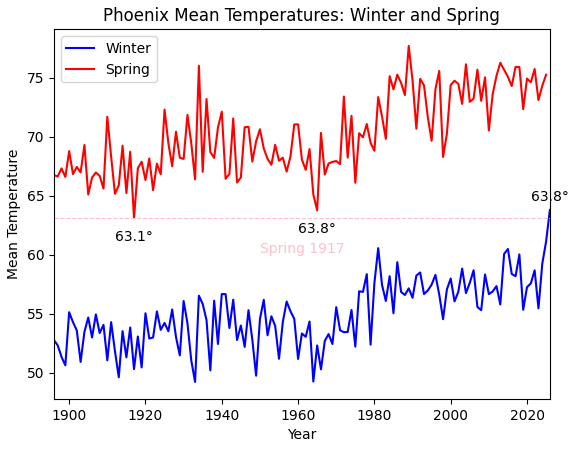
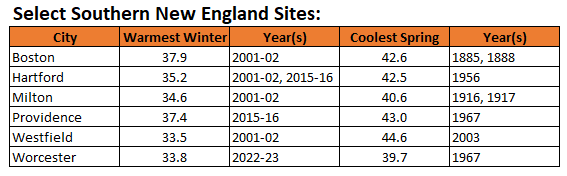
Denver is on track for its second warmest winter on record. Even wilder, Phoenix is demolishing its winter record and Winter 2025-2026 will be warmer than spring 1917 and as warm as spring 1965. Such an outcome would be unthinkable in southern New England:
-
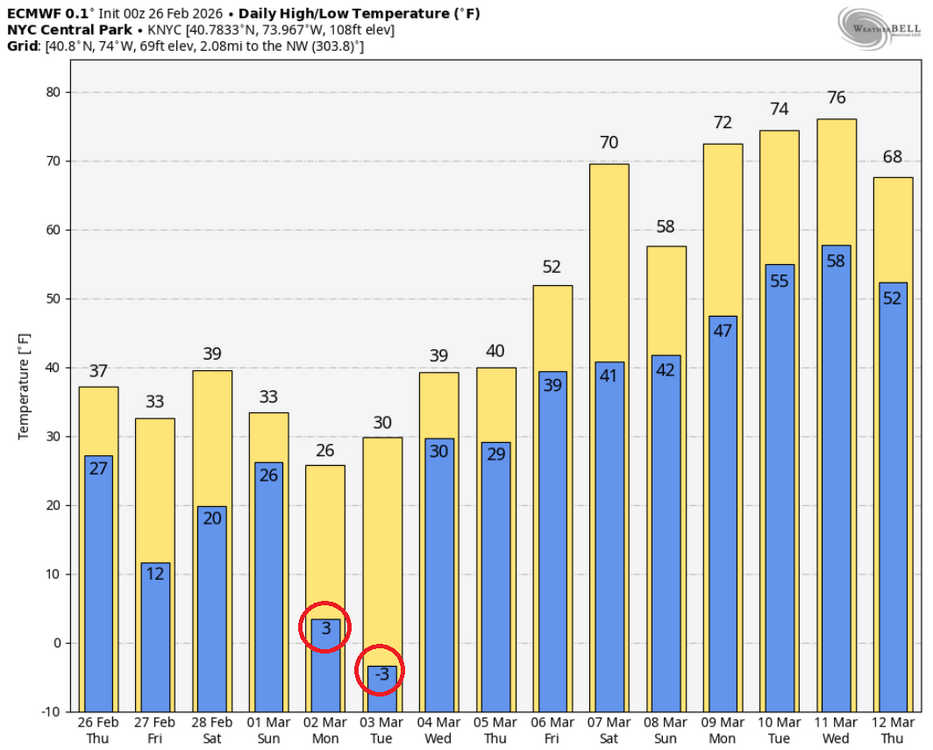
WxBell really needs to fix its algorithm: Almost certainly, Central Park will not be going into the single digits this coming March. Mid- to upper teens will likely be the limit. Central Park's all-time record low temperature for March is 3° from March 5, 1872. Its latest-season -3° or below temperature occurred on February 17, 1896 and the temperature has not fallen to -3° or below since February 15, 1943 (-8°).
-
February 2026 OBS & Discussion
donsutherland1 replied to Stormlover74's topic in New York City Metro
1995-1996. -
February 2026 OBS & Discussion
donsutherland1 replied to Stormlover74's topic in New York City Metro
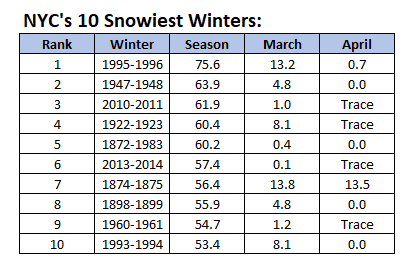
Tomorrow and Friday will see highs in the upper 30s to near 40° in New York City. A system passing to the south of the region could bring a little snow to the region late tomorrow or tomorrow night. It will turn briefly milder on Saturday to start the weekend. The temperature could approach or reach 50°. Winter 2025-2026 will is on track to join Winters 1960-1961 and 1977-1978 as the only winters with two or more 10" snowstorms, a seasonal mean temperature of 32° or below and seasonal snowfall of 40.0" or above. The ENSO Region 1+2 anomaly was +1.2°C and the Region 3.4 anomaly was -0.1°C for the week centered around February 11. For the past six weeks, the ENSO Region 1+2 anomaly has averaged +0.37°C and the ENSO Region 3.4 anomaly has averaged -0.32°C. Neutral ENSO conditions have now developed. Neutral ENSO conditions will continue through at least mid-spring. The SOI was +5.33 today. The preliminary Arctic Oscillation (AO) was -0.296 today. Based on sensitivity analysis applied to the latest guidance, there is an implied near 100% probability that New York City will have a cooler than normal February (1991-2020 normal). February will likely finish with a mean temperature near 31.3° (4.6° below normal). Supplemental Information: The projected mean would be 4.0° below the 1981-2010 normal monthly value. Overall, Winter 2025-2026 is on track for a seasonal mean temperature of 31.9°. If a 32.0° or below seasonal mean temperature occurs, that would be the lowest winter mean temperature since Winter 2014-2015 when the mean temperature was 31.7°. Winter 2025-2026 would only become the fourth winter of the 21st century with a mean temperature of 32.0° or below. -
We almost did it in 2010-11, but that winter fell apart.
-
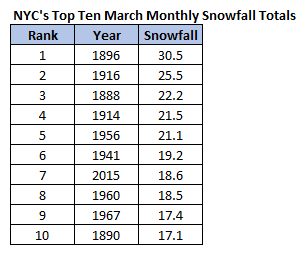
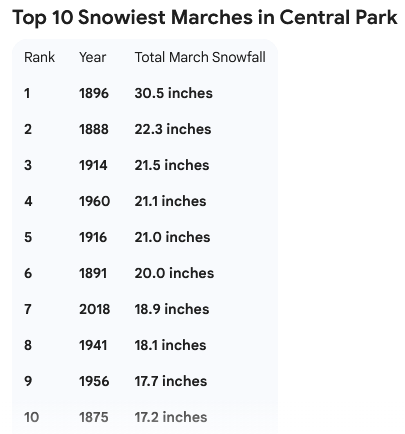
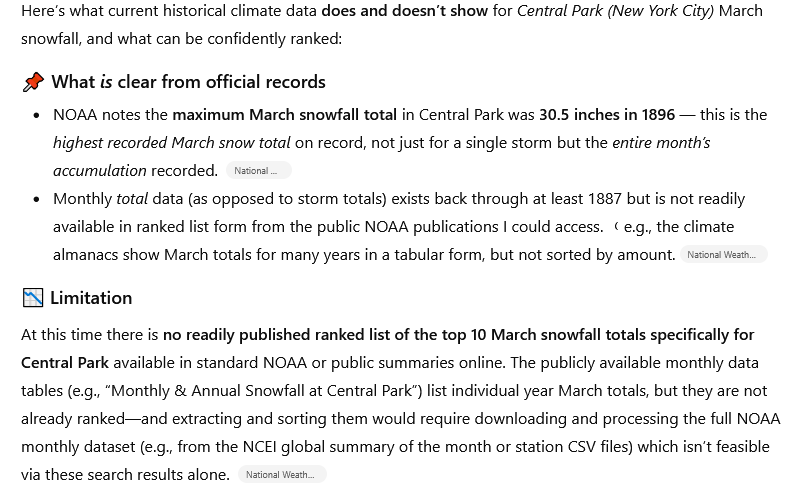
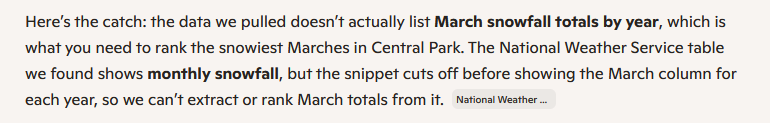
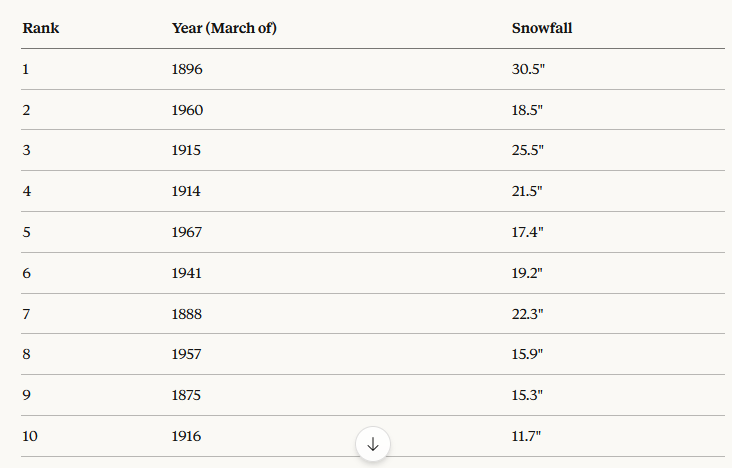
AI still has a long way to go. Hopefully, it will do far better in two years. For purposes of comparison: AI Prompt: For March snowfall, list the 10 snowiest years for central park in ranked order ChatGPT: Claude: Co-Pilot: Gemini:
-
Those figures for March are inaccurate.
-
2/24 - 2/25 Clipper Obs (1 - 2" for many on forum)
donsutherland1 replied to Northof78's topic in New York City Metro
It's 12th through 2/25. -
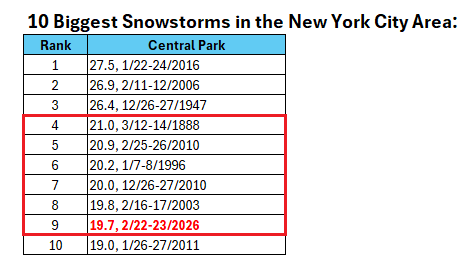
It won't be changed, as the sensor had issues and the 0.15" precipitation that was recorded after the 1 pm observation was attributed to the failed sensor. 1947 ranks as NYC's 3rd biggest snowfall with 26.4". It was exceeded by a 26.9" snowfall in 2006 and 27.5" snowfall in 2016.
-
2/24 - 2/25 Clipper Obs (1 - 2" for many on forum)
donsutherland1 replied to Northof78's topic in New York City Metro
With today's 1.4" (3.6 cm) snowfall, New York City (Central Park's) season total snowfall has reached 43.4" (110.2 cm). That makes Winter 2025-2026 the 30th snowiest winter on record. Records go back to 1869. -
February 2026 OBS & Discussion
donsutherland1 replied to Stormlover74's topic in New York City Metro
Moderate to heavy snow in Larchmont.
-
February 2026 OBS & Discussion
donsutherland1 replied to Stormlover74's topic in New York City Metro
Some light snow in the Larchmont-Mamaroneck, NY area:
-
Thank you for this update.
-
Yes. It seems to be off.
-
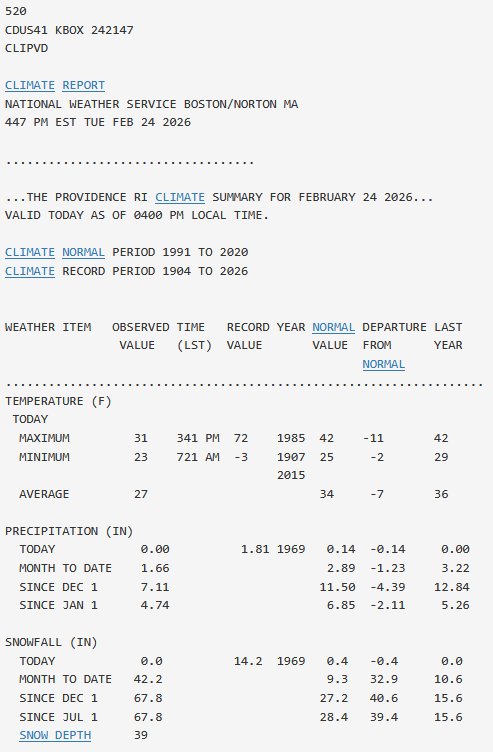
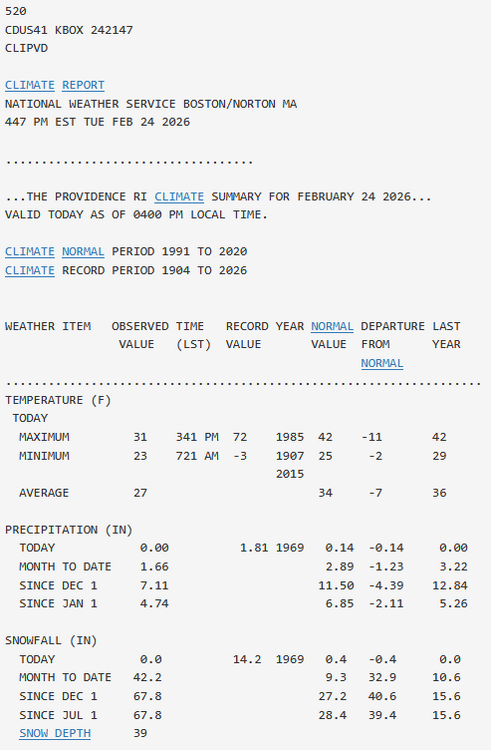
It demolished the old record of 30" from February 5, 1961. Here's the daily climate report, which has now been posted:
-
"Don’t do it" 2026 Blizzard obs, updates and pictures.
donsutherland1 replied to Ginx snewx's topic in New England
Here it is: https://www.weather.gov/box/products# Scroll down to RERPVD and click on "Tue, Feb 24, 2026 01:35 AM" -
"Don’t do it" 2026 Blizzard obs, updates and pictures.
donsutherland1 replied to Ginx snewx's topic in New England
412 SXUS71 KBOX 240635 RERPVD RECORD EVENT REPORT NATIONAL WEATHER SERVICE BOSTON/NORTON MA 0131 AM EST TUE FEB 24 2026 ...RECORD SNOWSTORM FOR PROVIDENCE RI... THE BLIZZARD OF 2026 BROKE SEVERAL SNOWFALL RECORDS AT RHODE ISLAND T.F. GREEN INTERNATIONAL AIRPORT IN PROVIDENCE: - STORM TOTAL SNOWFALL OF 37.9 INCHES BROKE THE RECORD FOR THE GREATEST SINGLE SNOWSTORM ON RECORD, WHICH WAS 28.6 INCHES SET DURING THE BLIZZARD OF '78, ON FEBRUARY 6-7, 1978. - DAILY SNOWFALL OF 35.5 INCHES BROKE THE RECORD ONE-DAY SNOWFALL, WHICH WAS 19.0 INCHES SET DURING THE BLIZZARD OF '96, ON JANUARY 8, 1996. - FINALLY, THE DAILY SNOWFALL OF 35.5 INCHES BROKE THE RECORD SNOWFALL FOR FEBRUARY 23, WHICH WAS JUST 3.8 INCHES IN 1967. $$ -
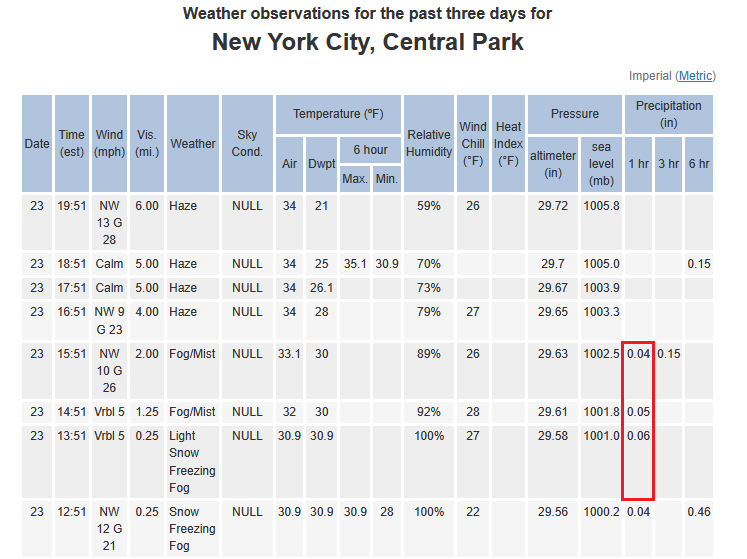
The question concerns whether Central Park measured when the snow stopped falling or measured at 7 pm when a possible small amount of snow had melted due to the temperature's rising above freezing for several hours. According to OKX's 2 pm PNS, Central Park reported 19.7" at 1 pm. There were several hours of additional measurable precipitation: Although the amount of additional snowfall (probably a few tenths of an inch to just over an inch was relatively small, it would be large in terms of storm ranking implications:
-
February 2026 OBS & Discussion
donsutherland1 replied to Stormlover74's topic in New York City Metro
Tomorrow will be somewhat milder with some early snow showers. Parts of the region could see a fresh coating of snow. A period of rain or wet snow is possible late Thursday and Thursday night as a system passes to the south of the region. Friday will be a bit colder before it turns milder on Saturday to start the weekend. Winter 2025-2026 will is on track to join Winters 1960-1961 and 1977-1978 as the only winters with two or more 10" snowstorms, a seasonal mean temperature of 32° or below and seasonal snowfall of 40.0" or above. The ENSO Region 1+2 anomaly was +1.2°C and the Region 3.4 anomaly was -0.1°C for the week centered around February 11. For the past six weeks, the ENSO Region 1+2 anomaly has averaged +0.37°C and the ENSO Region 3.4 anomaly has averaged -0.32°C. Neutral ENSO conditions have now developed. Neutral ENSO conditions will continue through at least mid-spring. The SOI was +7.16 today. The preliminary Arctic Oscillation (AO) was +0.202 today. Based on sensitivity analysis applied to the latest guidance, there is an implied near 100% probability that New York City will have a cooler than normal February (1991-2020 normal). February will likely finish with a mean temperature near 31.3° (4.6° below normal). Supplemental Information: The projected mean would be 4.0° below the 1981-2010 normal monthly value. Overall, Winter 2025-2026 is on track for a seasonal mean temperature of 31.9°. If a 32.0° or below seasonal mean temperature occurs, that would be the lowest winter mean temperature since Winter 2014-2015 when the mean temperature was 31.7°. Winter 2025-2026 would only become the fourth winter of the 21st century with a mean temperature of 32.0° or below. -
Thanks. I will do so. Usually, it takes a few days.
-
Wasn’t the final amount 17.1”?
-
The 21" figure is from 7 am yesterday. This morning's 7 am figure was 39".
-
February 2026 OBS & Discussion
donsutherland1 replied to Stormlover74's topic in New York City Metro
It would rank as the 15th warmest November on record.