donsutherland1
-
Posts
24,134 -
Joined
Content Type
Profiles
Blogs
Forums
American Weather
Media Demo
Store
Gallery
Everything posted by donsutherland1
-
I will have to see if hourly data is available.
-
I was at the dry cleaner's this morning and the owner said that the TV meteorologists have "no clue." He said they only get it right when its sunny. I do agree that they often do a very poor job communicating risk. Even before things rapidly evolved yesterday, the event was an example of a low probability, high impact risk that should have been conveyed, as it had some support.
-
The low temperatures were: EWR: 24 ISP: 27 JFK: 26 LGA: 26 NYC: 26
-
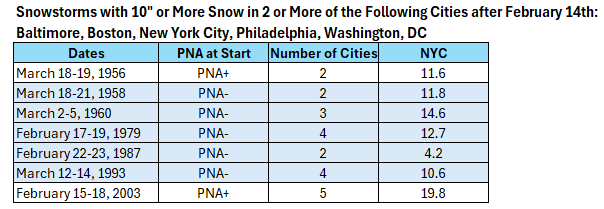
On February 20, 2026, the PNA was -1.475. The PNA is forecast to remain negative through the remainder of February. During the second half of February and afterward, most of the big I-95 Area snowstorms occur with a negative PNA on account of shortening wave lengths. A major to potentially historic blizzard is possible Sunday into Monday. With 10.0" or more snow, Winter 2025-2026 would be on track to become just the third winter on record in New York City to record two 10" or greater snowstorms, a seasonal mean temperature of 32.0° or below and 30.0" or more seasonal snowfall. Winter records go way back to 1869-1870.
-
Welcome back, Allsnow.
-
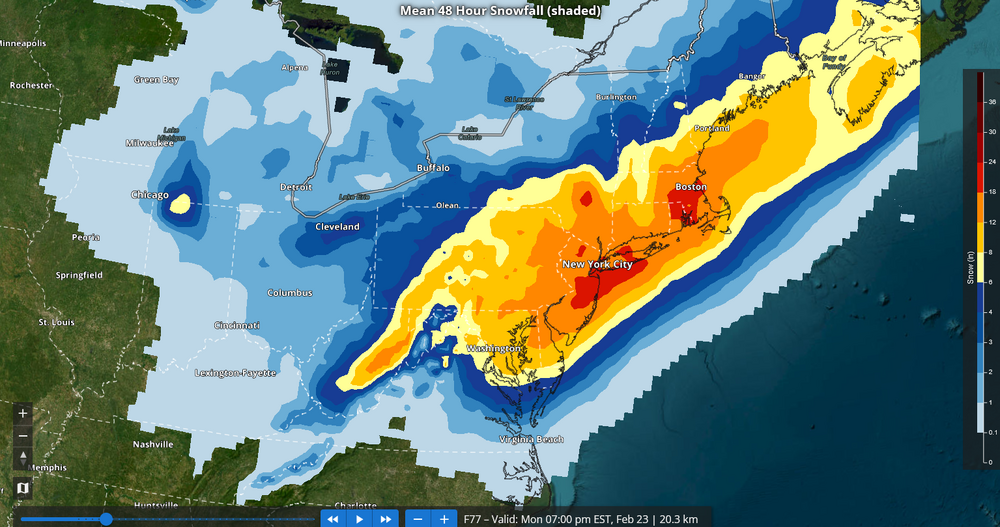
NBM:
-
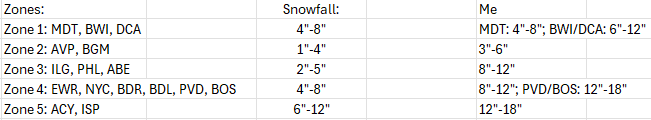
It seems that whomever made the map lost sight of the bigger picture in his/her obsession with the minor IVT. The map will be verified for major cities in each of the zones. I've listed them below and also included my initial estimates for comparison.
-
Full snow season: July 1-June 30.
-
Here's the list:
-
February 2026 OBS & Discussion
donsutherland1 replied to Stormlover74's topic in New York City Metro
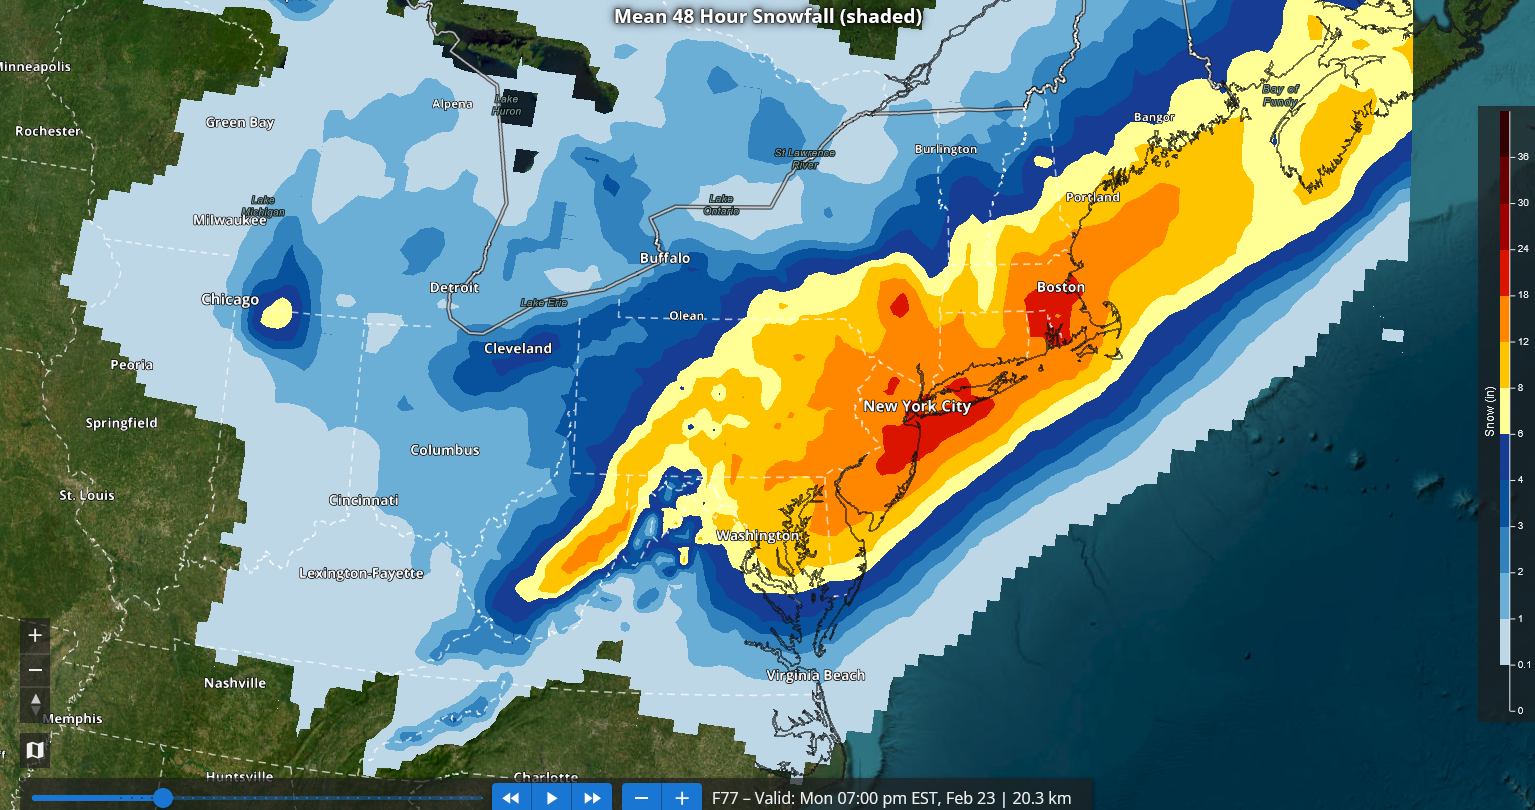
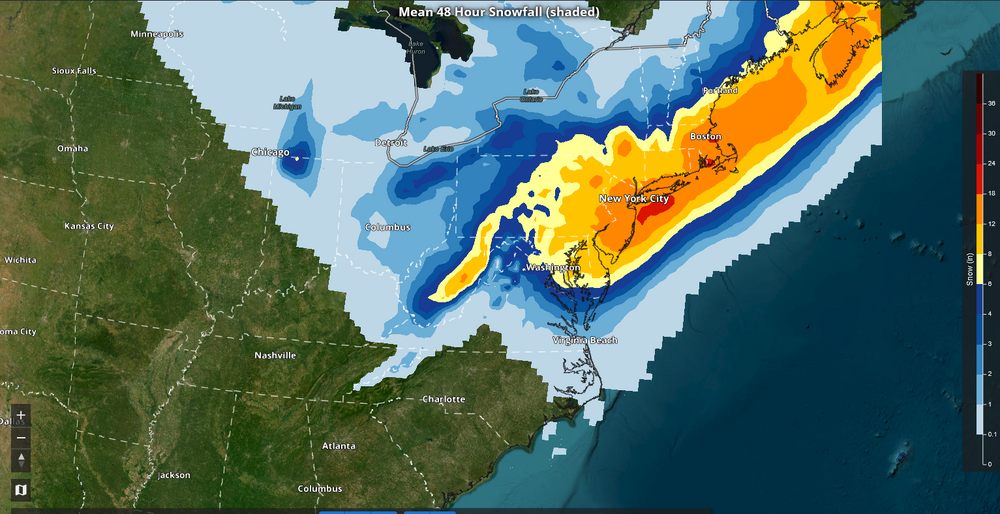
Any showers will depart early tomorrow. Highs will likely reach the lower and middle 40s afterward. Another storm will likely bring snow to the region Sunday into Monday. The potential exists for a major snowfall. At present, a 8"-12" snowfall appears likely in New York City and its nearby suburbs. Somewhat lesser amounts are likely north and west of New York City. A 12"-18" snowfall is possible across southern and central New Jersey and part of Long Island. Near blizzard and blizzard conditions are possible at the height of the storm late Sunday night into Monday morning. This is a dynamic event and large revisions may still be possible. The ENSO Region 1+2 anomaly was +0.7°C and the Region 3.4 anomaly was -0.2°C for the week centered around February 11. For the past six weeks, the ENSO Region 1+2 anomaly has averaged -0.03°C and the ENSO Region 3.4 anomaly has averaged -0.47°C. Neutral ENSO conditions are now developing. Neutral ENSO conditions will develop during the close of winter. The SOI was -2.11 today. The preliminary Arctic Oscillation (AO) was -0.386 today. Based on sensitivity analysis applied to the latest guidance, there is an implied near 100% probability that New York City will have a cooler than normal February (1991-2020 normal). February will likely finish with a mean temperature near 31.8° (4.1° below normal). Supplemental Information: The projected mean would be 3.5 below the 1981-2010 normal monthly value. Overall, Winter 2025-2026 is on track for a seasonal mean temperature of 32.0°, but the forecast development of an AO+ regime could lead to a sufficiently mild outcome to result in a winter mean temperature that exceeds freezing. If a 32.0° or below seasonal mean temperature occurs, that would be the lowest winter mean temperature since Winter 2014-2015 when the mean temperature was 31.7°. Winter 2025-2026 would only become the fourth winter of the 21st century with a mean temperature of 32.0° or below. -
Don't forget the back to back 50" winters (2013-14 and 2014-15).
-
If, for example, NYC gets to 30" and its winter mean temperature is 32° or below, it was a great winter in objective terms. The only such winters that met such criteria since 1960 are 1960-61, 1977-78, 1993-94, 2002-03, and 2014-15.
-
This is why one should use probabilistic descriptions, particularly in the medium-range. Making deterministic "yes-no" declarations assumes that the general public is not capable of understanding complexity. That assumption says more about those who make it than the general public. I provided an example in recent days where I referred to the high-end solution being a low probability, high-impact scenario rather than dismissing it out-of-hand. 4-5 days out allows for a lot of change.
-
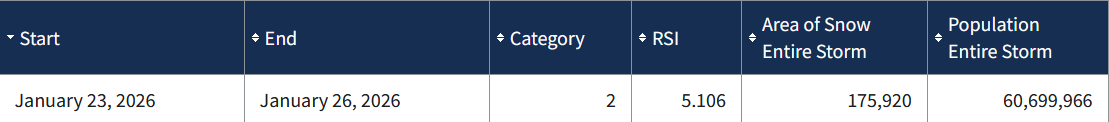
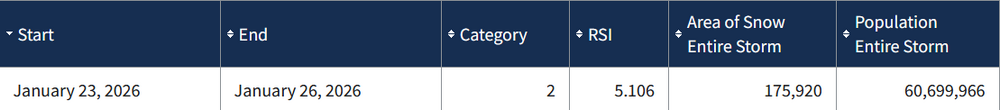
The preliminary RSI value for the Northeast was Category 2.
-
I agree. I'm thinking 8"-12" for NYC and nearby areas with higher amounts on parts of Long Island, central and southern NJ.
-
That's the national blend of models.
-
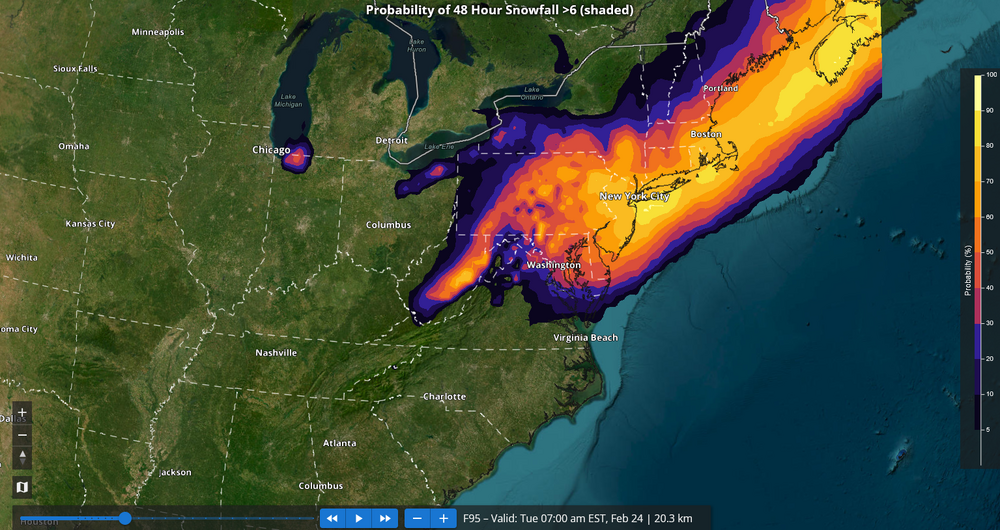
Most of the New York City, NJ, and Long Island region has > 70% probability of seeing 6" or more snow. The spread remains large. The overall NBM forecast:
-
In my school district in Westchester, 3 snow days are built into the schedule. If they aren't used, the school year ends a bit earlier. We still meet the 180-day state requirement. Post-Covid, there was some discussion about going the route New York City chose. But the conclusion was that students would be distracted/not motivated, so remote learning would not necessarily be beneficial from a learning standpoint.
-
New York City switches to remote learning.
-
Watches are usually issued 48 hours in advance (sometimes 72 hours if confidence is high); warnings are issued when an event is ongoing or imminent (usually 24 hours or less from the event).
-
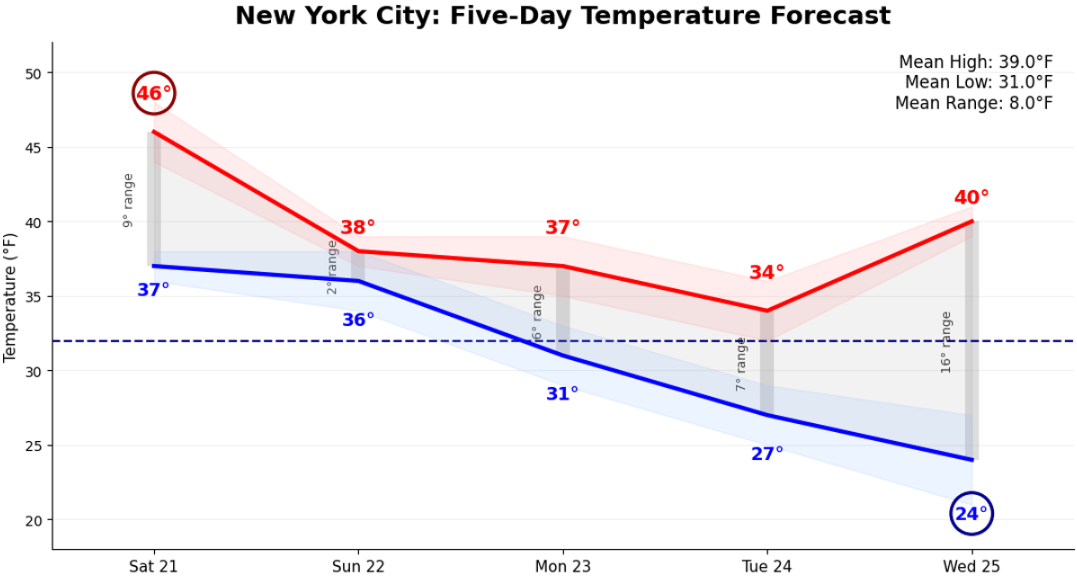
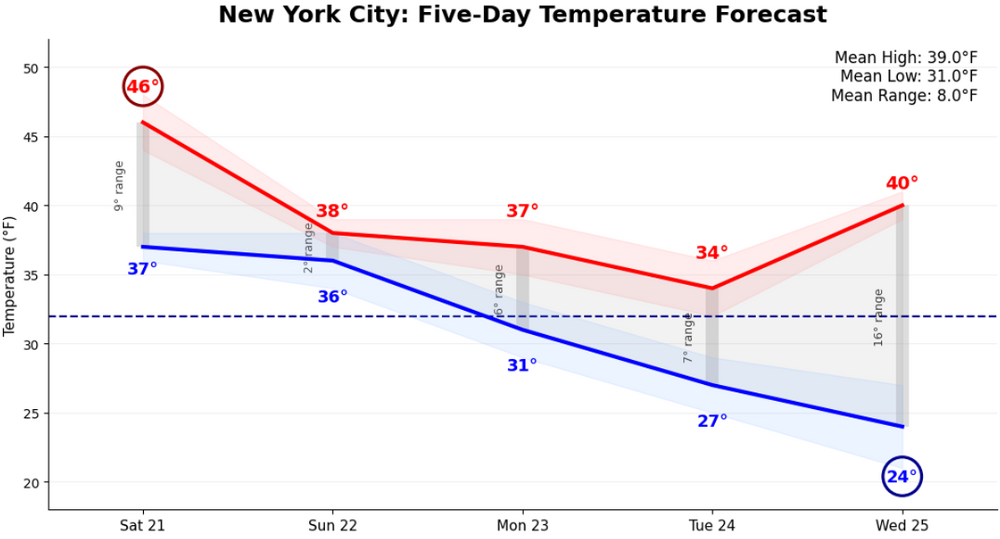
Although the 15z NBM shows highs of 38° on Sunday and 37° on Monday, I suspect that the temperature will be near or just below freezing during the height of the storm. The 38° high on Sunday will occur before the onset of the storm. The 37° high on Monday will likely occur late in the day after the snow has moved away. Based on the standard deviation band, a reading in the upper 20s cannot be ruled out. We'll have to see where things are in the soundings for ratios, but this doesn't look like a low snow-liquid ratio event.
-
How did you get it to assimilate your hopes and dreams into its forecast? On a more serious note, it looks terrific. The evolution of the guidance overnight and into 12z so far has been very encouraging.
-
The problem with his hypothesis is that a number of models have trended toward the GFS solution, even if the 6z GFS proves to have been overdone. At shortening lead times and the shift in the guidance, it's difficult to argue that an increasing number of models are misinterpreting an IVT. Far more likely, the shift in the guidance suggests that his hypothesis concerning the GFS is incorrect, even if the GFS returns to its earlier solutions.
-
Yes. That's correct. The snow could be falling or blowing.
-
Yes, but the temperature criterion was eliminated.