donsutherland1
-
Posts
24,176 -
Joined
Content Type
Profiles
Blogs
Forums
American Weather
Media Demo
Store
Gallery
Everything posted by donsutherland1
-
February 2026 OBS & Discussion
donsutherland1 replied to Stormlover74's topic in New York City Metro
A weak system will pass south of New York City tonight into early tomorrow. The temperature will likely remain near or above freezing during most of the event. Assuming a snow-liquid ratio of about 6:1 to 7:1 based on past cases with < 0.20" precipitation and lows of 31°-33° with a storm total 0.10"-0.15" QPF, New York City and nearby suburbs will likely see a coating to 1" of snow (probably 0.5”-1.0” in Central Park). A realistic high-case figure for New York City is 1.5". A few places across central New Jersey and Long Island could pick up 1"-3" of snow. Most amounts will be 2" or less in those areas. Following the light snowfall, the clouds will break and the temperature will top out in the lower 40s in New York City. Tuesday will also see highs reach the middle 40s. A warm front will cross the region on Wednesday with some rain showers or a period of rain but its progress could slow or stall. Additional precipitation could arrive Friday or Saturday. Highs will likely reach the 40s through Saturday. The ENSO Region 1+2 anomaly was +0.3°C and the Region 3.4 anomaly was -0.5°C for the week centered around February 4. For the past six weeks, the ENSO Region 1+2 anomaly has averaged -0.25°C and the ENSO Region 3.4 anomaly has averaged -0.52°C. La Niña conditions will likely continue into at least late winter. The SOI was +15.37 today. The preliminary Arctic Oscillation (AO) was +1.188 today. Based on sensitivity analysis applied to the latest guidance, there is an implied near 97% probability that New York City will have a cooler than normal February (1991-2020 normal). February will likely finish with a mean temperature near 31.4° (4.5° below normal). Supplemental Information: The projected mean would be 3.9° below the 1981-2010 normal monthly value. Overall, Winter 2025-2026 is on track for a seasonal mean temperature of 31.9°. That would be the lowest winter mean temperature since Winter 2014-2015 when the mean temperature was 31.7°. Winter 2025-2026 would only become the fourth winter of the 21st century with a mean temperature of 32.0° or below. -
Crop sizes being "hard to separate out" is his defense for setting aside the latest scientific research demonstrating a clear link with temperature. The statistical basis is sound.
-
February 2026 OBS & Discussion
donsutherland1 replied to Stormlover74's topic in New York City Metro
Considering the high amount of down time, perhaps there should be discussion about whether to replace rather than repair the radar. Downtime has been a recurrent theme since at least last summer. -
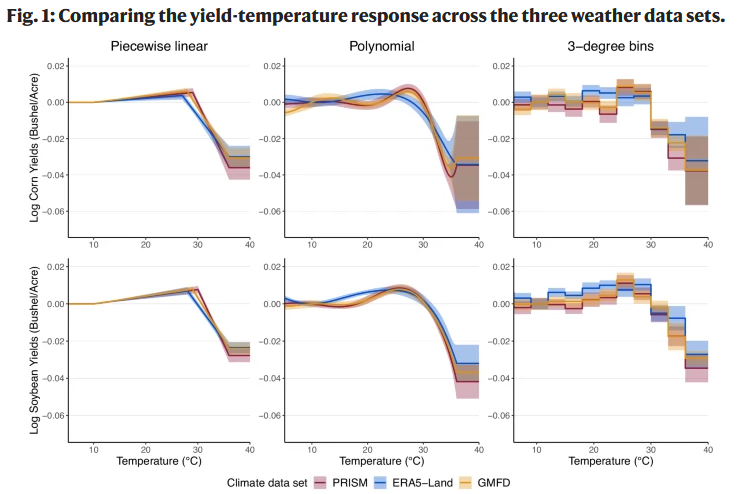
Here are two big problems with his arguments: He writes: Regarding all the articles from so called authorities that climate change is already cutting back on food production: 100% nonsense. It's the exact opposite. With crops, we can't tell how much impact is from CO2, climate/weather, genetics, fertilizers, use of pesticides/herbicides(technology). When you change numerous variables at the same time, like we do with crops, it's impossible to separate the impact from each one on the outcome. Flaw: He claims that "it's impossible to separate the impact" from CO2, climate/weather, genetics, etc. Yet, he also claims that the idea that climate change is "100% nonsense." That's inherently inconsistent logic. He also states: ...we have 2 ways to address that with OBJECTIVE data which clearly speaks for the impact of photosynthesis by itself and for photosynthesis +climate change. 1. The impact of JUST adding CO2 and not changing anything else... 2. But other human factors impact soybeans, including climate change that we can't separate out. Flaw: He oversimplifies things by ignoring the variable of temperature. Omitting temperature provides him the solution he seeks. However, cherry picking in pursuit of confirming one's biases is not a valid scientific approach. Recent research provides a clear link between temperature and crop yields. For example, a May 31, 2024 paper in Nature Communications found: All specifications and weather data uncover an asymmetric relationship for the US where yields are increasing in temperature for moderate temperature ranges, but sharply decrease in temperature at the upper end.
-
2025-2026 ENSO
donsutherland1 replied to 40/70 Benchmark's topic in Weather Forecasting and Discussion
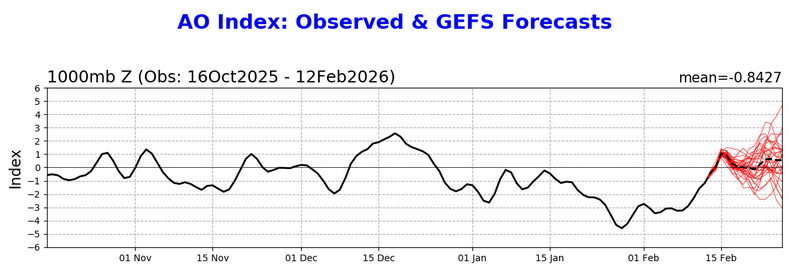
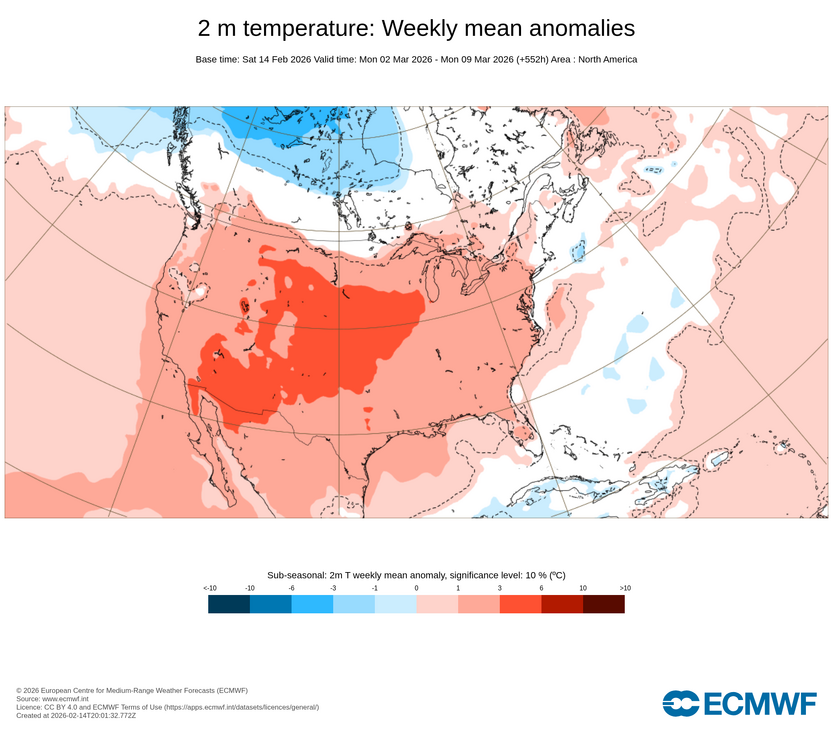
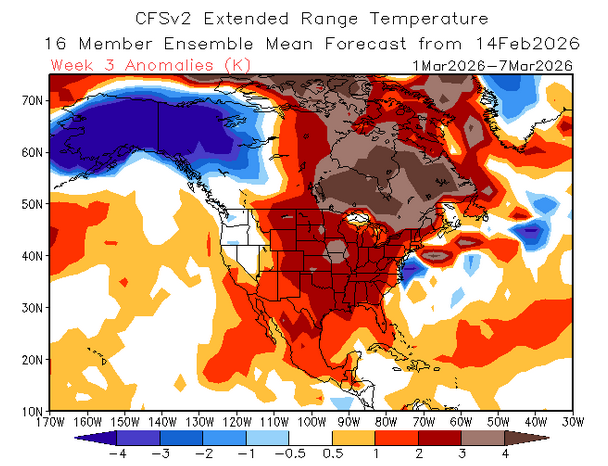
As previously noted regarding the February 15-28 period, what was fairly certain were: 1) Substantial warmup in the Plains States. 2) Brief cool shot to the Southwest and then a return of warmer conditions. The cool shot likely won't be sufficient to preclude Phoenix from experiencing its warmest winter on record. The period has commenced with widespread above to much above normal readings in the Plains States. Phoenix is virtually certain to experience its warmest winter on record. Only one case saw in its period of record (1896-2025) saw a sufficiently cold February 15-28 that would miss the record. Nothing remotely close to that case is on the latest guidance. It was also noted that the Arctic Oscillation (AO) could hold the key to the overall outcome. The EPS and GEFS agree on the development of a WPO-, EPO+, PNA- pattern. During such patterns, conditions in the East tend to be much colder when the AO is negative than when it is positive. The latest AO forecast shows the AO returning to positive levels after a fairly short-lived dip to negative levels. The most recent ECMWF weeklies show a brief return to cooler conditions in parts of the East during February 23-March 2, but a return to above normal temperatures afterward unlike prior runs. The weeklies also show most of the CONUS experiencing above normal temperatures to start March. ECMWF Weeklies: The CFSv2, which was been showing above normal temperatures on a consistent basis, shows a warmer than normal first week of March. It's too soon to pronounce the end of Winter 2025-2026. There may yet be cold periods and snowfall, though the most severe cold is almost certainly behind us. But even if this latest guidance were to mark the end, many parts of the Northeast and Great Lakes Region had highlights that made this winter memorable, particularly sustained cold not seen for a decade or longer, long-lived snow cover, and from Philadelphia to Boston, a big snowstorm.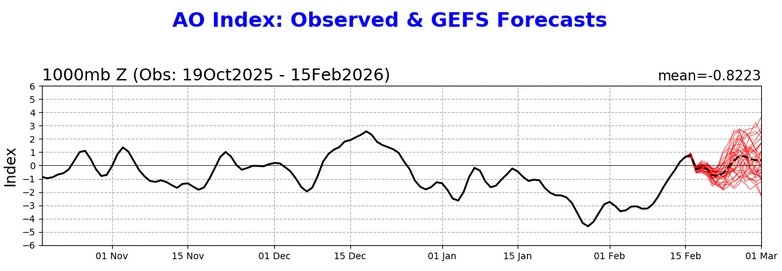
-
2026-2027 Super El Nino
donsutherland1 replied to Stormchaserchuck1's topic in Weather Forecasting and Discussion
CANSIPS's limitations notwithstanding, ENSO forecasting skill at this lead time is low, especially when it comes to ENSO region details. If some of the ENSO guidance is correct, an El Niño could develop during the summer. That might inhibit tropical cyclone activity during the peak of hurricane season. Given ENSO forecasting challenges at the current lead time, a shortened/below normal Atlantic tropical cyclone season is a possible scenario but not yet assured. It does seem that this scenario is probably somewhat more likely than a highly active season. MJO forecasting skill is limited beyond 7-10 days due to its chaotic and convective nature. Speculation about predominant MJO phases next winter is nothing more than a wild guess. There is no skill whatsoever. Further, geothermal activity has no impact on ocean-atmosphere coupling and the synoptic patterns that result from such coupling. In sum, his idea of a cold Winter 2026-2027, which can't be made skillfully at the present lead time, is based on speculative propositions (the predominant MJO state more than three seasons in advance and geothermal, which has no linkage to weather/climate). This does not mean that there can't be a cold winter, but the nature of next winter cannot be forecast with any skill right now. -
February 2026 OBS & Discussion
donsutherland1 replied to Stormlover74's topic in New York City Metro
You raise important questions. The shift in the predominant storm tracks that you observed may be the result of an ongoing structural shift in storm tracks rather than periodic cycles. Many factors are involved, including cyclical ones, but there is at least some evidence that Arctic amplification is contributing. https://journals.ametsoc.org/view/journals/clim/30/10/jcli-d-16-0650.1.xml I still suspect that by the mid-2030s, we'll have a lot more answers related to regional snowfall, etc. -
February 2026 OBS & Discussion
donsutherland1 replied to Stormlover74's topic in New York City Metro
Parts of the region saw a dusting of snow overnight. The remainder of the day was mild with the temperature reaching the lower and middle 40s. Tomorrow will be a bit cooler with highs in the upper 30s. A storm tracking to the south could bring some snowfall to the region tomorrow night into Monday. The steadiest precipitation should pass to the south of New York City. Nevertheless, a 1"-2" snowfall appears likely in and around New York City. Lesser amounts are likely north and west of the City. Parts of central New Jersey and Long Island could see somewhat higher amounts. There remains a risk of lower amounts from New York City northward, as the City will be affected by the northern edge of a fairly weak system. Following the light snowfall, the remainder of Monday will see highs in the upper 30s and lower 40s. It will then turn milder for the remainder of the week into the beginning of next weekend. Highs will mainly be in the middle 40s. One or two days with highs in the upper 40s to near 50° are possible. The ENSO Region 1+2 anomaly was +0.3°C and the Region 3.4 anomaly was -0.5°C for the week centered around February 4. For the past six weeks, the ENSO Region 1+2 anomaly has averaged -0.25°C and the ENSO Region 3.4 anomaly has averaged -0.52°C. La Niña conditions will likely continue into at least late winter. The SOI was +20.94 today. The preliminary Arctic Oscillation (AO) was +0.006 today. Based on sensitivity analysis applied to the latest guidance, there is an implied near 95% probability that New York City will have a cooler than normal February (1991-2020 normal). February will likely finish with a mean temperature near 31.5° (4.4° below normal). Supplemental Information: The projected mean would be 3.8° below the 1981-2010 normal monthly value. Overall, Winter 2025-2026 is on track for a seasonal mean temperature of 31.9°. That would be the lowest winter mean temperature since Winter 2014-2015 when the mean temperature was 31.7°. Winter 2025-2026 would only become the fourth winter of the 21st century with a mean temperature of 32.0° or below. -
Presidents' day Snow potential
donsutherland1 replied to WeatherGeek2025's topic in New York City Metro
Notice that the social media influencer posted a single water vapor map. That makes it difficult for readers to verify the accuracy of the claims being made. There is no reference point for comparison. Therefore, no structural validation is possible. But that's life on social media today where anyone can slap "wx" into their handle and then forecast. In fact, based on the 6z, 12z, and 18z cycles, the opposite has been true through the course of much of today. That's why the models have pulled back somewhat on the northern extent of the QPF and track of the relatively weak system. It will likely remain weak, as the environment is not conducive to phasing, as has been a recurrent theme over several days of 500 mb vorticity maps. The NAM, Icon, and GFS have all pulled back, with the NAM and Icon continuing their evolution through the 18z cycle. The 18z GFS has yet to initialize. With the 12z GFS having been above the consensus and the ongoing evolution of the synoptic environment, I wouldn't be surprised if its forecast is trimmed at 18z, though that's not guaranteed. Overall, taking into consideration the guidance, inter-cycle shifts in the guidance, and EPS individual members, a 1"-2" snowfall still seems reasonable for the NYC area and immediate suburbs. A strip of somewhat higher amounts could cut across central NJ and parts of Long Island. Overnight into tomorrow, I suspect that the guidance will begin to consolidate at a consensus. -
February 2026 OBS & Discussion
donsutherland1 replied to Stormlover74's topic in New York City Metro
I respect your precision. I used "explains" in a statistically descriptive sense, not to talk about causation. I could have used more technical language talking about measuring the predictable variation (via linear relationship in this case) between the independent and dependent variable(s). Keeping in mind that the Board has an audience, some of whom have yet to enter college, such terminology would create more confusion than clarity. Unfortunately, there are trade-offs involved in simplifying discussions. -
February 2026 OBS & Discussion
donsutherland1 replied to Stormlover74's topic in New York City Metro
Here you go: Winter State College Williamsport 1892-93 48.3 N.A. 1893-94 66.4 N.A. 1894-95 54.5 15.3 1895-96 33.7 31.5 1896-97 31.6 26.0 1897-98 40.2 30.8 1898-99 53.5 41.8 1899-00 27.0 15.9 1900-01 39.7 18.9 1901-02 59.9 60.6 1902-03 34.1 40.0 1903-04 39.1 49.7 1904-05 48.0 39.7 1905-06 30.7 30.4 1906-07 57.1 42.6 1907-08 67.8 54.2 1908-09 42.6 39.6 1909-10 66.4 35.6 1910-11 52.0 31.2 1911-12 45.5 35.9 1912-13 20.4 15.2 1913-14 77.4 55.4 1914-15 56.0 45.8 1915-16 48.7 65.0 1916-17 39.4 37.6 1917-18 60.5 62.6 1918-19 18.1 14.3 1919-20 54.2 41.9 1920-21 30.2 27.5 1921-22 41.9 32.8 1922-23 65.9 64.4 1923-24 42.2 27.5 1924-25 41.0 35.0 1925-26 48.3 43.0 1926-27 43.2 40.0 1927-28 64.8 38.1 1928-29 21.6 15.2 1929-30 24.0 18.0 1930-31 30.3 26.0 1931-32 28.4 24.7 1932-33 22.1 19.3 1933-34 31.1 37.0 1934-35 42.7 38.5 1935-36 72.4 48.9 1936-37 31.4 22.7 1937-38 20.2 20.6 1938-39 42.4 36.7 1939-40 49.5 44.3 1940-41 45.9 58.1 1941-42 75.0 39.8 1942-43 42.3 41.1 1943-44 36.4 23.6 1944-45 52.2 46.3 1945-46 29.5 34.3 1946-47 44.7 30.6 1947-48 42.5 40.5 1948-49 28.0 22.3 1949-50 34.5 36.8 1950-51 51.4 43.2 1951-52 41.9 50.2 1952-53 31.7 21.0 1953-54 34.0 28.8 1954-55 26.1 34.0 1955-56 32.7 45.4 1956-57 58.2 50.7 1957-58 57.6 49.1 1958-59 44.7 39.1 1959-60 47.8 51.9 1960-61 91.9 80.2 1961-62 52.2 49.6 1962-63 61.2 55.8 1963-64 78.2 76.2 1964-65 46.2 24.9 1965-66 43.2 39.1 1966-67 59.5 64.7 1967-68 30.9 29.0 1968-69 38.9 18.3 1969-70 89.9 82.6 1970-71 68.4 61.4 1971-72 54.2 59.5 1972-73 31.4 30.6 1973-74 40.9 40.6 1974-75 50.1 38.8 1975-76 42.9 28.9 1976-77 40.8 42.1 1977-78 98.2 83.6 1978-79 39.9 37.3 1979-80 17.9 20.5 1980-81 38.8 41.6 1981-82 69.1 54.5 1982-83 22.6 17.6 1983-84 50.2 40.7 1984-85 31.6 25.0 1985-86 42.3 31.2 1986-87 52.3 53.5 1987-88 39.0 36.8 1988-89 23.7 7.0 1989-90 40.8 31.3 1990-91 34.4 27.9 1991-92 26.9 20.0 1992-93 92.5 55.8 1993-94 109.3 81.2 1994-95 23.5 12.8 1995-96 99.0 85.9 1996-97 41.4 15.2 1997-98 48.2 31.1 1998-99 35.2 37.1 1999-00 19.8 23.1 2000-01 32.1 37.8 2001-02 21.7 19.4 2002-03 83.6 63.9 2003-04 71.4 55.5 2004-05 36.2 38.3 2005-06 26.9 25.0 2006-07 37.6 29.4 2007-08 43.2 31.1 2008-09 26.3 24.2 2009-10 49.1 34.9 2010-11 38.4 45.6 2011-12 19.0 12.3 2012-13 43.6 32.7 2013-14 51.8 45.9 2014-15 52.0 44.4 2015-16 17.9 7.7 2016-17 37.8 41.1 2017-18 34.1 26.8 2018-19 40.1 32.4 2019-20 13.2 13.4 2020-21 45.7 54.3 2021-22 31.9 29.3 2022-23 24.3 19.9 2023-24 22.0 18.1 2024-25 20.5 15.3 -
February 2026 OBS & Discussion
donsutherland1 replied to Stormlover74's topic in New York City Metro
Warming winters coupled with unfavorable patterns/storm tracks are driving State College's seasonal snowfall lower. The coefficient of determination for the winter temperature-seasonal snowfall link is 0.498, meaning that the warming explains almost half of the decline in seasonal snowfall.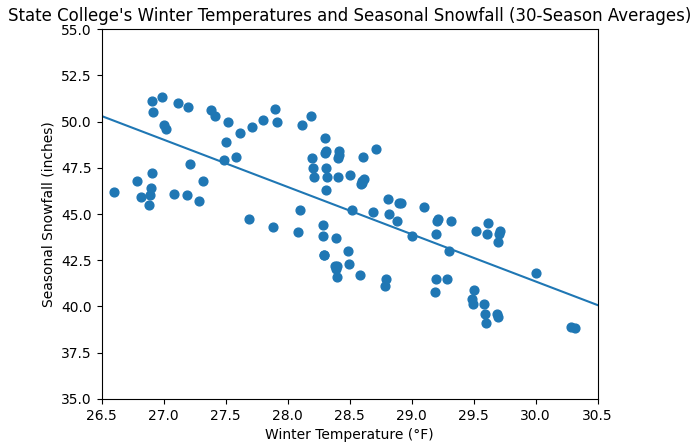
-
Presidents' day Snow potential
donsutherland1 replied to WeatherGeek2025's topic in New York City Metro
The 12z HREF: Deducting one category would still produce a 1"-2" snowfall for the New York City area and its nearby suburbs and a coating to an inch across most of Westchester and Rockland Counties. That is largely in line with the overall model guidance. I suspect that there will be an area with 2"-4" snowfalls in central New Jersey. The 12z NAM appears to be a high outlier overall.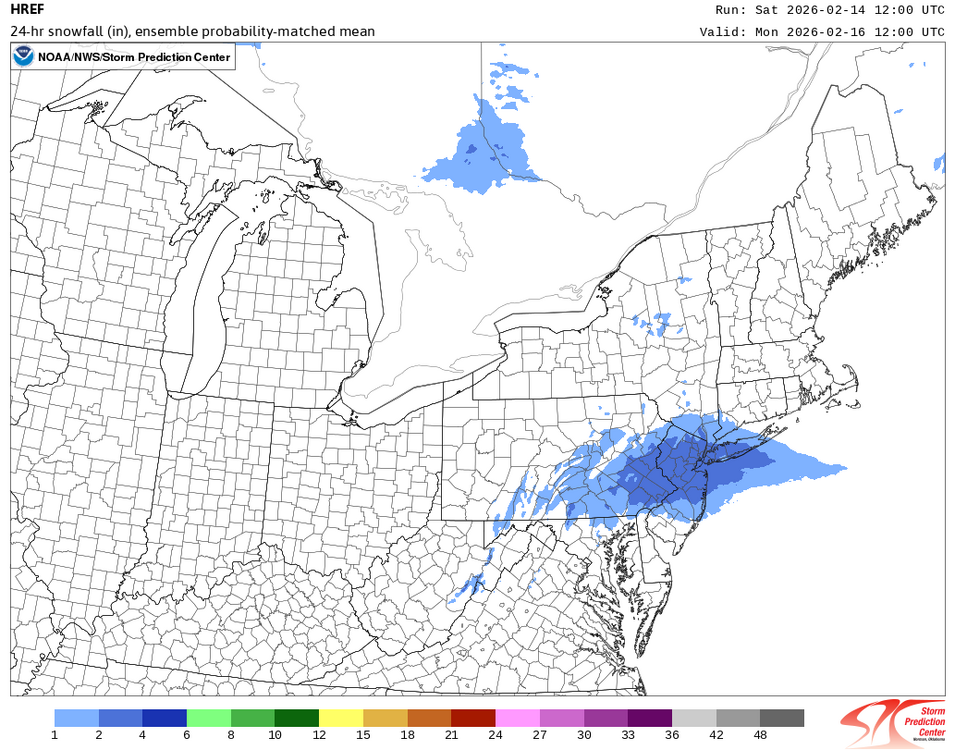
-
February 2026 OBS & Discussion
donsutherland1 replied to Stormlover74's topic in New York City Metro
Yesterday, the ECMWF-AIFS starting showing snowier solutions for New York City. Overnight, the guidance has shifted in that direction with the system taking a more northerly track than shown on the earlier guidance. Some of the overnight guidance such as the 2/14 6z GFS and ICON appear to have been overdone with the QPF for what is not likely to be a strong system. Those amounts will probably come down with subsequent guidance. Currently, it looks like New York City and its nearby suburbs are in line for a 1"-2" snowfall with higher amounts likely across central New Jersey. Areas north and west of New York City, especially from White Plains north and westward will see amounts fall off and perhaps rapidly. Most of the snow will likely fall prior to 9 am on Monday. Nevertheless, clouds could be slow to break holding temperatures to the upper 30s for most of the day. It remains possible that the mercury could reach 40° late in the day based on the 2/14 12z NBM. New York City could even see its first 40° or above low temperature since January 14th. Since recordkeeping began in 1869, New York City has seen measurable snowfall on 11.5% of years on February 16th. The highest daily figure was 9.9" in 1996. The most recent figure was 5.0" in 2010. The NBM presently shows a large spread between its 25th and 75th and 10th and 90th percentile figures. These large spreads convey a still high degree of uncertainty. A full-fledged February thaw still appears likely to crest during the middle and latter part of next week. There is fairly large uncertainty as to how warm the peak temperatures will get. 50s are possible in and around New York City.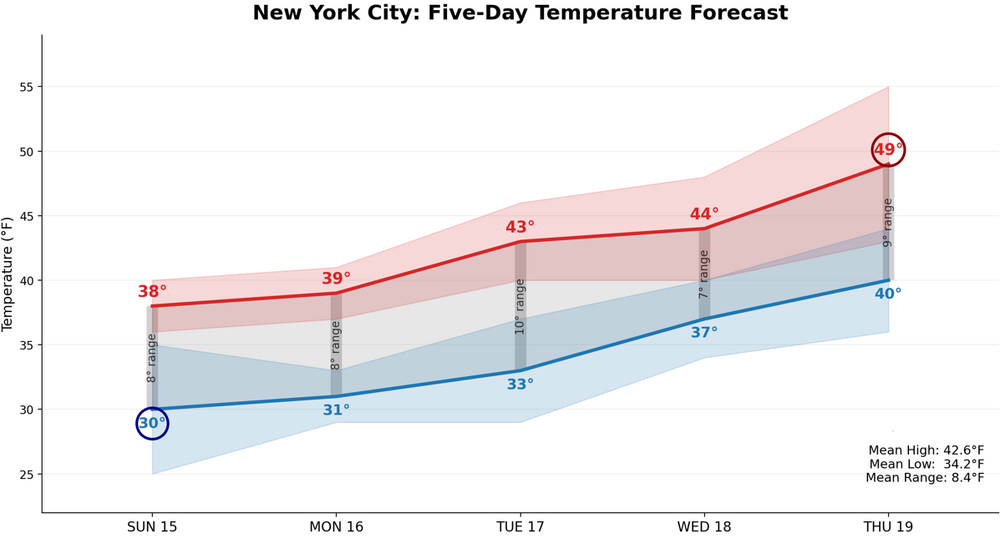
-
February 2026 OBS & Discussion
donsutherland1 replied to Stormlover74's topic in New York City Metro
Tomorrow and Sunday will see temperatures reach the upper 30s and lower 40s. A flurry or burst of light snow is possible in some areas tomorrow. A few areas could see a dusting. Some precipitation could arrive on Sunday or Monday. Areas with the highest probability of seeing precipitation will be south of New York City. A minor accumulation of snow is possible. It will likely become even milder with highs in the lower to middle 40s for a time next week. The ENSO Region 1+2 anomaly was +0.3°C and the Region 3.4 anomaly was -0.5°C for the week centered around February 4. For the past six weeks, the ENSO Region 1+2 anomaly has averaged -0.25°C and the ENSO Region 3.4 anomaly has averaged -0.52°C. La Niña conditions will likely continue into at least late winter. The SOI was +7.93 yesterday. The preliminary Arctic Oscillation (AO) was -0.519 today. Based on sensitivity analysis applied to the latest guidance, there is an implied near 94% probability that New York City will have a cooler than normal February (1991-2020 normal). February will likely finish with a mean temperature near 31.5° (4.4° below normal). Supplemental Information: The projected mean would be 3.8° below the 1981-2010 normal monthly value. Overall, Winter 2025-2026 is on track for a seasonal mean temperature of 31.9°. That would be the lowest winter mean temperature since Winter 2014-2015 when the mean temperature was 31.7°. Winter 2025-2026 would only become the fourth winter of the 21st century with a mean temperature of 32.0° or below. -
February 2026 OBS & Discussion
donsutherland1 replied to Stormlover74's topic in New York City Metro
A very good discussion, IMO. It describes what appears to be a reasonable worst-case scenario, although it should be noted that 4 EPS members now show 6" or more. It touches on the lack of phasing, which is a consistent theme given the wide separation of energy and front-running northern piece. -
February 2026 OBS & Discussion
donsutherland1 replied to Stormlover74's topic in New York City Metro
Today at the New York City Subforum: In reality, although the ECMWF-AIFS has brought back a moderate snowfall for Monday, the lack of ensemble support (at 0z), forecast temperatures, and its own unusual inconsistency over the past two days argues that its solution should be taken with a dose of skepticism. One should wait for additional support. For now, a light precipitation event remains possible. A moderate snowfall seems unlikely in the New York City area.
-
February 2026 OBS & Discussion
donsutherland1 replied to Stormlover74's topic in New York City Metro
This is actually the highest number of days since Winter 2014-2015 (55 days). Winter 2020-2021 had 32 days. -
February 2026 OBS & Discussion
donsutherland1 replied to Stormlover74's topic in New York City Metro
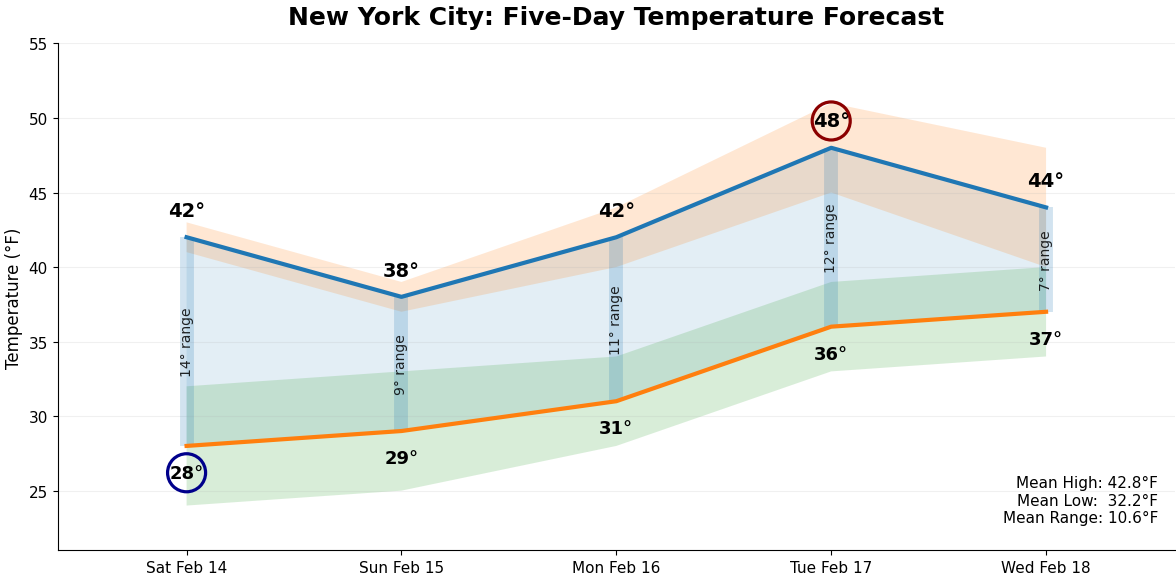
The big weather story for the New York City area this weekend through the middle of next week will be the combination of a February thaw and relatively quiet weather. A weak system will likely pass to the south Sunday night and Monday perhaps bringing some light precipitation for a time, mainly to the south of New York City. Temperatures during any precipitation will likely be mainly near or above freezing. The thaw could crest on Tuesday with the high reaching the upper 40s and possibly 50° in Central Park. Beyond the five-day period, some showers or periods of rain could be possible on Wednesday or Thursday with the temperature remaining above freezing for the duration of the event. The five-day figures from the NBM: For context, the forecast averages are somewhat more range-bound and somewhat milder than the values for the overall 1991-2020 climate reference period. Exceptional warmth remains unlikely. Despite the upcoming thaw, February remains extremely likely to be colder than normal overall.
-
Presidents' day Snow potential
donsutherland1 replied to WeatherGeek2025's topic in New York City Metro
January 23-February 15, 1980 was exceptionally dry with just a trace of precipitation. There was some rain afterward, but it took until the first half of March to turn wetter. -
Presidents' day Snow potential
donsutherland1 replied to WeatherGeek2025's topic in New York City Metro
As had been consistently the case with most of the high-quality guidance, the 500 mb story has remained largely unchanged. The spacing between the energy in the East remains too great to allow for much interaction, much less a phased solution. The top-performing ECMWF-AIFS has returned to its prior little or no snow solutions for President's Day. Finally, the overnight EPS deflated whatever dreams of a snowy solution might previously have existed.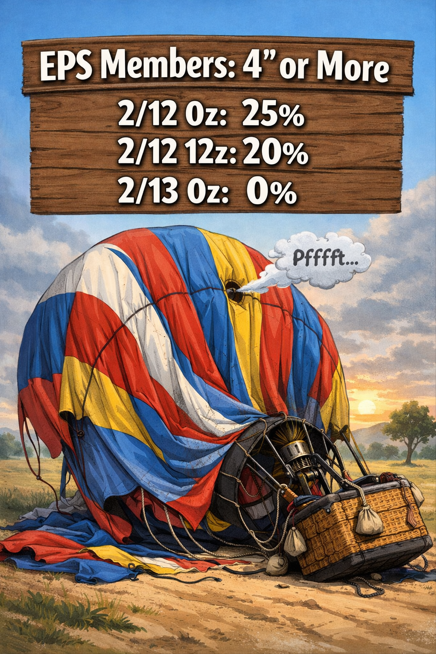
-
February 2026 OBS & Discussion
donsutherland1 replied to Stormlover74's topic in New York City Metro
Somewhat cooler weather has returned to the region. Temperatures will mainly top out in the middle to upper 30s tomorrow. The weekend will see highs in the upper 30s and lower 40s. It could become even milder with highs in the lower to perhaps middle 40s next week. Some precipitation could arrive on Sunday or Monday. The ENSO Region 1+2 anomaly was +0.3°C and the Region 3.4 anomaly was -0.5°C for the week centered around February 4. For the past six weeks, the ENSO Region 1+2 anomaly has averaged -0.25°C and the ENSO Region 3.4 anomaly has averaged -0.52°C. La Niña conditions will likely continue into at least late winter. The SOI was +7.93 today. The preliminary Arctic Oscillation (AO) was -0.731 today. Based on sensitivity analysis applied to the latest guidance, there is an implied near 93% probability that New York City will have a cooler than normal February (1991-2020 normal). February will likely finish with a mean temperature near 31.5° (4.4° below normal). Supplemental Information: The projected mean would be 3.8° below the 1981-2010 normal monthly value. Overall, Winter 2025-2026 is on track for a seasonal mean temperature of 31.9°. That would be the lowest winter mean temperature since Winter 2014-2015 when the mean temperature was 31.7°. Winter 2025-2026 would only become the fourth winter of the 21st century with a mean temperature of 32.0° or below. -
February 2026 OBS & Discussion
donsutherland1 replied to Stormlover74's topic in New York City Metro
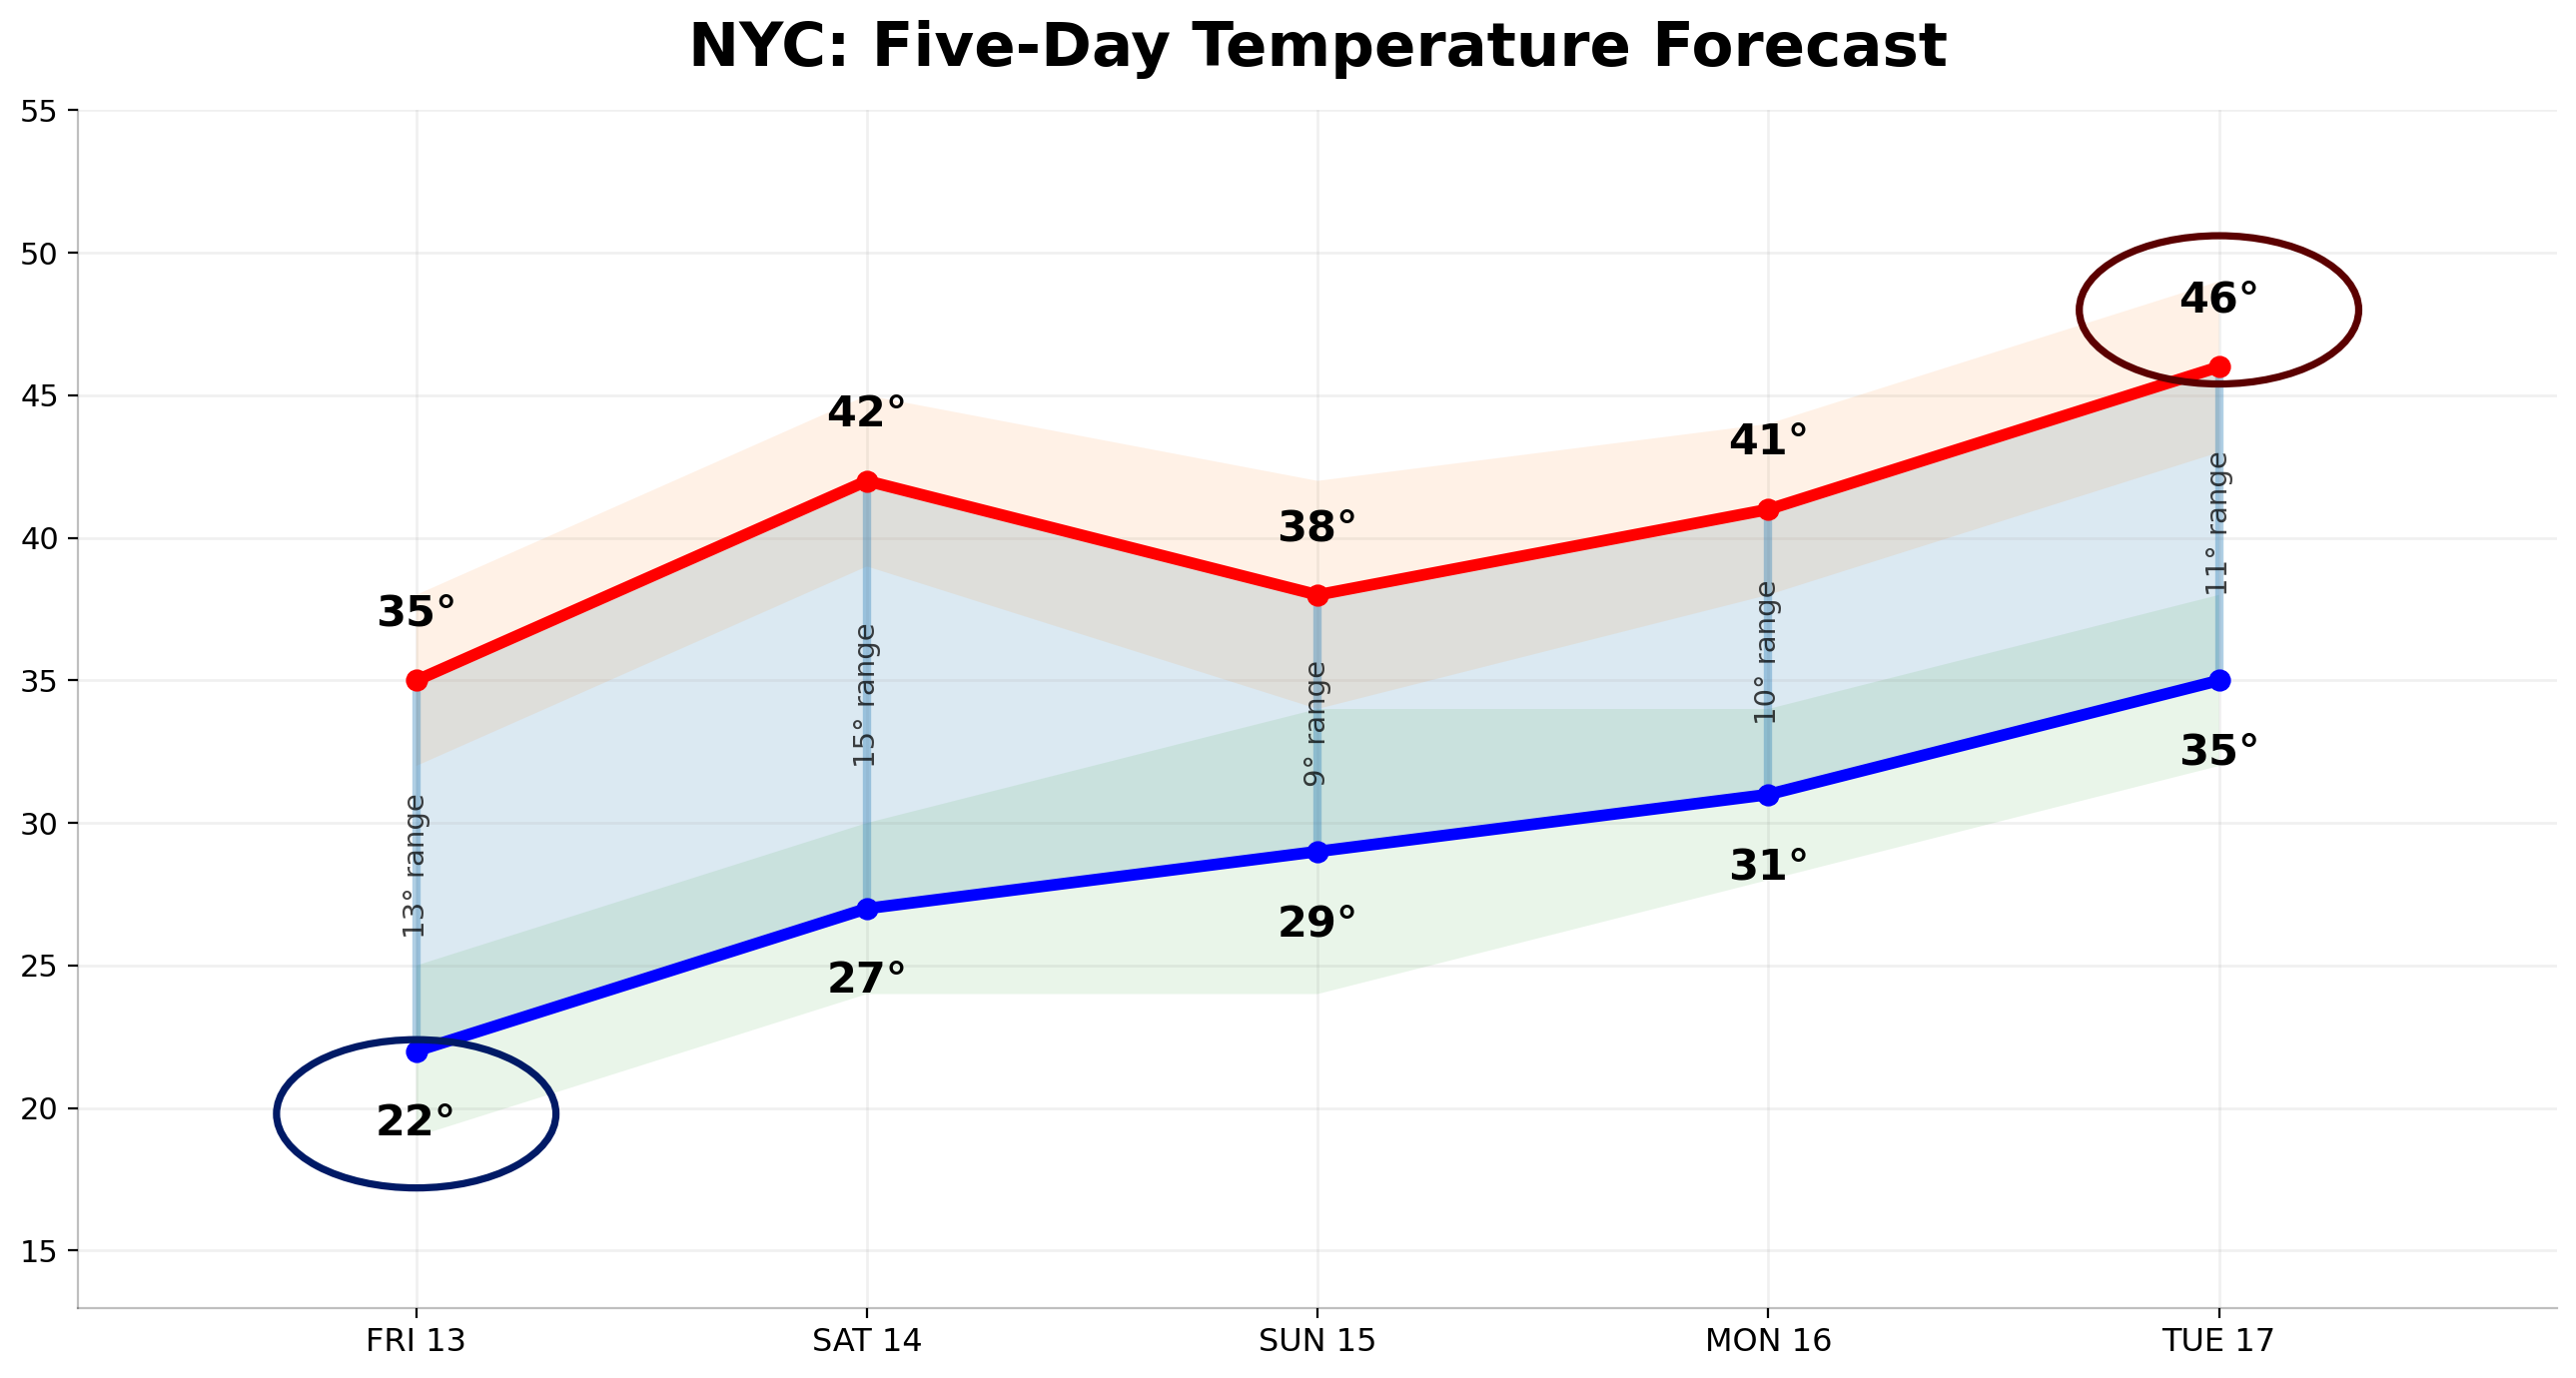
The 5-day NBM temperature forecast for NYC is below. Next week will likely see the mildest weather so far this month move into the NYC area.
-
AI is advancing faster than its full and growing potential can be realized. Things could happen faster than I sketched and others may have a lot more insight. There’s also some risk of bottlenecks related to data center construction/expansion, sufficient power supply, etc.
-
2025-2026 ENSO
donsutherland1 replied to 40/70 Benchmark's topic in Weather Forecasting and Discussion
The latest teleconnection forecasts have turned increasingly toward an AO+ as February moves into its final week. If these forecasts are accurate, the return of colder weather, albeit not severely cold, following the February thaw that remains likely through February 20 +/- a few days could wind up being fairly short-lived. If so, even if February ends with cooler than normal temperatures as suggested by the ECMWF weeklies, a milder regime could rebuild during the opening week of March. Forecasting skill for the teleconnections is fairly low beyond 10-14 days, so it will probably be another 5-7 days before one can be more confident about the outcome for the first week of March. Finally, the cooler weather with some opportunities for rainfall that will build into the Southwest by the middle of next week probably won't last more than a week. Warmer temperatures should return to close February.