donsutherland1
-
Posts
23,988 -
Joined
Content Type
Profiles
Blogs
Forums
American Weather
Media Demo
Store
Gallery
Everything posted by donsutherland1
-
Extreme Cold, Snow & Sleet: SECS 1/24 - 1/26
donsutherland1 replied to TriPol's topic in New York City Metro
For trivia, the biggest daily snowfall difference between JFK and LGA is 8.5". On February 17, 2003, JFK saw 21.6" while LGA saw 13.1". -
Winter 2025-26 has seen Phoenix's warmest December 1-January 22 period on record.
-
Extreme Cold, Snow & Sleet: SECS 1/24 - 1/26
donsutherland1 replied to TriPol's topic in New York City Metro
The latest image came out very small. Here's the bigger one: -
Extreme Cold, Snow & Sleet: SECS 1/24 - 1/26
donsutherland1 replied to TriPol's topic in New York City Metro
Yes. Here’s the NWS forecast: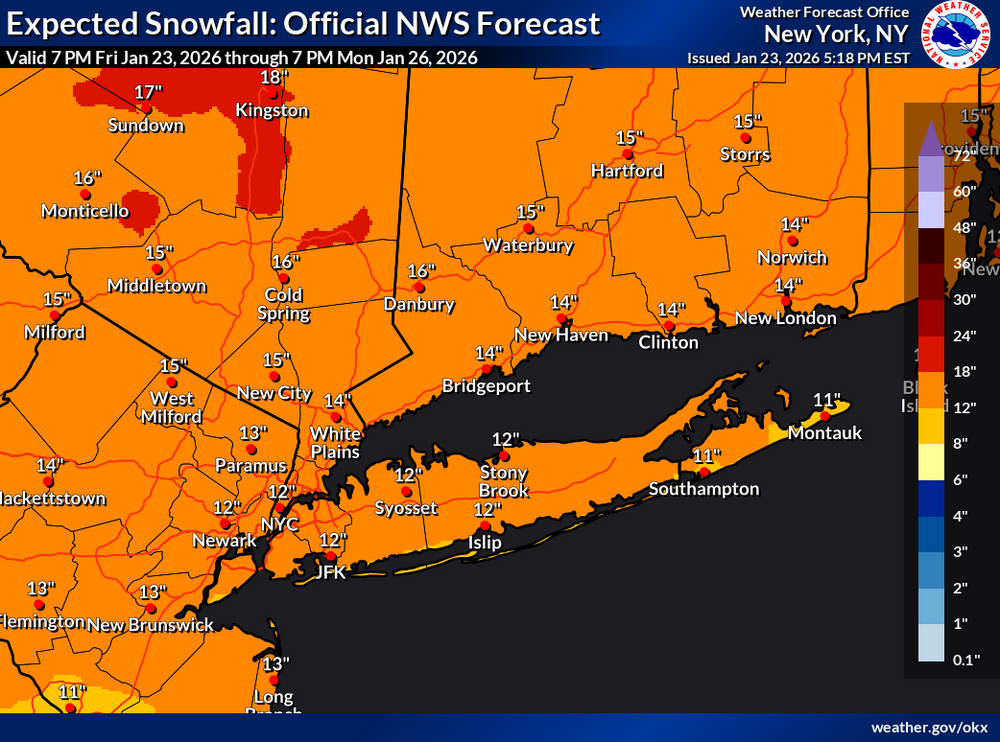
-
Extreme Cold, Snow & Sleet: SECS 1/24 - 1/26
donsutherland1 replied to TriPol's topic in New York City Metro
That was a rapidly strengthening coastal low. https://www.weather.gov/phi/eventreview20220129 https://bluehill.org/historic-blizzard-of-2022-impacted-new-england-with-strong-winds-and-record-snowfall/ -
Extreme Cold, Snow & Sleet: SECS 1/24 - 1/26
donsutherland1 replied to TriPol's topic in New York City Metro
Here it is: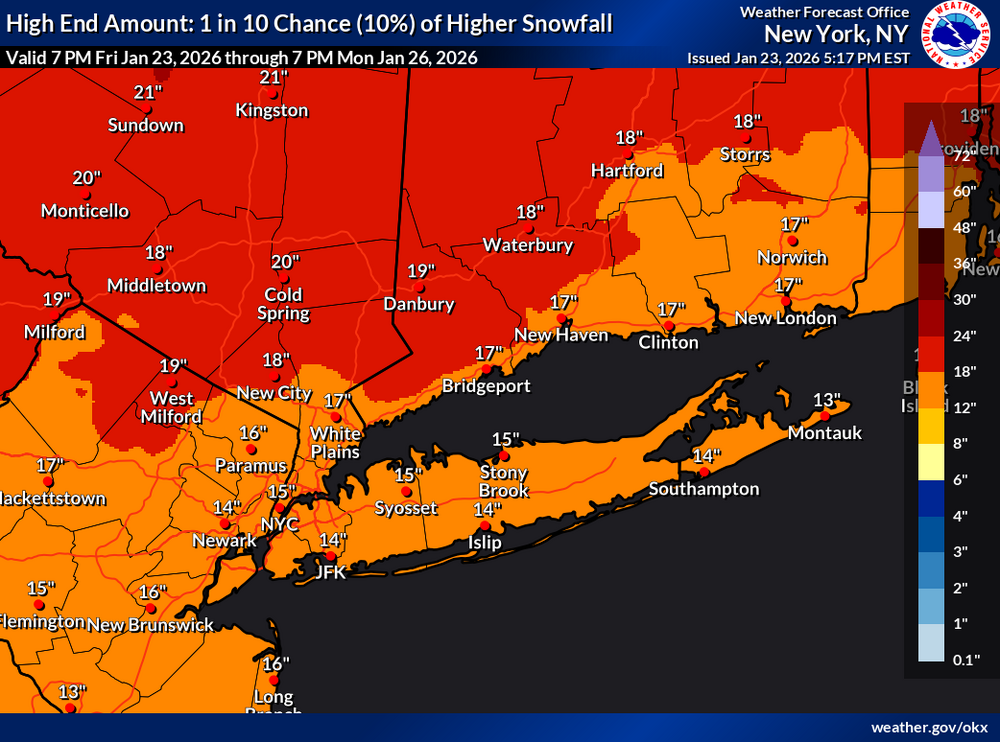
-
Extreme Cold, Snow & Sleet: SECS 1/24 - 1/26
donsutherland1 replied to TriPol's topic in New York City Metro
Even at the low-end NWS forecast, one sees a decent snowfall.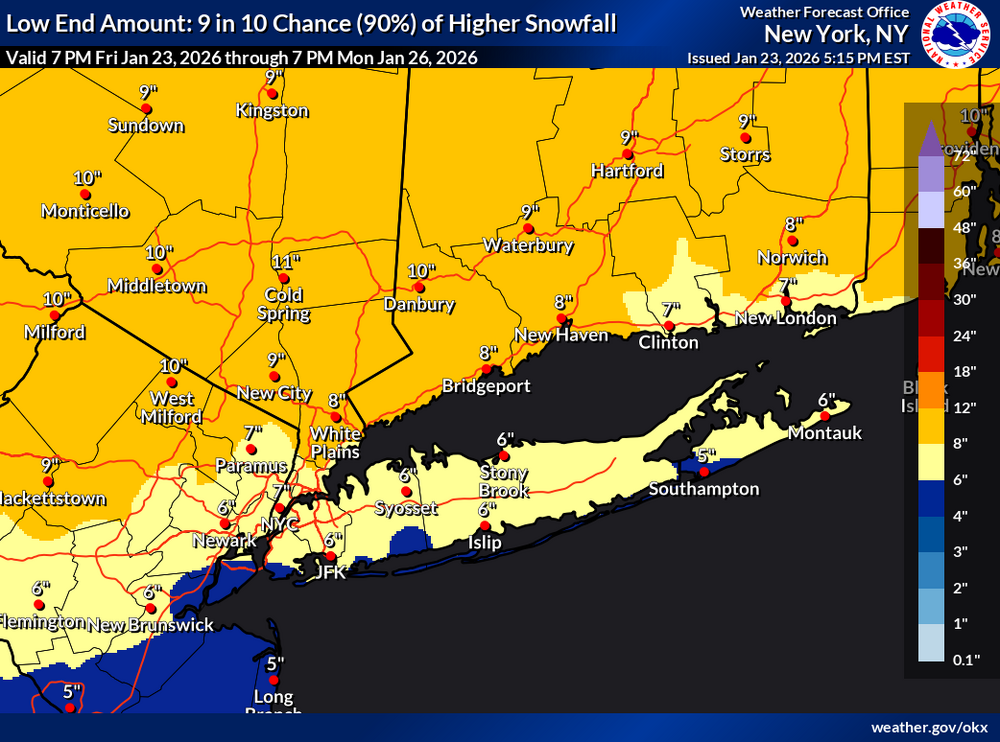
-
The Arctic Oscillation has averaged -0.433 this winter. 65% of days have seen a negative AO and 44% have seen the AO at -1.000 or below. Winter 2024-2025 had an AO average of -0.498 through January 23. Arctic air will pour into the region tonight. That will set the stage for the region's biggest snowstorm so far this winter and in a number of years. The temperature will likely stay below 20° in New York City and much of the region tomorrow. The last time that happened in New York City was January 21, 2025 when the high was 19°. Snow will arrive early on Sunday. A significant snowfall is likely in and around the New York City area and surrounding region, even as a transition to sleet is likely. At present, it appears that New York City and its nearby suburbs are in line for 6"-12" of snow. Areas to the north and west of the City where ratios will be higher and mixing is less likely will likely see 12"-18" of snow. Lesser amounts of 4"-8" appear likely along the central Jersey Shore and across eastern Long Island. Initial estimates: Albany: 12"-18" Allentown: 12"-18" Atlantic City: 3"-6" Baltimore: 6"-12" Binghamton: 12"-18" Boston: 12"-18" Bridgeport: 8"-14" Concord: 12"-18" Hartford: 12"-18" Islip: 4"-8" New York City: 6"-12" Newark: 6"-12" Philadelphia: 6"-12" Poughkeepsie: 12"-18" Portland: 14"-22" Providence: 12"-18" Richmond: 3"-6" Scranton: 12"-18" Washington, DC: 6"-12" The last time New York City saw a 6" or greater snowfall was January 28-29, 2022 when 8.3" fell. Its last 10" or above snowfall occurred during January 31-February 3, 2021 when 17.4" accumulated. Frigid air will return to the region as the storm departs. Highs will be mainly in the lower 20s through Friday. Tuesday could again see highs topping out only in the teens in New York City. Moreover, New York City has the potential to see the temperature dip into the single digits for lows on or more days during this period. Some snow flurries or snow showers are possible Thursday night into Friday morning. Overall, January 20th-February 3rd will likely be the coldest and perhaps snowiest two-week period this winter. The forecast WPO-/EPO-/AO-/PNA+ pattern is typically the coldest pattern in January and among the coldest during the first half of February. A persistently positive PNA will have above climatological risk of moderate or significant snowfalls. For perspective, the coldest two-week period this winter prior to January 20th was January 3-16, 2026 and January 4-17, 2026 with a mean temperature of 30.3°. The snowiest two-week period was December 14-27, 2025 when 7.2" of snow fell. The ENSO Region 1+2 anomaly was -0.3°C and the Region 3.4 anomaly was -0.7°C for the week centered around January 14. For the past six weeks, the ENSO Region 1+2 anomaly has averaged -0.48°C and the ENSO Region 3.4 anomaly has averaged -0.68°C. La Niña conditions will likely continue into at least late winter. The SOI was -19.59 today. The preliminary Arctic Oscillation (AO) was -2.243 today. Based on sensitivity analysis applied to the latest guidance, there is an implied near 99% probability that New York City will have a cooler than normal January (1991-2020 normal). January will likely finish with a mean temperature near 30.6° (3.1° below normal). Supplemental Information: The projected mean would be 2.0° below the 1981-2010 normal monthly value.
-
Extreme Cold, Snow & Sleet: SECS 1/24 - 1/26
donsutherland1 replied to TriPol's topic in New York City Metro
Yes. And because Microsoft no longer supports Windows 95, each frame needs to be scanned independently for viruses. And then it has to be double authenticated. -
2025-2026 ENSO
donsutherland1 replied to 40/70 Benchmark's topic in Weather Forecasting and Discussion
Through January 22nd, Phoenix is experiencing its warmest winter on record. However, numerous locations in the Great Lakes and East, along with Alaska, are seeing their coldest winter in at least several years. For Alaska, it's been the coldest winter to date in decades. Select mean temperatures for December 1-January 22: Albany: 26.5° (coldest since 2017-18) Anchorage: 12.2° (coldest since 1981-82) Boston: 31.8° (coldest since 2017-18) Burlington: 24.0° (coldest since 2018-19) Caribou: 14.9° (coldest since 2018-19) Concord: 24.1° (coldest since 2017-18) Detroit: 26.9° (coldest since 2017-18) Fairbanks: -20.8° (coldest since 1968-69) Juneau: 22.2° (coldest since 1981-82) Milwaukee: 24.6° (coldest since 2017-18) Minneapolis: 19.0° (coldest since 2021-22) New York City: 34.5° (coldest since 2017-18) Portland, ME: 25.2° (coldest since 2017-18) Washington, DC: 37.7° (coldest since 2017-18) -
Extreme Cold, Snow & Sleet: SECS 1/24 - 1/26
donsutherland1 replied to TriPol's topic in New York City Metro
That was an old forecast, I believe from Wednesday. Since yesterday, they've been at 4"-8". -
Extreme Cold, Snow & Sleet: SECS 1/24 - 1/26
donsutherland1 replied to TriPol's topic in New York City Metro
Their Accuweather forecast has 4"-8" for NYC. -
Extreme Cold, Snow & Sleet: SECS 1/24 - 1/26
donsutherland1 replied to TriPol's topic in New York City Metro
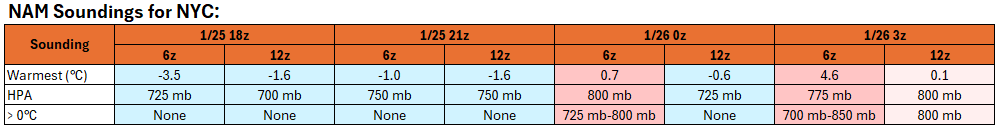
The NBM's average snow-liquid ratio was down to 10.0:1 for the 1/23 12z output vs. 16.5:1 for the 1/23 0z output. In short, it was starting to come in line with what is typical for high QPF snow events. Given the warming that is expected at 650 mb-800 mb, which will change the precipitation to sleet in New York City and its nearby suburbs and south and east from there, I suspect that a storm average 7:1 to 9:1 is probably more likely. That will still translate into a significant snowfall for the New York City area. Initially, little has changed regarding the DGZ and vertical profile of temperatures during the onset to the height of the storm. Conditions are forecast to be almost ideal for dendritic formation. Hence, snow-liquid ratios will probably start at 13:1 to 15:1 and then fall as the mid-levels begin to warm prior to the change to sleet. Snowfall rates could approach 1"-2" per hour during late Sunday morning into the early Sunday afternoon as an area of powerful 700 mb frontogenic forcing moves across the region. The NAM had been the most aggressive model with the push of warm air aloft at 6z, but it backed off at 12z, due to a combination of a weaker/more southward primary low and overall reduction in amplification at 500 mb. The RGEM had moved in a similar direction as the 12z NAM during the 6z cycle but then reversed itself at 12z. A comparison of the 6z and 12z NAM soundings for NYC for select points in time is below. With the models continuing to shift about, it makes little sense to pursue hunches or preconceived notions into blind alleys, throw darts to guess which specific model solution will verify, or to ride any single model and the roller coaster of emotions it brings with each cycle. Thus, continuity at this point is a better approach than lurching in one direction or another only to crash one's forecast. To me, it still appears that New York City and nearby areas will likely see a storm total of 6"-12" of snow and sleet. Areas to the south and east of New York City could see 4"-8" amounts. Pockets of 12"-18" amounts are possible well north and west of New York City, most likely in parts of northeastern Pennsylvania, Orange County, Dutchess County, and Sussex County. There remains some uncertainty concerning mid-level and surface storm evolution and tracks, and perhaps somewhat greater uncertainty regarding a potential primary-secondary storm handoff. Model skill is improving and will improve markedly today as the lead time shortens during the day. For now, it appears that the models are slowly working toward a consensus. At present, there's no compelling need to make changes up or down in storm total snow/sleet amounts.
-
Extreme Cold, Snow & Sleet: SECS 1/24 - 1/26
donsutherland1 replied to TriPol's topic in New York City Metro
The 12z NAM was less amplified at 500 mb than the 6z run and it backed off on the push of the warmth aloft. It will be interesting to see the soundings changes. This should alleviate some of the worries concerning the New York City area and nearby suburbs. The warmth still reached parts of the Jersey Shore in a pretty big way. QPF also increased over 6z. -
Extreme Cold, Snow & Sleet: SECS 1/24 - 1/26
donsutherland1 replied to TriPol's topic in New York City Metro
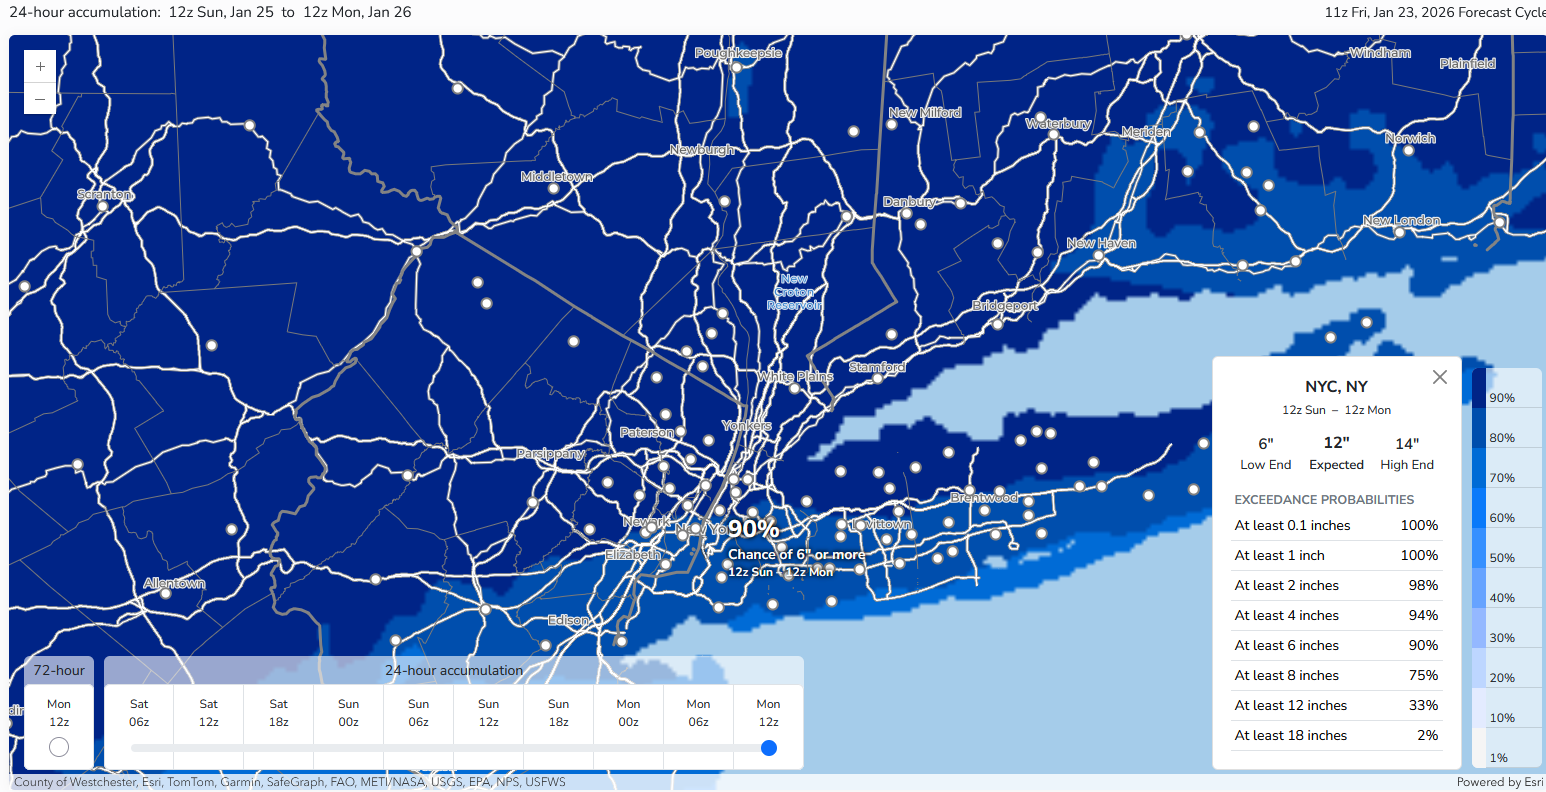
Latest NWS probabilistic estimate of 6" or more snow for New York City: 90% Islip was at 81% and Newark was at 88%.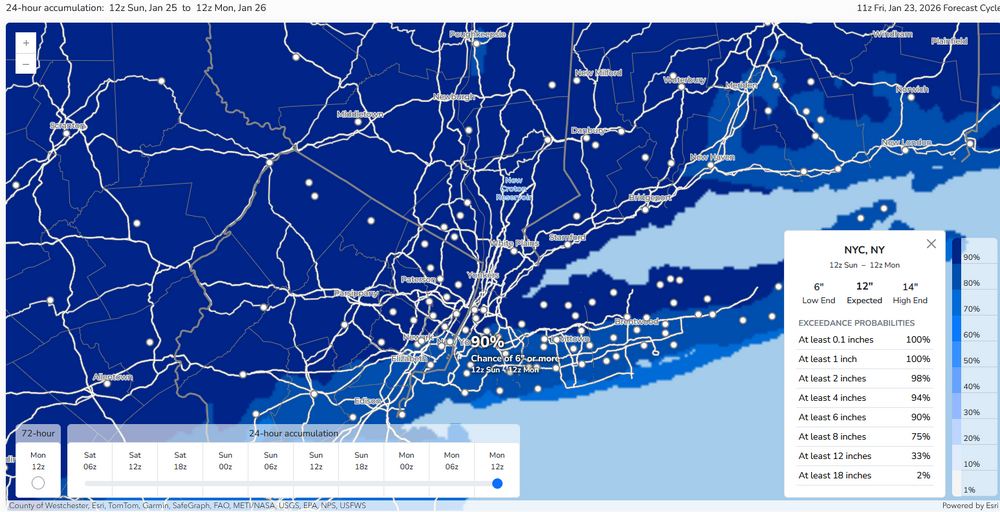
-
Extreme Cold, Snow & Sleet: SECS 1/24 - 1/26
donsutherland1 replied to TriPol's topic in New York City Metro
I bleieve @Dark Star posts the triangle. His visualization really summarizes things quite well. -
Extreme Cold, Snow & Sleet: SECS 1/24 - 1/26
donsutherland1 replied to TriPol's topic in New York City Metro
My thoughts haven't changed too much overnight. Cooler air arrived a few hours more slowly than had been modeled overnight. But overall, things remain on track for a frigid start to the weekend and a large storm on Sunday into early Monday. The overnight guidance reached consensus that the snow that arrives on Sunday will eventually change to sleet in much of the New York City area and its nearby suburbs. A few of the models cut back on QPF. Almost 95% of EPS and GEFS members show 6" or more snow in New York City. In the bigger picture, the New York City area remains in line for its biggest snowstorm in nearly four or five years. It remains likely that New York City and nearby areas will see a storm total of 6"-12" of snow and sleet. Areas to the south and east of New York City could see 4"-8" amounts. Pockets of 12"-18" amounts are possible well north and west of New York City, most likely in parts of northeastern Pennsylvania, Orange County, Dutchess County, and Sussex County. There remains some uncertainty concerning mid-level and surface storm evolution and tracks, and perhaps somewhat greater uncertainty regarding a potential primary-secondary storm handoff. Model skill will improve markedly today. Whether or not changes will need to be made remain to be seen. -
Extreme Cold, Snow & Sleet: SECS 1/24 - 1/26
donsutherland1 replied to TriPol's topic in New York City Metro
Why? Even areas with warmer climates can see big snowstorms. The NYC area will continue to see periodic big snowstorms and snowy winters for the foreseeable future. -
Extreme Cold, Snow & Sleet: SECS 1/24 - 1/26
donsutherland1 replied to TriPol's topic in New York City Metro
So far, the early 0z guidance has been more about confirming the idea that the snow will transition to sleet in parts of the New York City area (including the City and nearby suburbs) than changing storm total snowfall amounts. QPF has ticked higher. All in all, it hasn't been a bad start to the 0z cycle. -
Extreme Cold, Snow & Sleet: SECS 1/24 - 1/26
donsutherland1 replied to TriPol's topic in New York City Metro
Here's their latest AFD: As strong high pressure retreats to the NE late Sat night into Sunday, an expansive winter storm will impact the area from then into Mon. Primary low pressure moving into the TN valley on Sunday should dissipate while a secondary low forms near Cape Hatteras and the VA capes, and then moves to a position just inside the 40N/70W benchmark. Snow should begin in the NYC metro area after midnight Sat night and spread NE to the rest of the CWA by daybreak, with some accumulation of 1-2 inches possible by daybreak for the NYC metro area. Heavy snow is then likely daytime Sunday into Sunday evening via strong front-end H7-8 frontogenetic and thermal forcing aided by an anticyclonic upper jet to the north. Given the cold air mass in place, snow ratios look to be on the high side (15:1) at the onset, and then settle down a little closer to 12:1 as heavier precip arrives and the low to mid levels slowly warm. Depending on the ultimate track of the system, it remains possible enough warm air could intrude aloft to force a brief mix with sleet and/or freezing rain Sunday night, especially for NYC and Long Island. Have only mentioned a slight chance of this occurring, and at any rate the damage will have been done well before then as far as meeting 6+ inch snowfall amounts. Total QPF for the event should be roughly between 1.0-1.5 inches. Watch mentions potential for at least 6-12 inches with potential for 12 or more inches. The above QPF with higher snow ratios yields widespread potential accumulations of over a foot. As the coastal system exits north and east into Monday, the deepening low and an inverted surface trough may allow for some additional light accumulation much of the day as well, though heavy snowfall should be over by that point. -
Extreme Cold, Snow & Sleet: SECS 1/24 - 1/26
donsutherland1 replied to TriPol's topic in New York City Metro
These are the NWS maps from this afternoon/evening: -
Extreme Cold, Snow & Sleet: SECS 1/24 - 1/26
donsutherland1 replied to TriPol's topic in New York City Metro
From the list of snowstorms I provided earlier, I checked Islip's climate record. Islip's record covers all the snowstorms beginning with the January 1964 blizzard. Only the January 29-31, 1966 blizzard brought less than 6" to Islip (5.0"). My current thinking is that Islip will see 4"-8", but we'll see if that holds up. -
2025-2026 ENSO
donsutherland1 replied to 40/70 Benchmark's topic in Weather Forecasting and Discussion
You are correct. I accidentally referred to five years ago pertaining to NYC (January 30-February 4, 2021 snowstorm that brought 17.4" to NYC). -
Extreme Cold, Snow & Sleet: SECS 1/24 - 1/26
donsutherland1 replied to TriPol's topic in New York City Metro
Thank you for sharing your memories. May your father RIP. I miss my father, too. He passed away almost 12 years ago. -
Extreme Cold, Snow & Sleet: SECS 1/24 - 1/26
donsutherland1 replied to TriPol's topic in New York City Metro
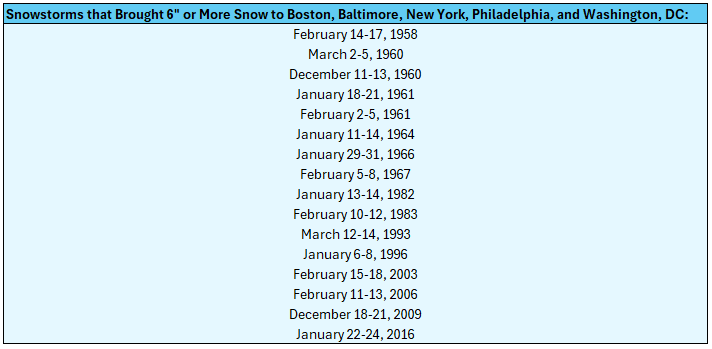
The upcoming snowstorm will likely join a relatively small number of storms that brought 6" or more to all of the following cities: Baltimore, Boston, New York, Philadelphia, and Washington, DC. Many of those prior storms were epic storms. The list since 1950 is below. In short, not only will this storm likely be New York City's biggest snowstorm in nearly four or five years, it could be a really special event, too.