donsutherland1
-
Posts
23,988 -
Joined
Content Type
Profiles
Blogs
Forums
American Weather
Media Demo
Store
Gallery
Everything posted by donsutherland1
-
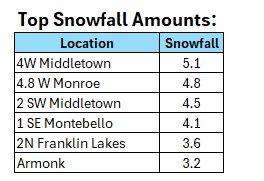
Highest snowfall amounts so far:
-
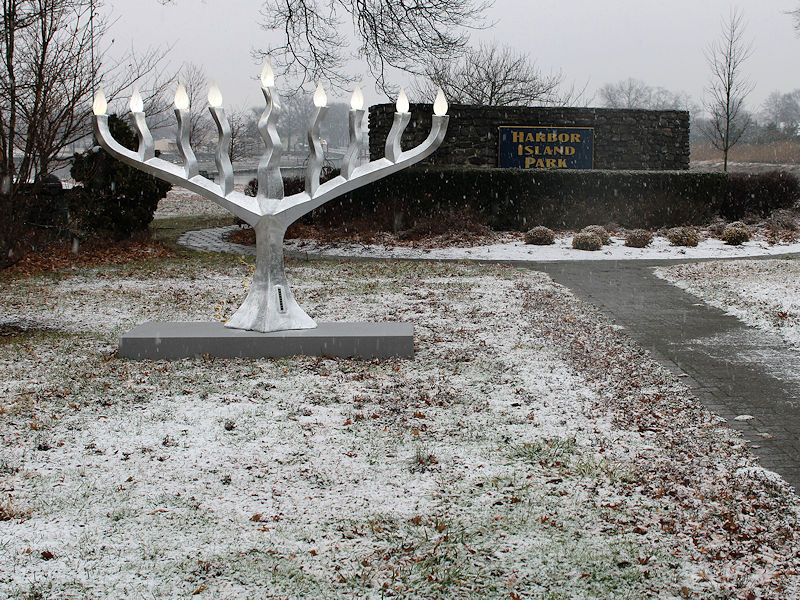
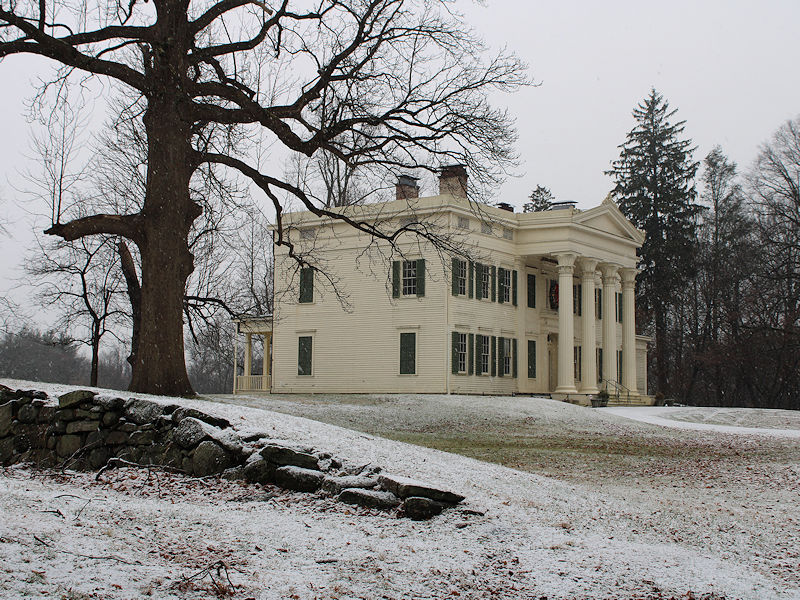
Two photos from this morning:
-
From Rye, NY:
-
Some large flakes in Larchmont, NY. The snow is melting about as fast as it is falling. Very little is accumulating.
-
The snow is finished with Central Park. My guess is that the final figure will be a trace and, at most 0.1". We'll see. Above freezing temperatures + light precipitation rates + limited time before midlevel warming changes the precipitation is a bad combination. It's no accident that nearly three-quarters of snow events with above freezing temperatures produce trace amounts and more than 90% produce < 1".
-
Central Park has flipped to light rain at 8 am.
-
From a short time ago:
-
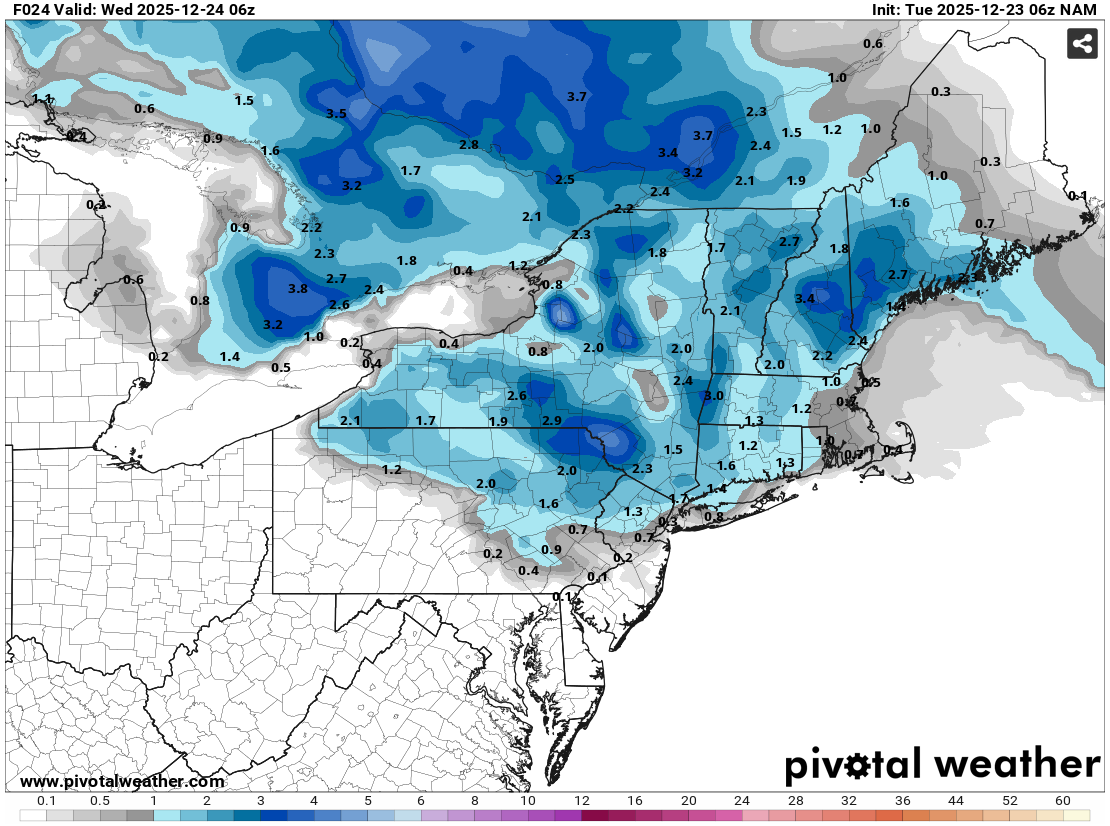
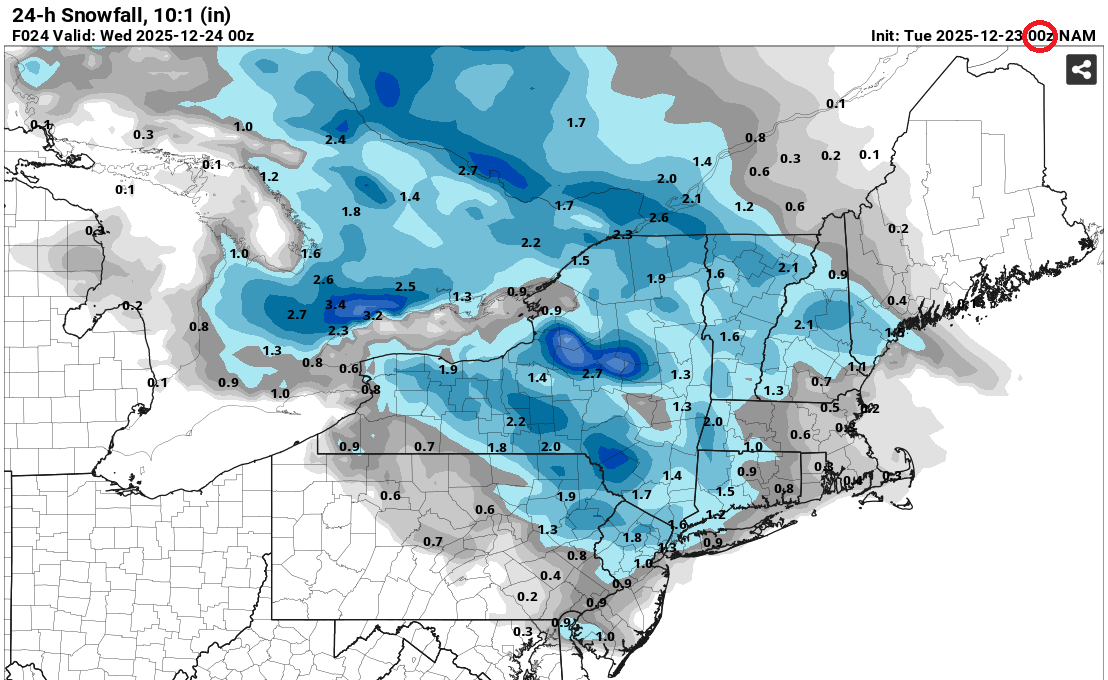
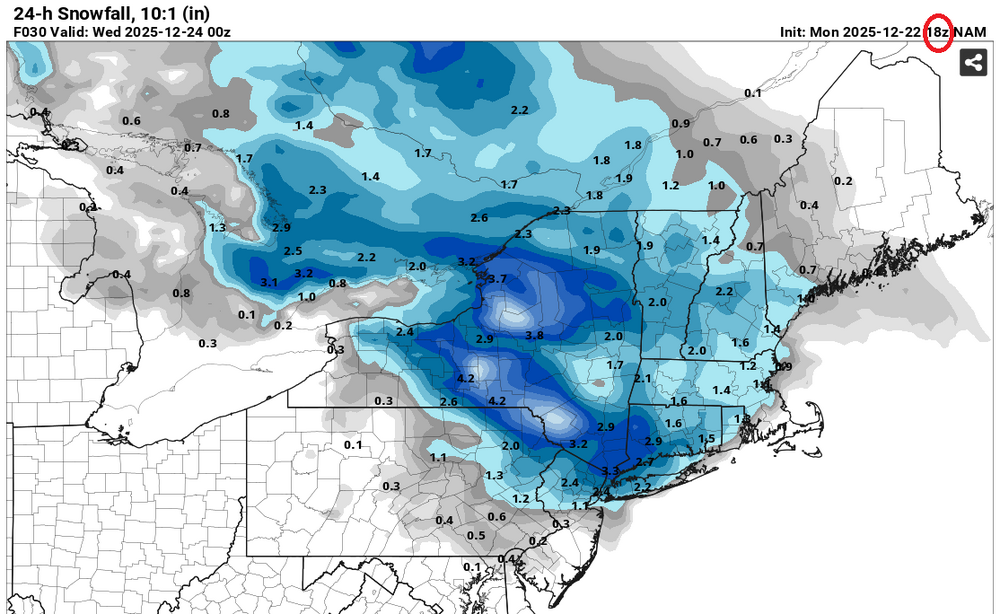
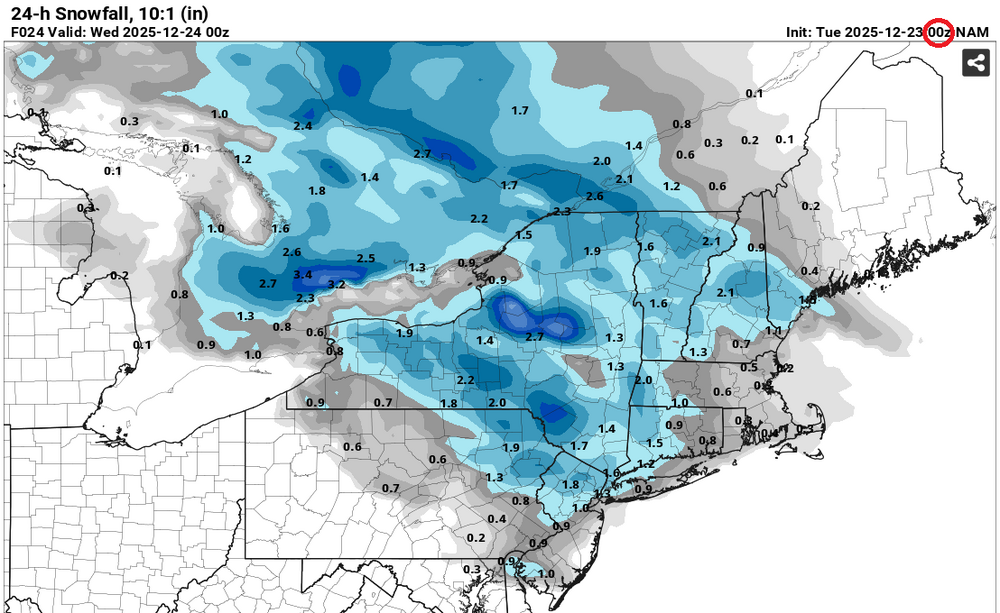
Overnight, the NAM continued to trim snowfall amounts for New York City where a coating is far more likely than the NAM's earlier 2" amount. Checking historical data, the last time NYC saw 2.0" or more snow with a minimum temperature of 34° or above was January 23, 1966 (2.4" with 0.72" precipitation). The guidance showed < 0.25" precipitation. Aside from the above freezing temperatures, the light precipitation rate was also a "red flag." The last time New York City saw 2.0" or more snowfall with a low of 34° or above and < 0.25" precipitation was March 13, 1943. Then, 2.8" of snow fell with 0.23" precipitation and a low of 34°. The snow fell over a two-hour period with 0.16" of precipitation with a peak hourly amount of 0.11". The guidance showed peak hourly precipitation of 0.04" for the current weak system. As noted previously about snowfall with above freezing temperatures, in New York City, only 25.6% of storms have seen measurable snowfall with a daily low of 33° or above with just 9.2% seeing 1" or more snowfall. Almost three-quarters (74.4%) of such events have seen only a trace of snowfall. Put another way, more than 90% of such systems with snowfall at above freezing temperatures saw < 1" of snow. With low precipitation rates, the < 1" figure was the most likely outcome. Will that be correct? We'll know by this afternoon. Finally, 1"-3" well north and west of New York City still looks reasonable. Places like Binghamton and Middletown could see 3"-5".

-
For New York City and nearby areas, a coating to perhaps an inch remains the most likely outcome. The 2" figure shown on the NAM has been slashed in its 0z cycle. Live by the NAM... Die by the NAM... Issues for New York City: Mainly or wholly above freezing Light precipitation rates
-
A weak system will bring some light snow possibly mixing with or ending as some light rain or drizzle in some areas tomorrow. New York City will likely see a coating to 1". A 1"-3" snowfall is possible in the northern and western suburbs where it will be somewhat colder. The temperature will likely remain above freezing throughout the day on Tuesday in New York City. In New York City, only 25.6% of storms have seen measurable snowfall with a daily low of 33° or above with just 9.2% seeing 1" or more snowfall. Almost three-quarters (74.4%) of such events have seen only a trace of snowfall. Another system could bring precipitation on Friday into Saturday. This system could have more moisture to work with than tomorrow's. No exceptionally cold or warm weather appears likely for the first week of astronomical winter. The closing days of December will likely be colder than normal. December 2025 will likely finish with a maximum monthly temperature below 60° in New York City. The last time that happened was in 2019 when the monthly high was 58°. If 2025 has a monthly high below 60°, that would be only the fifth such occurrence since 2000 (2003, 2004, 2005, and 2019 are the cases since 2000). The ENSO Region 1+2 anomaly was -0.6°C and the Region 3.4 anomaly was -0.8°C for the week centered around December 17. For the past six weeks, the ENSO Region 1+2 anomaly has averaged -0.40°C and the ENSO Region 3.4 anomaly has averaged -0.68°C. La Niña conditions will likely continue through at least mid-winter. The SOI was +10.59 today. The preliminary Arctic Oscillation (AO) was +1.620 today. The PNA was -1.766. That's the lowest winter value since December 24, 2021 when the PNA was -2.084. Based on sensitivity analysis applied to the latest guidance, there is an implied near 100% probability that New York City will have a cooler than normal December (1991-2020 normal). December will likely finish with a mean temperature near 34.3° (4.8° below normal). Supplemental Information: The projected mean would be 3.1° below the 1981-2010 normal monthly value.
-
No. Below are the PNA values: 2004 1 27 0.127 2004 1 28 0.228
-
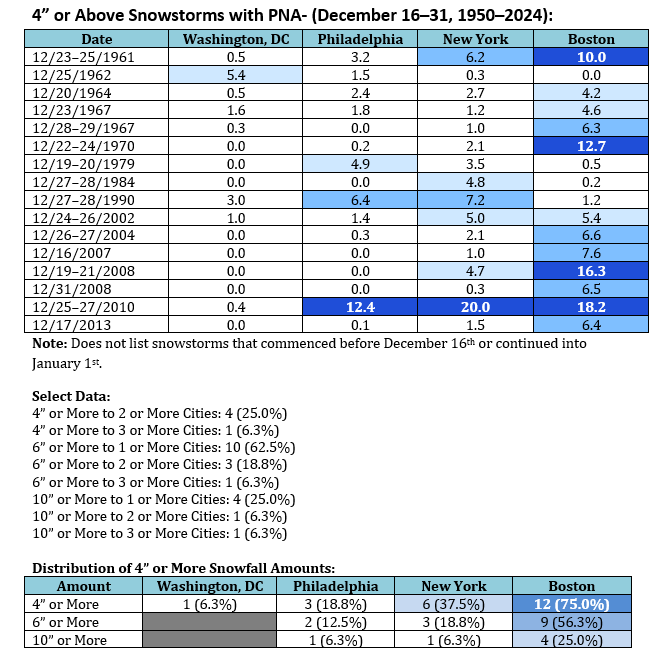
It would certainly be unusual. The New York City area hasn't seen many 4" or greater snowstorms when the PNA has been negative. Lighter amounts are far more common. Boston is usually favored with 4" or above amounts.
-
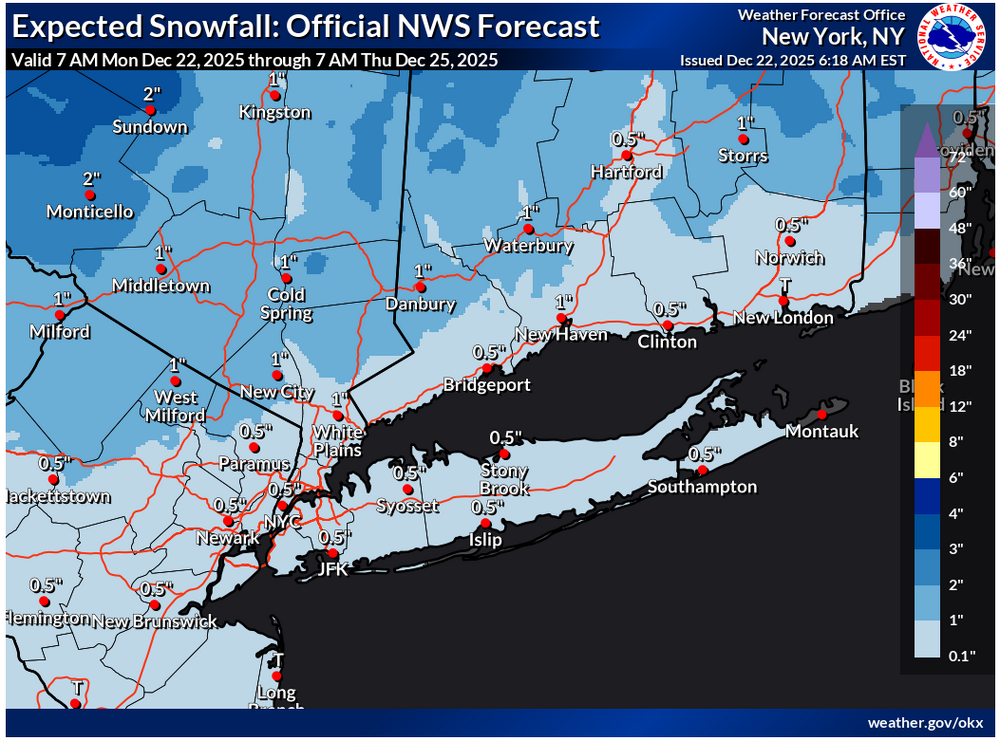
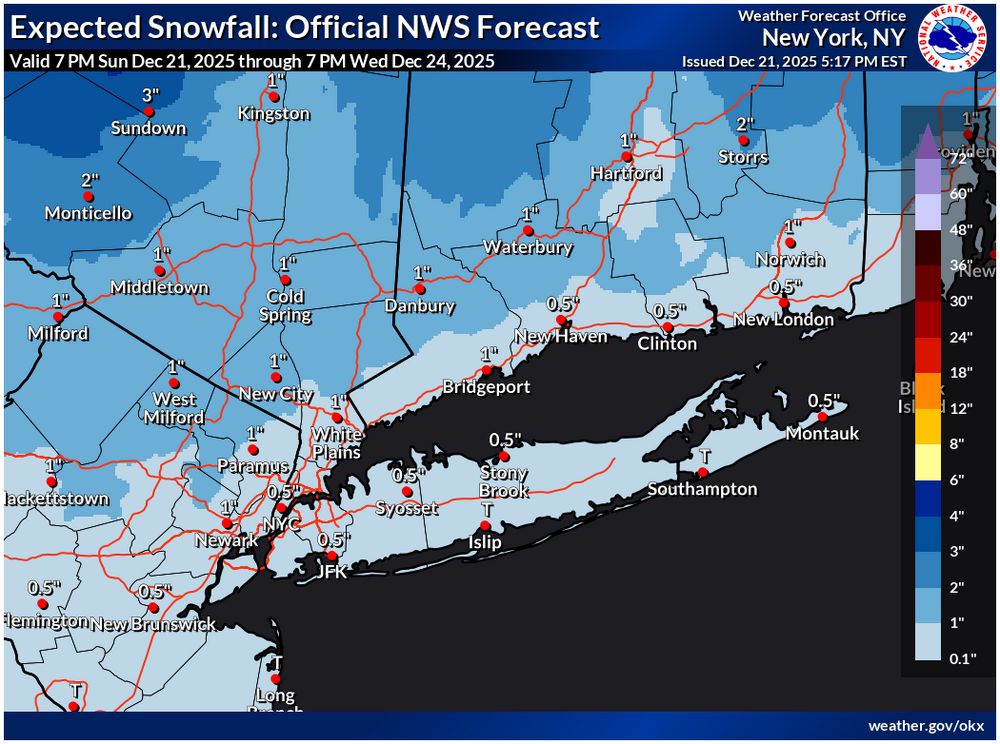
Updated NWS Map:

-
2025-2026 ENSO
donsutherland1 replied to 40/70 Benchmark's topic in Weather Forecasting and Discussion
Thank you, @jconsor. This is encouraging to know. -
I agree concerning a miss to the south. The historical odds would favor something further north than what the recent runs of the GFS have been showing. It should also be noted that most storms during PNA- patterns have lighter amounts. Many options are on the table, including a weak, sheared out primary that produces very little precipitation. Let's see how things evolve.
-
MJO812 uncancelled it.
-
For reference, I'll add this information here for second half of December PNA- snowstorms.
-
2025-2026 ENSO
donsutherland1 replied to 40/70 Benchmark's topic in Weather Forecasting and Discussion
Is is possible that these charts also have an algorithmic issue? Here's the GEFS from NCEP's site: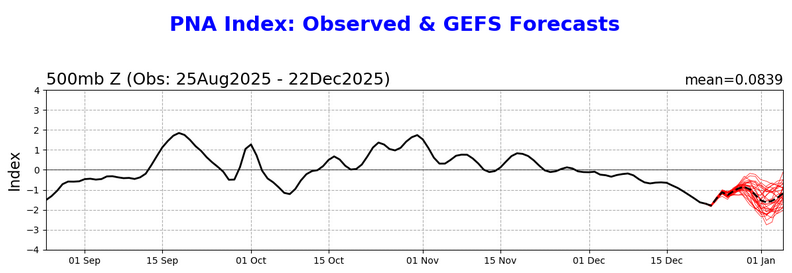
-
For reference in light of some of the recent guidance suggesting the potential for a more substantial system late in the week:
-
The WPC mapping tool isn't topographic. Hopefully, as AI allows for greater detail at reduced computing power, future maps will be topographic in nature to better capture elevation-related accumulations.
-
Not much has changed overnight. A coating of snow seems likely in New York City and its nearby suburbs due to a combination of marginal temperatures and light precipitation rates. 1"-2" is likely in the distant northern and western suburbs. There could be some 3" amounts in places like Binghamton. Overall, the system remains on course to be a minor one. The latest WPC maps: For reference: the latest NWS Map:
-
2025-2026 ENSO
donsutherland1 replied to 40/70 Benchmark's topic in Weather Forecasting and Discussion
Those are large differences. I'm not sure whether the algorithm is faulty or their methodology is off. -
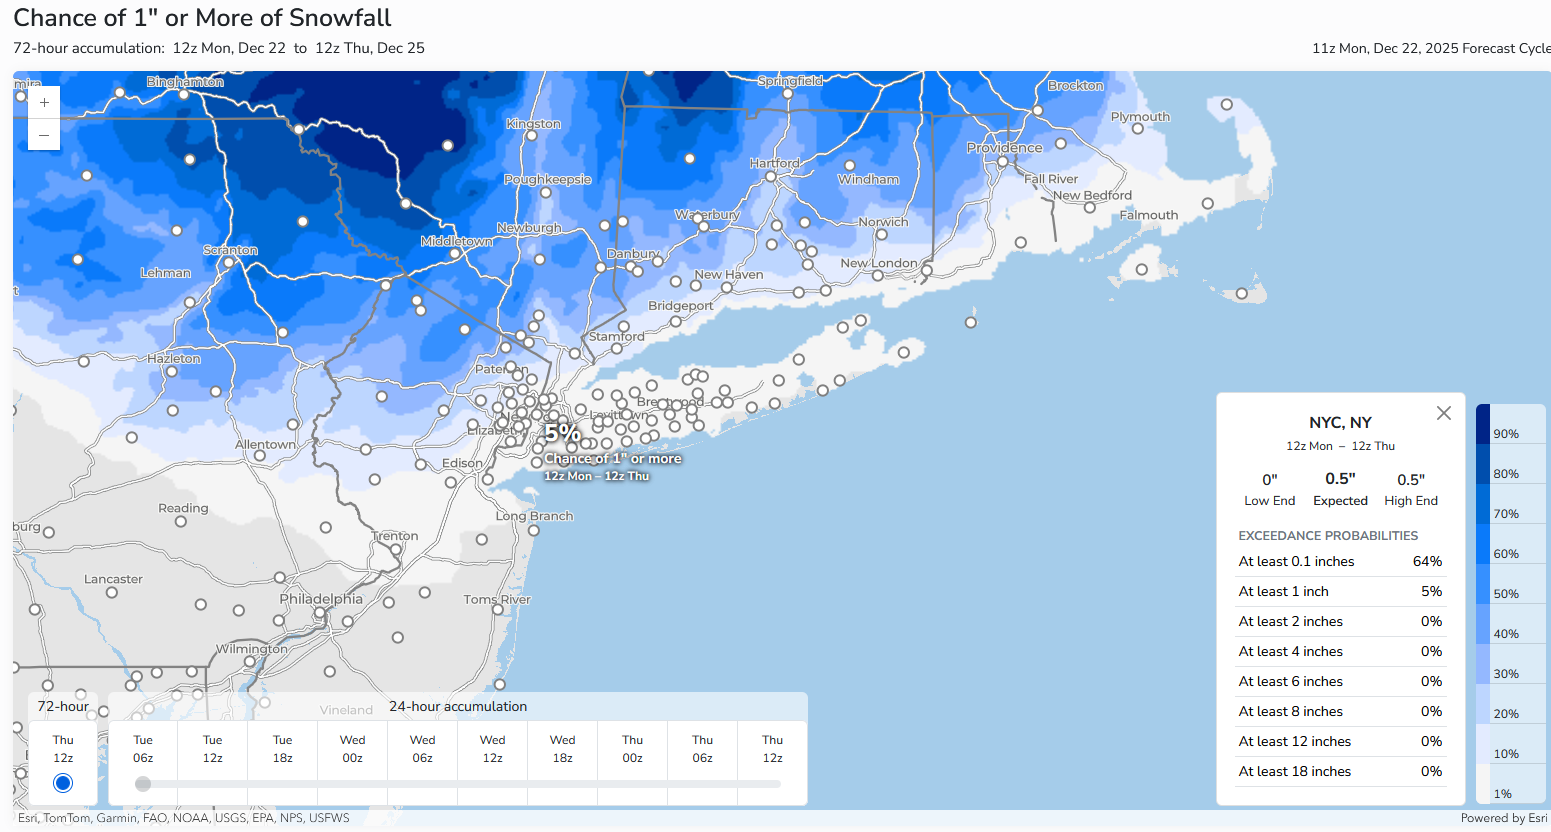
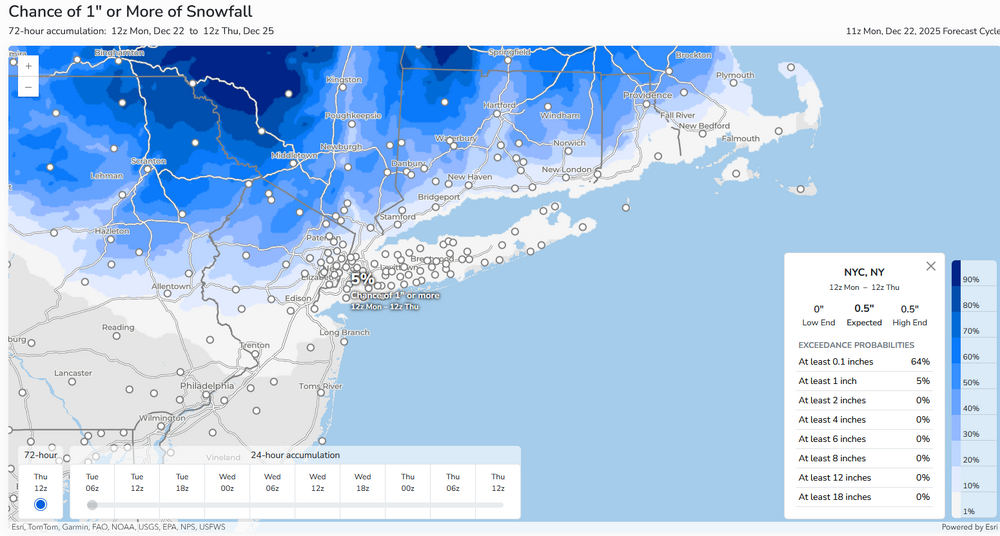
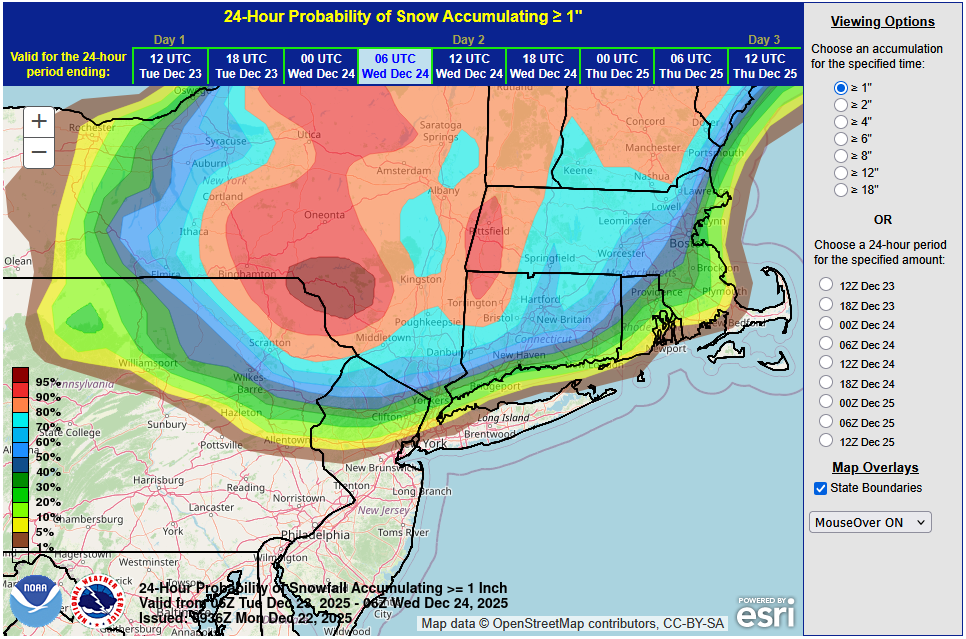
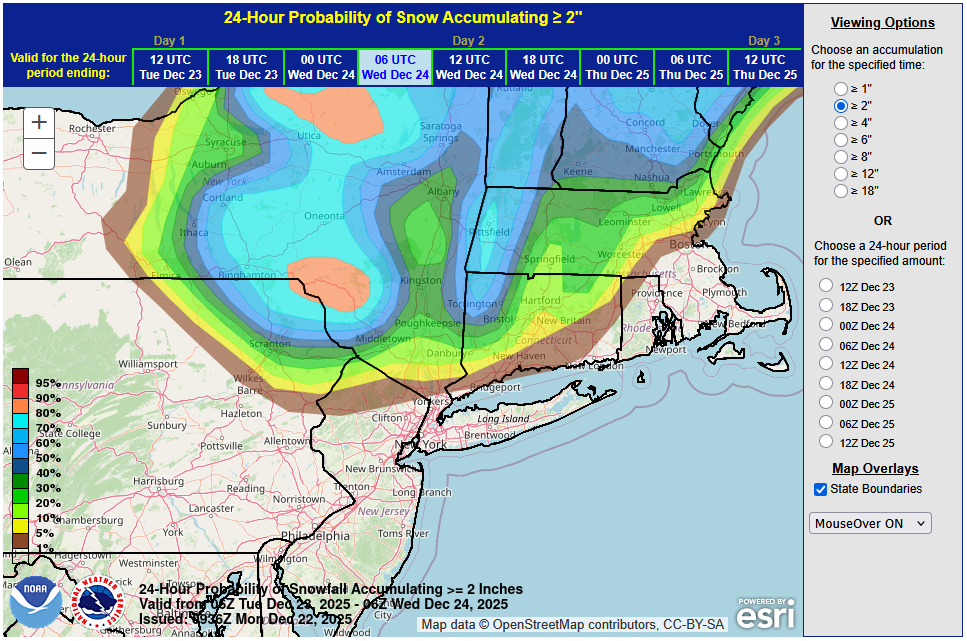
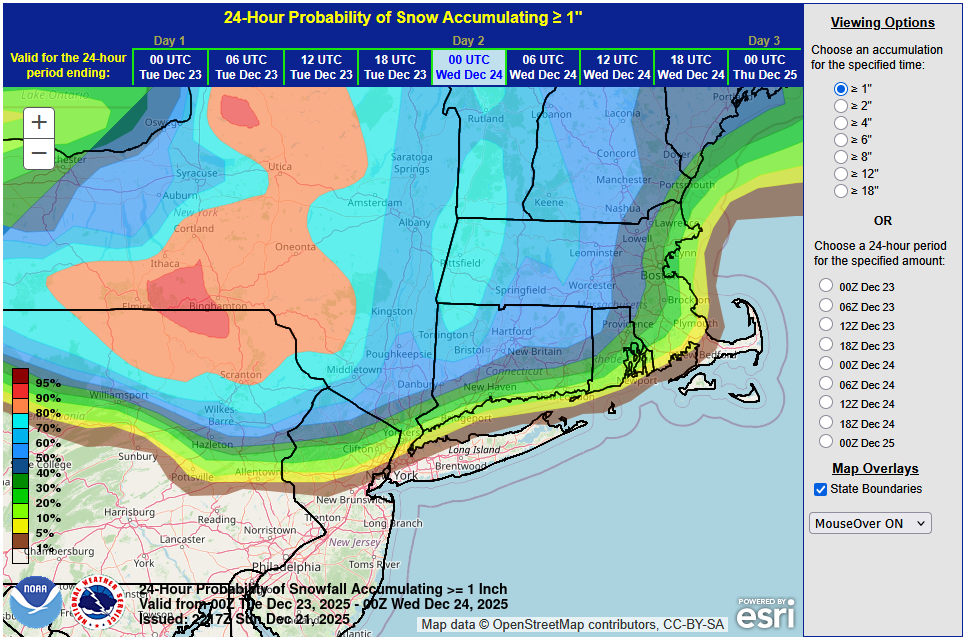
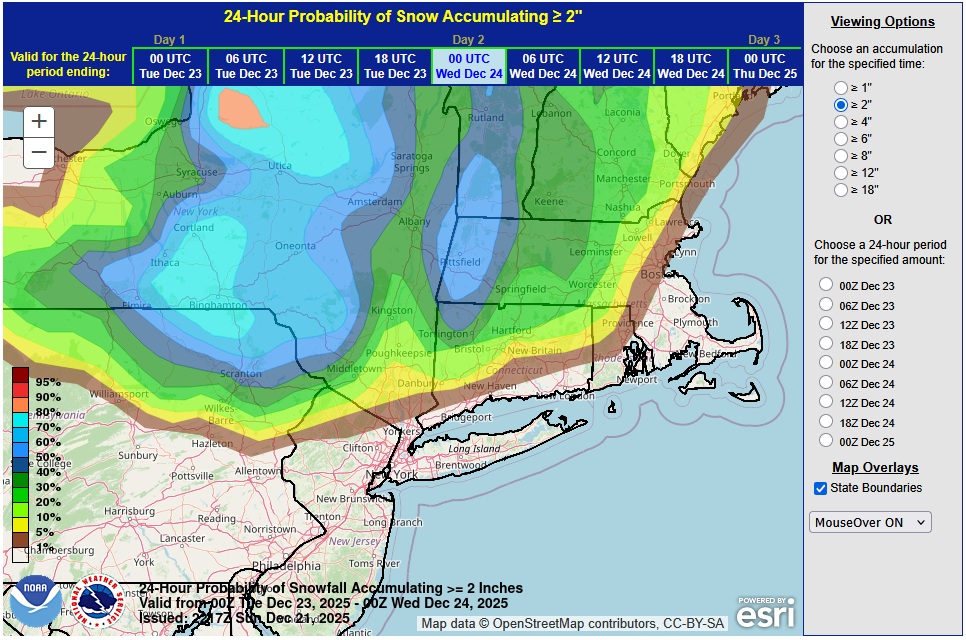
No changes in thinking at this time. With marginal temperatures and light precipitation rates, most of the New York City area will probably see little more than a coating. The City will likely see temperatures remain above freezing for most or all of the storm. A trace of snow cannot be ruled out for parts of the City. Nearly three-quarters of events with temperatures above freezing saw no measurable snowfall while just one-in-six had 1" or more in Central Park's climate record. It is possible that the precipitation could mix with or end as some light rain or drizzle in and around New York City. The distant northern and western suburbs continue to have the best chance of seeing 1"-2", as readings will likely be near or perhaps even a little below freezing during much of the event. The latest WPC maps for 24-hour probabilities of 1" or more and 2" or more snowfall are below:
-
The latest from the NWS:
-
Tomorrow will be a bit cooler with temperatures returning to the upper 30s. A weak system will bring some light snow or snow showers to the region on Tuesday. There is a chance that New York City could pick up a coating but a measurable snowfall is not a guaranteed outcome for the City. A 1"-2" snowfall is possible in the distant northern and western suburbs where it will be colder. The temperature will likely remain above freezing throughout the day on Tuesday. In New York City, only 25.6% of storms have seen measurable snowfall with a daily low of 33° or above with just 9.2% seeing 1" or more snowfall. Almost three-quarters (74.4%) of such events have seen only a trace of snowfall. No exceptionally cold or warm weather appears likely for the first week of astronomical winter. The closing week of December could experience periodic warmer and cooler days. The probability that December 2025 will have a maximum monthly temperature below 60° has increased further. The last time that happened was in 2019 when the monthly high was 58°. If 2025 has a monthly high below 60°, that would be only the fifth such occurrence since 2000 (2003, 2004, 2005, and 2019 are the cases since 2000). The ENSO Region 1+2 anomaly was -0.3°C and the Region 3.4 anomaly was -0.7°C for the week centered around December 10. For the past six weeks, the ENSO Region 1+2 anomaly has averaged -0.33°C and the ENSO Region 3.4 anomaly has averaged -0.67°C. La Niña conditions will likely continue through at least mid-winter. The SOI was +13.96 today. The preliminary Arctic Oscillation (AO) was +1.100 today. The PNA was -1.604. That is the lowest winter value since January 8, 2023 when the PNA stood at -1.618. Based on sensitivity analysis applied to the latest guidance, there is an implied near 100% probability that New York City will have a cooler than normal December (1991-2020 normal). December will likely finish with a mean temperature near 34.6° (4.5° below normal). Supplemental Information: The projected mean would be 2.8° below the 1981-2010 normal monthly value.