donsutherland1
-
Posts
23,988 -
Joined
Content Type
Profiles
Blogs
Forums
American Weather
Media Demo
Store
Gallery
Everything posted by donsutherland1
-
2025-2026 ENSO
donsutherland1 replied to 40/70 Benchmark's topic in Weather Forecasting and Discussion
The ongoing PNA- will eventually end, even if the 0z GEFS sustains it through its forecast period. Once that happens, recent historical experience (since 1980) suggests that the PNA will likely undergo a regime change to mainly positive values. The same kind of regime change took place for all 10 25-day or longer streaks that began in November or December.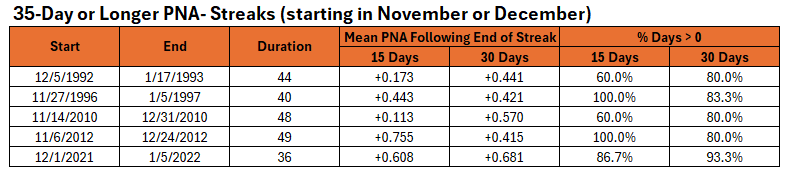
-
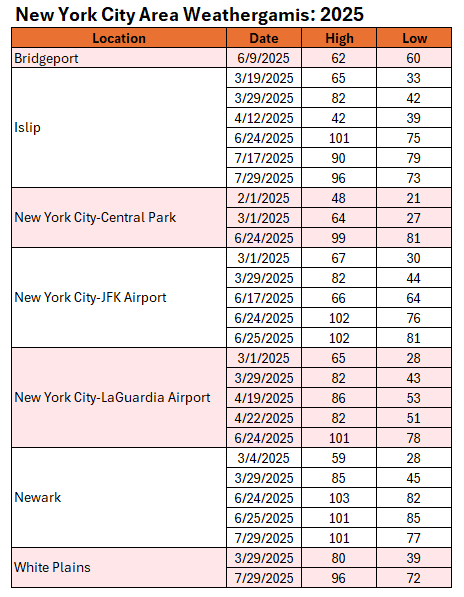
A weathergami is a unique high-low combination in a city's climate record. This year's weathergamis in the New York City area are below:
-
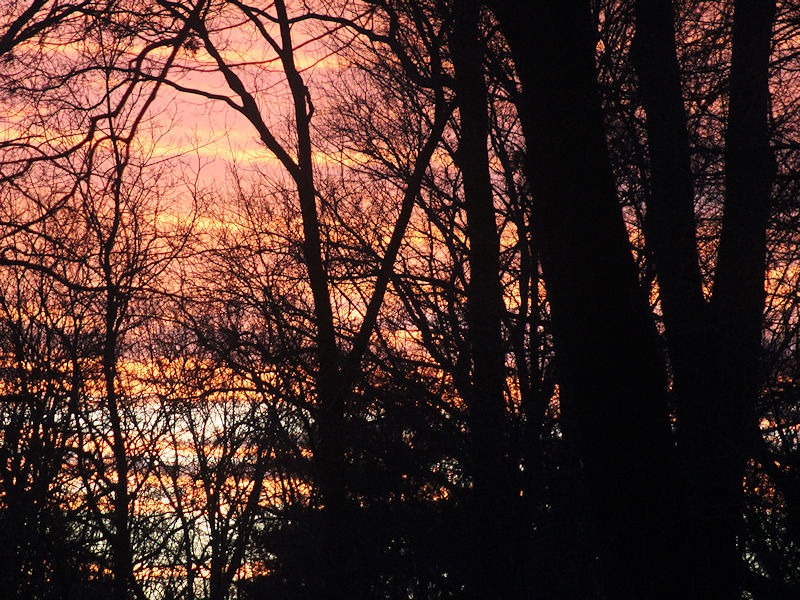
Clouds are now breaking near sunset.
-
Clouds will continue to break from west to east this evening, as colder air moves back into the region. Tomorrow and Wednesday will see cooler than normal days. Below normal temperatures will continue into at least the middle of the first week of January. Some flurries or snow showers are possible late on Thursday into Friday. The first week of January will likely have a mean temperature below 30° in New York City. The last time that happened was in 2018. The only years since 2000 with a sub-30° mean temperature for the opening week of January were 2001, 2010, 2014 and 2018. December 2025 is on course to finish with a maximum monthly temperature below 60° in New York City. The last time that happened was in 2019 when the monthly high was 58°. This will be only the fifth such occurrence since 2000 (2003, 2004, 2005, and 2019 are the cases since 2000). The ENSO Region 1+2 anomaly was -0.3°C and the Region 3.4 anomaly was -0.7°C for the week centered around December 24. For the past six weeks, the ENSO Region 1+2 anomaly has averaged -0.33°C and the ENSO Region 3.4 anomaly has averaged -0.68°C. La Niña conditions will likely continue into at least late winter. The SOI was +3.94 today. The preliminary Arctic Oscillation (AO) was -2.053 today. Based on sensitivity analysis applied to the latest guidance, there is an implied near 100% probability that New York City will have a cooler than normal December (1991-2020 normal). December will likely finish with a mean temperature near 33.8° (5.3° below normal). That will make December 2025 the coldest December since 2010 when the monthly mean temperature was 32.8°. It would also make 2025 the third coldest December since 2000. Supplemental Information: The projected mean would be 3.6° below the 1981-2010 normal monthly value.
-
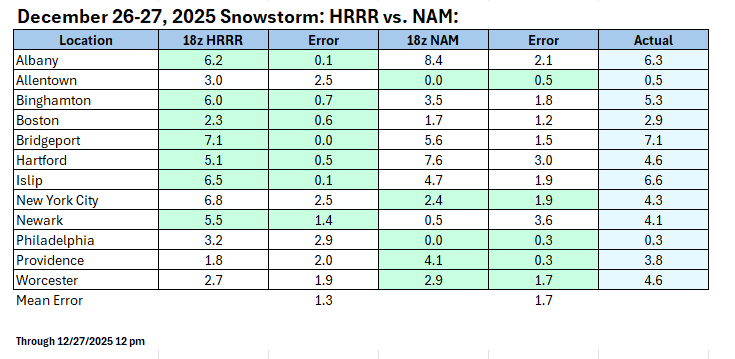
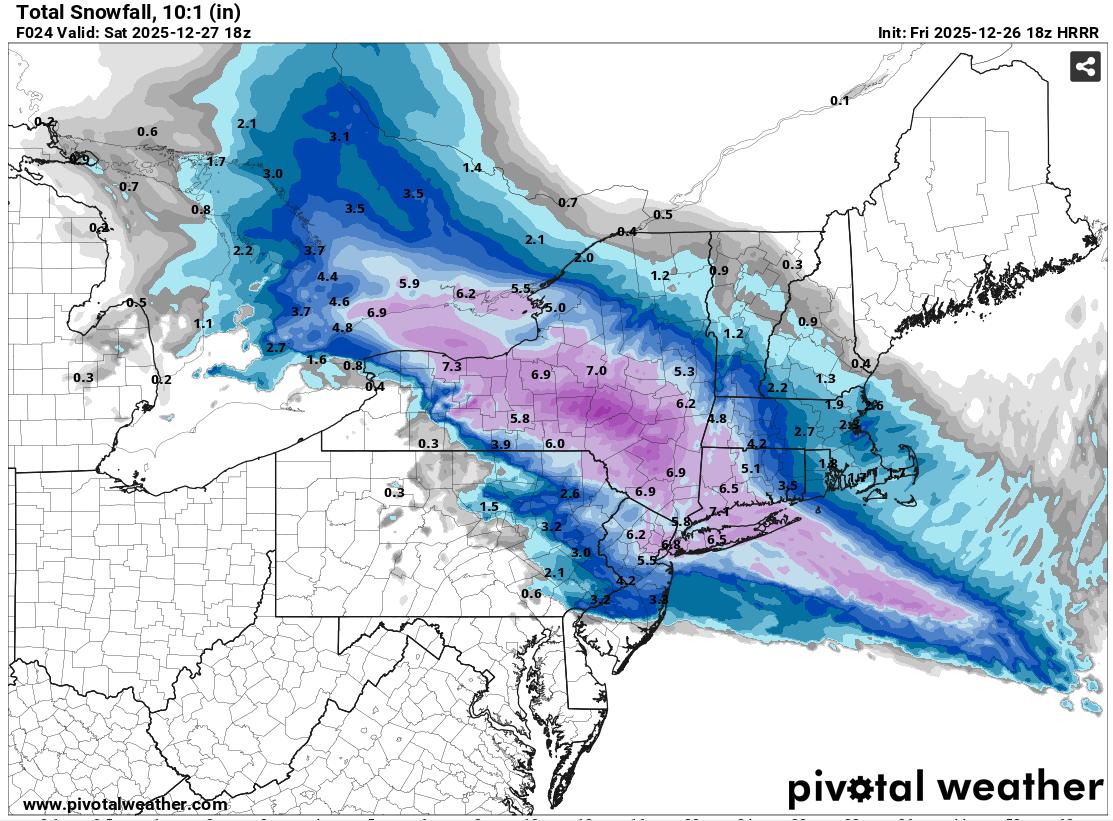
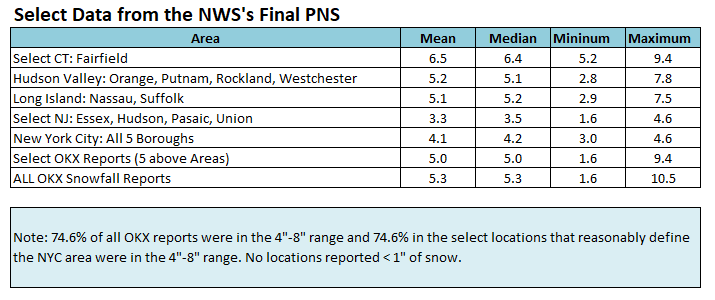
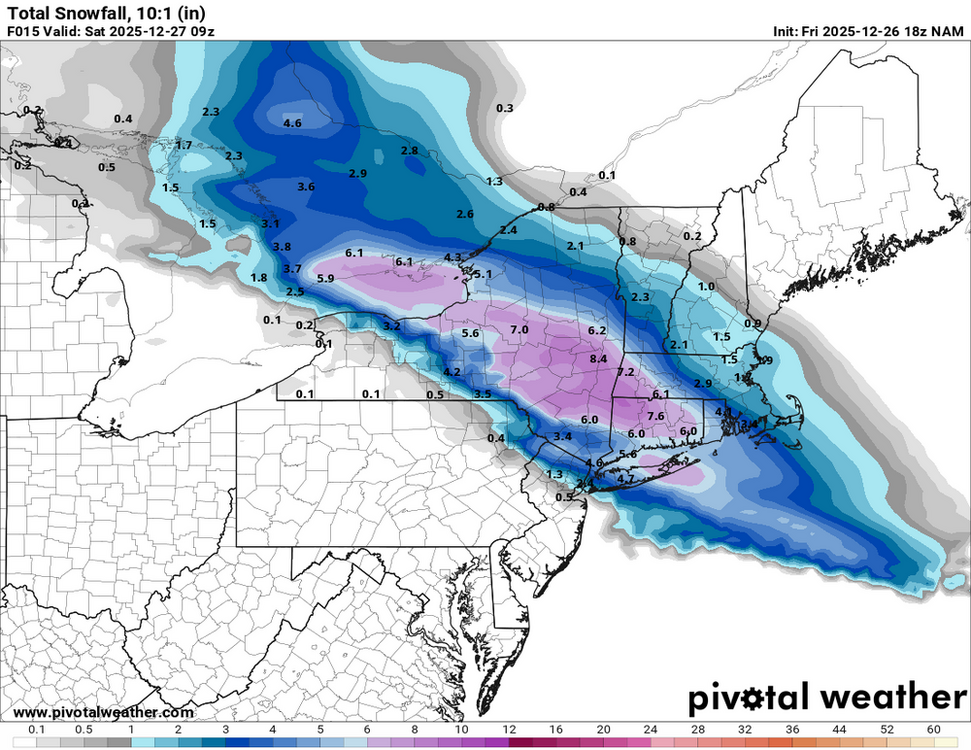
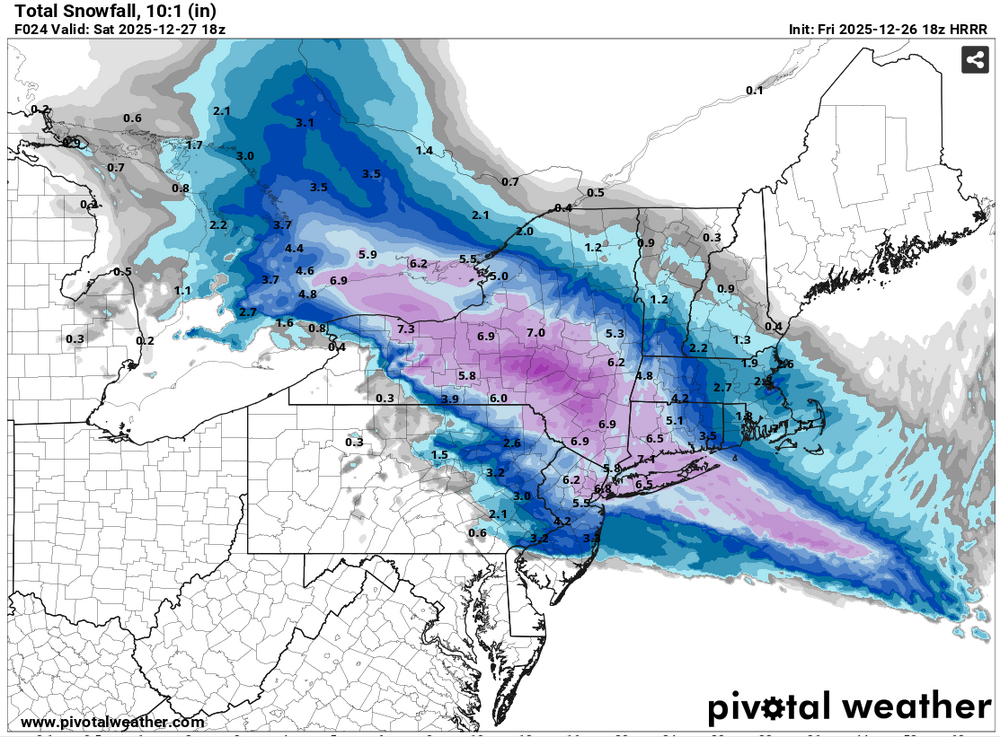
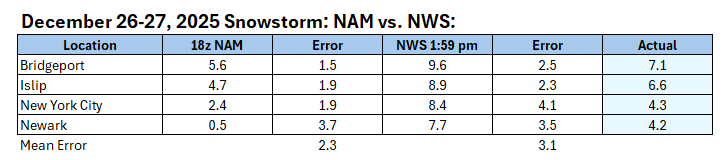
I had used the initial map posted by MJO812 for the benchmark. Even with the adjustment for the the additional snowfall, the outcome changes very little. The NAM has had successes. This wasn't one around the New York City area, which was the focus of the discussion/model comparison, when it came to snowfall amounts leading up to the storm. The HRRR overdid some of the totals for New York City and Newark. It seems to have a cold bias. In the end, over several days of guidance, it was clear that this was going to be a 3"-6"/4"-8" storm for the New York City area. There was no real drama for this area. The RRFS A's attempts at suppression, NAM's swings/amounts for NYC-EWR, and GFS's elevated amounts were noise. IMO, this was probably among the more straightforward forecasting situations in recent snowstorms for the City and its nearby suburbs. That outcome shows up well in NWS-New York's (OKX's) final PNS report where almost 75% of all snowfall reports fell in the 4"-8" range and nearly two-thirds were in the 3"-6" range. This will be my last comment on the NAM for the December 26-27 storm. The numbers speak for themselves.

-
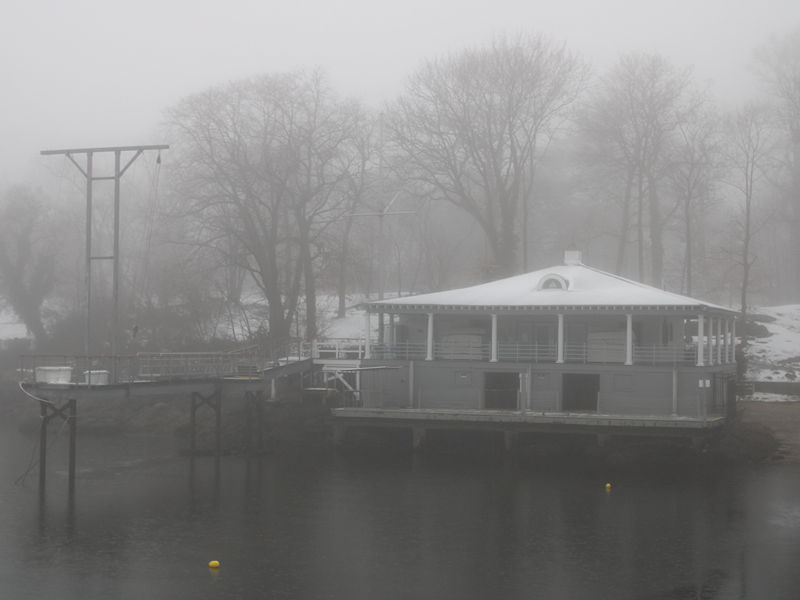
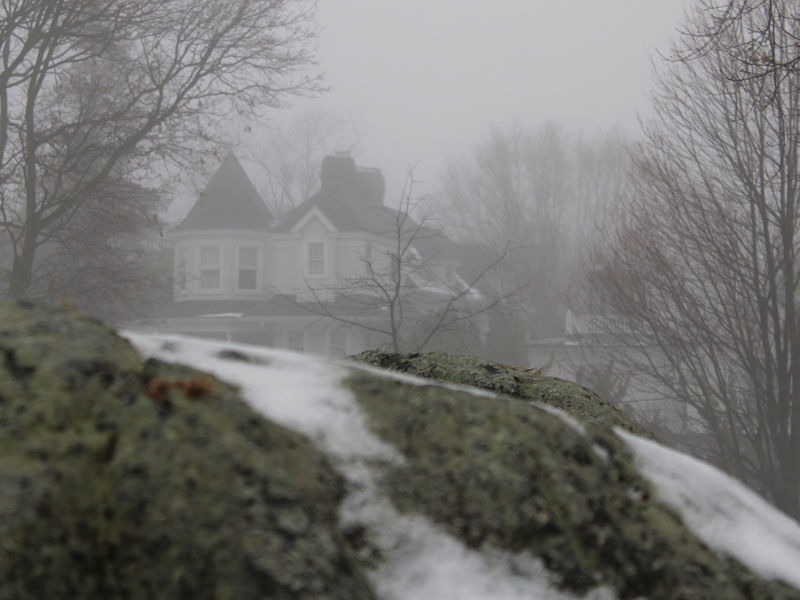
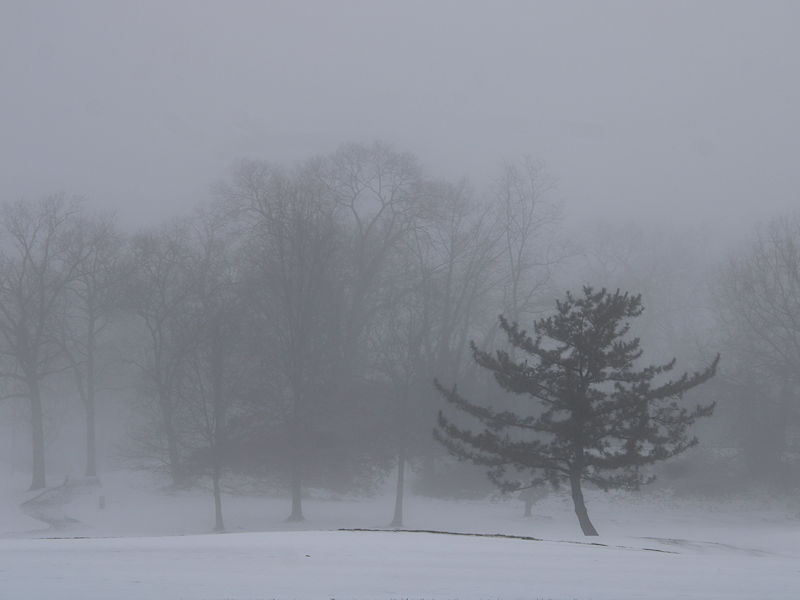
Some morning fog as the warm, moist air as moved over snow-covered landscape.
-
2025-2026 ENSO
donsutherland1 replied to 40/70 Benchmark's topic in Weather Forecasting and Discussion
The timing of the development of a PNA+ remains perhaps where the greatest uncertainty concerning the teleconnections lies. The EPS still developes a PNA+. A prolonged delay would risk breaking the colder pattern, especially if the WPO and EPO both go positive. If the AO goes positive along with the WPO and EPO while the PNA stays negative, that's a classic very warm pattern. For now, that doesn't seem to be a highly likely outcome, at least for the first half of January. -
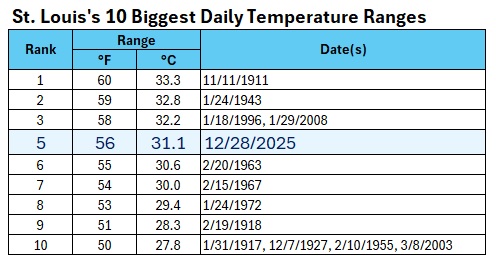
St. Louis had its fifth biggest daily temperature range on record yesterday, as the mercury plunged from a December monthly record 78F (25.6C) to 22F (-5.6C). That was the largest daily temperature range on record for December.
-
I posted the maps for both models. The numbers are from the maps. Nothing is derived. Bufkit computes snow using 4 algorithms and uses 1:1 for sleet.
-
Ice Ice Baby December 28-29 Storm Discussion
donsutherland1 replied to Baroclinic Zone's topic in New England
Hopefully, it won’t be quite as bad as shown. That’s a terrible amount of ice. -
Wonderful find.
-
Light rain and some freezing rain is moving into the region. Areas north and west of New York City have the highest likelihood of seeing some freezing rain. Tomorrow will see some additional showers. The temperature will likely reach the upper 40s to perhaps lower 50s before colder air moves in. It will also turn very windy with gusts reaching 40 mph to 50 mph at times. The remainder of December will see cooler than normal days. Below normal temperatures will continue into at least the middle of the first week of January. Some flurries or snow showers are possible late on January 1 into January 2. December 2025 is on course to finish with a maximum monthly temperature below 60° in New York City. The last time that happened was in 2019 when the monthly high was 58°. If 2025 has a monthly high below 60°, that would be only the fifth such occurrence since 2000 (2003, 2004, 2005, and 2019 are the cases since 2000). The ENSO Region 1+2 anomaly was -0.6°C and the Region 3.4 anomaly was -0.8°C for the week centered around December 17. For the past six weeks, the ENSO Region 1+2 anomaly has averaged -0.40°C and the ENSO Region 3.4 anomaly has averaged -0.68°C. La Niña conditions will likely continue through at least mid-winter. The SOI was +9.19 today. The preliminary Arctic Oscillation (AO) was -1.799 today. Based on sensitivity analysis applied to the latest guidance, there is an implied near 100% probability that New York City will have a cooler than normal December (1991-2020 normal). December will likely finish with a mean temperature near 33.9° (5.2° below normal). That will make December 2025 the coldest December since 2010 when the monthly mean temperature was 32.8°. It would also make 2025 the third coldest December since 2000. Supplemental Information: The projected mean would be 3.5° below the 1981-2010 normal monthly value.
-
This is from Rye, NY looking across the Sound on a cloudy day.
-
2025-2026 ENSO
donsutherland1 replied to 40/70 Benchmark's topic in Weather Forecasting and Discussion
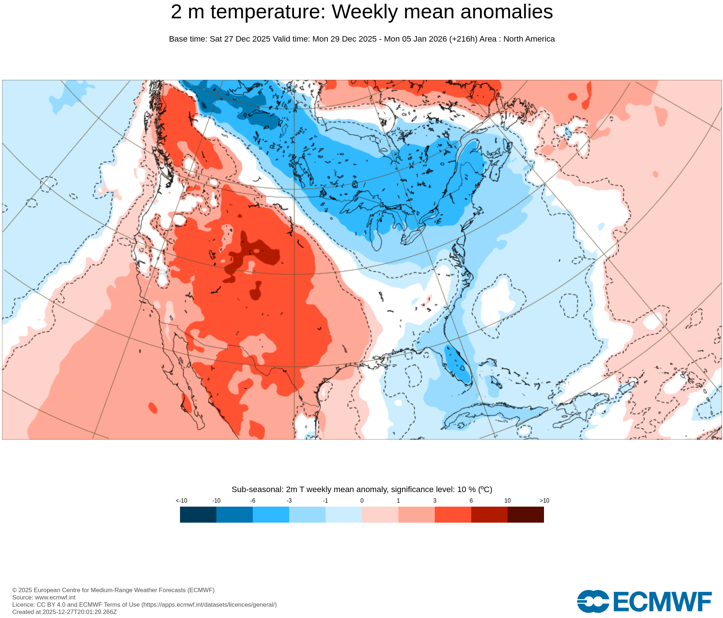
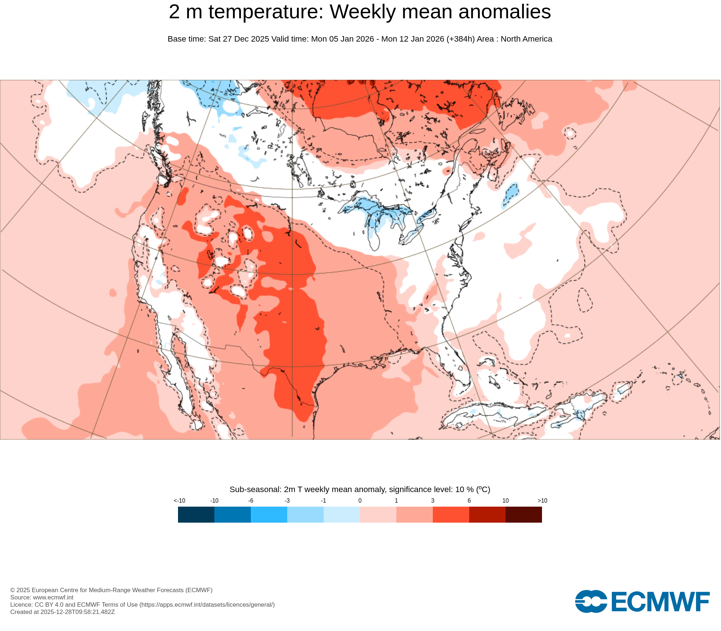
January looks to get off to a cool start in the eastern U.S. and Great Lakes Region. The Southwest will likely remain abnormally warm for at least the opening of January. The latest EPS teleconnection forecast calls for the development of a predominant WPO+/EPO+/AO-/PNA+ pattern. It may take some time for the PNA+ to develop. That's probably where the greatest uncertainty lies. An alternative scenario involves a continuation of the WPO-/PNA- in combination with the EPO+/AO-. If the PNA+ fails to develop and the WPO goes positive, warmth could develop on a larger scale across North America with the cold being limited to mainly Alaska and Canada. That is currently a low probability outcome but a wildcard that can't be dismissed. EPS 9-13 Day Outlook: WPO+/EPO+/AO-/PNA+ (January 1-10, 1980-2025): ECMWF Weeklies (December 29-January 5): ECMWF Weeklies (January 5-January 12): The development of a predominant WPO+/EPO+/AO-/PNA+ pattern is the baseline scenario. Despite some social media rumors of a big snowstorm in parts of the East during the first 7-10 days of January, the forecast teleconnections typically do not favor large East Coast snowstorms. Instead, they favor lighter snows. For reference, New York City had no 6" or above snowstorms during January 1-10, 1950-2025 with a WPO+/EPO+/AO-/PNA+ pattern.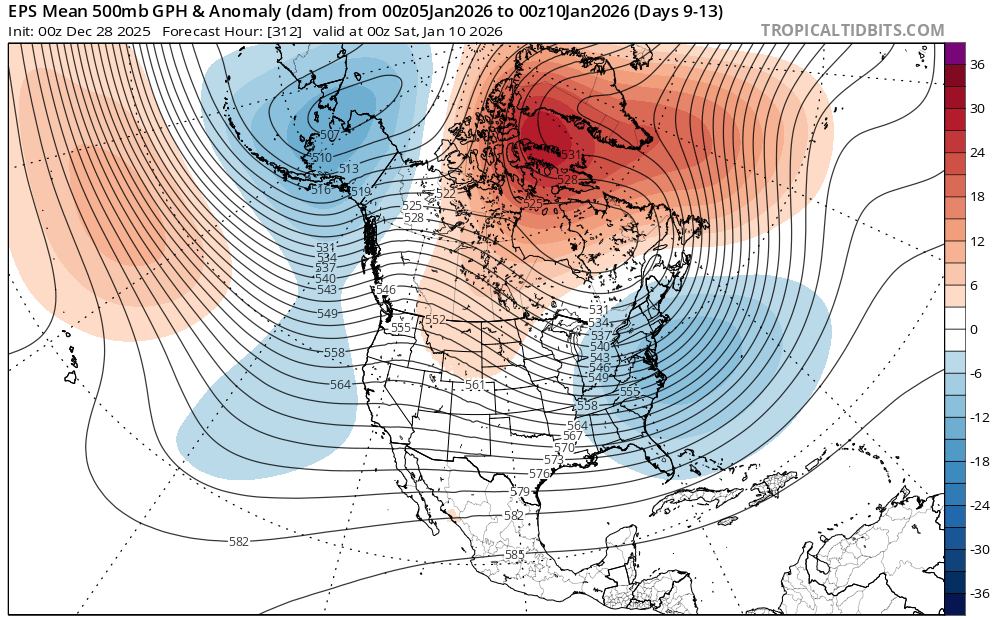
-
I also used Bufkit. Its numbers for EWR were absurdly low. One can get a good picture of the snow growth and insight into ratios from its soundings. The focus for me was the NYC region given the subforum involved. The NAM did not do well in this subforum. I don’t always disregard it, but in this case I did. It was an outlier even against the vast majority of individual EPS and GEFS ensemble members. That’s what led me to dismiss it. It is quite rare where the ensembles don’t capture the cluster of reasonable solutions, one of which ultimately verifies. The GFS was overdone. For several days, it was clear that the NYC area was in line for a 3”-6”/4”-8” snowfall regardless of the earlier RRFS A runs and the NAM’s solutions. The only real drama was for areas south and west of NYC and areas in parts of New England.
-
On Pivotal, the numbers don't count sleet. On Tropical Tidbits, they do, but sleet is treated the same as snowfall, which inflates the totals. Both approaches lead to inaccuracy, since snowfall figures are the sum of snow and sleet.
-
Here you go:
-
New York City's largest snowstorm since January 28-29, 2022 has now departed. Even as precipitation dried up for several hours last evening, Central Park still wound up with 4.3" of snow while JFK Airport, LaGuardia Airport, and Newark all saw 4" or more of snow. Many parts of southwestern Connecticut and Long Island saw 6" or more. Tomorrow will turn somewhat milder as a storm heads for the Great Lakes. Showers and possibly periods of rain will develop late tomorrow and continue into early Monday. The temperature will likely reach the upper 40s to perhaps lower 50s on Monday before colder air moves in behind the departing system. The remainder of December will see cooler than normal days. Below normal temperatures will continue into at least the middle of the first week of January. Some flurries or snow showers are possible late on January 1 into January 2. December 2025 will very likely finish with a maximum monthly temperature below 60° in New York City. The last time that happened was in 2019 when the monthly high was 58°. If 2025 has a monthly high below 60°, that would be only the fifth such occurrence since 2000 (2003, 2004, 2005, and 2019 are the cases since 2000). The ENSO Region 1+2 anomaly was -0.6°C and the Region 3.4 anomaly was -0.8°C for the week centered around December 17. For the past six weeks, the ENSO Region 1+2 anomaly has averaged -0.40°C and the ENSO Region 3.4 anomaly has averaged -0.68°C. La Niña conditions will likely continue through at least mid-winter. The SOI was +14.69 today. The preliminary Arctic Oscillation (AO) was -1.006 today. Based on sensitivity analysis applied to the latest guidance, there is an implied near 100% probability that New York City will have a cooler than normal December (1991-2020 normal). December will likely finish with a mean temperature near 33.9° (5.2° below normal). That will make December 2025 the coldest December since 2010 when the monthly mean temperature was 32.8°. It would also make 2025 the third coldest December since 2000. Supplemental Information: The projected mean would be 3.5° below the 1981-2010 normal monthly value.
-
Against the NWS? I will run them when I get back in this evening. This wasn’t the NWS’s finest forecast.
-
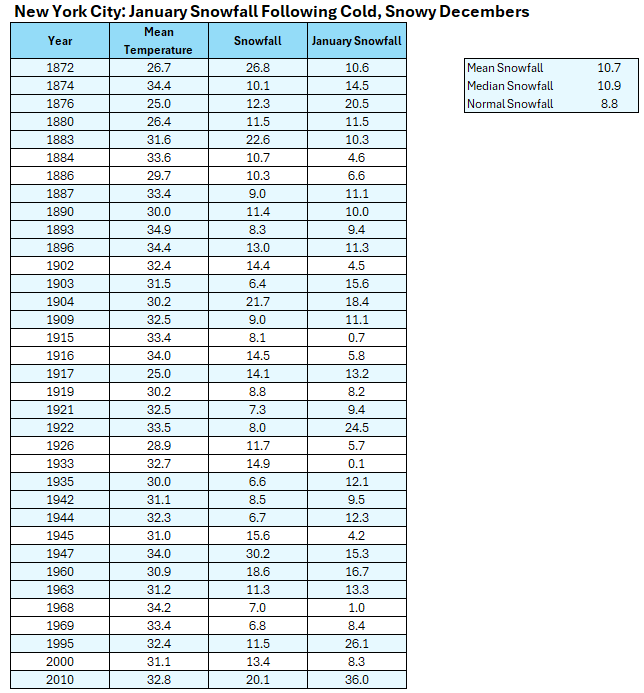
1917 also had a mean temperature of 25.0° for December Corrected Table: Note: The initial table was constructed from summing daily snowfall amounts. Not all daily amounts are in the NYC climate record. Thus, doing so understates the monthly figures. Here's the correct table using the monthly figures.
-
Yes, the La Niña cases were snowier.
-
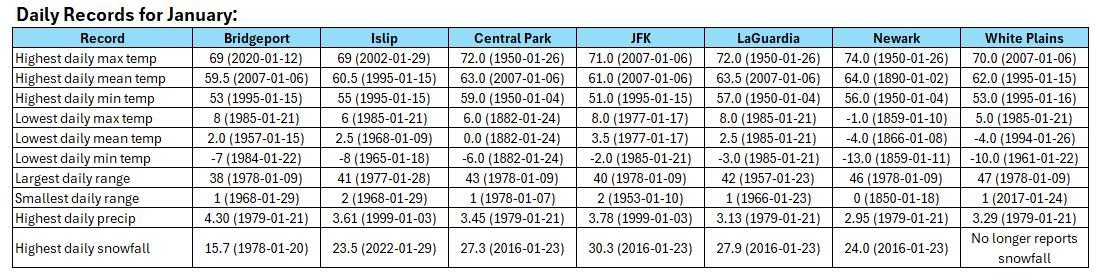
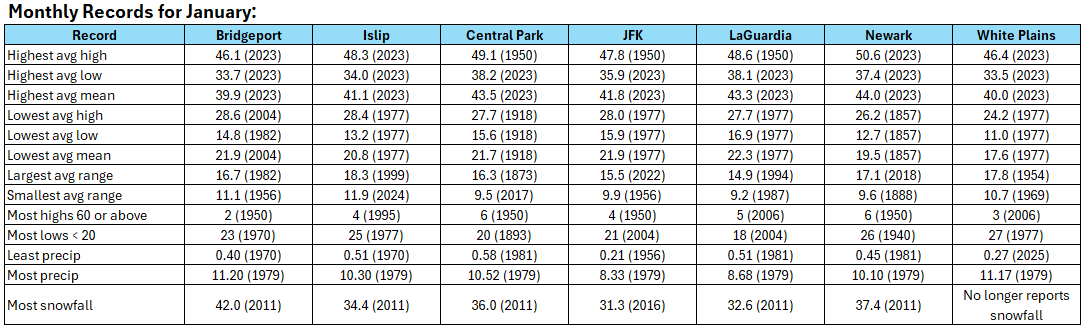
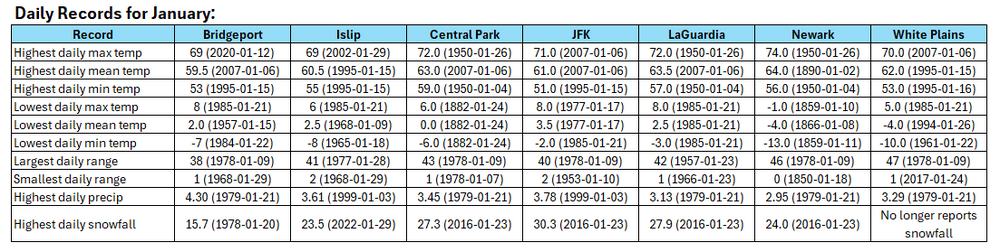
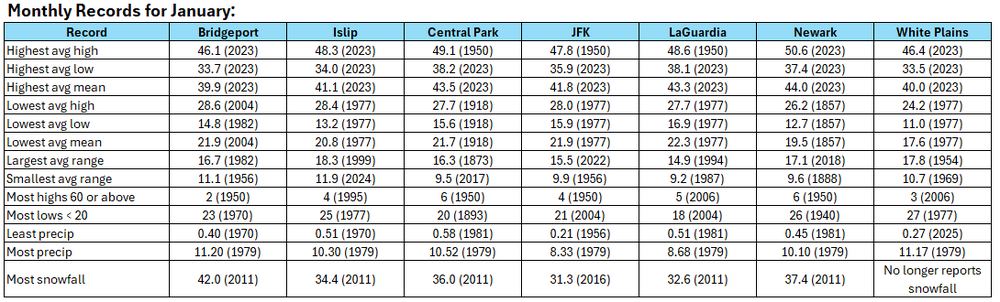
January records for the New York City area:
-
With preliminary PNA values of -1.000 or below both yesterday and today, the snowstorm that just brought 4.3" to Central Park could become New York City's largest December snowfall with PNA values of -1.000 or below for all days during which the snow fell.
-
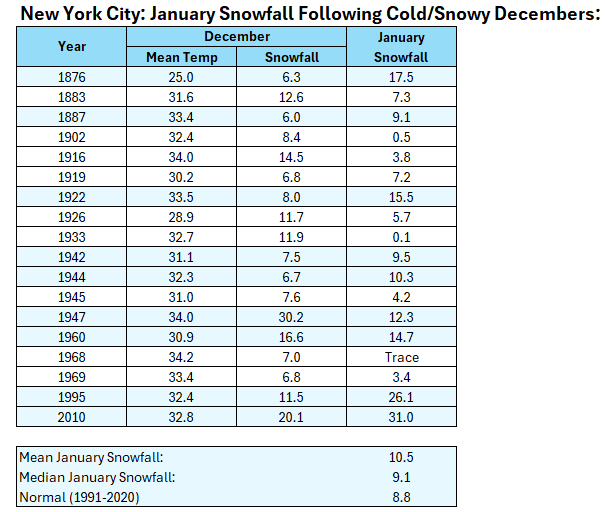
December 2025 will finish with a mean temperature below 35.0°C (coldest since 2010) and more than 6" of monthly snowfall. Below is how January fared in terms of snowfall following cold and snowy Decembers.
-
As forecasting accuracy requires, among other things, an objective assessment of the guidance, I've expanded the comparison of the 12/26 18z NAM and 12/26 18z HRRR. The major point of contention had been whether the NAM was providing a realistic forecast for the New York City area. It did not fare well. But what over a larger area? Again, the HRRR outperformed the NAM, but its forecasting edge was less decisive. The HRRR was better in assessing where the 4" or above snows would fall from New York City southward. The NAM confined such snows to the north and east of New York City. However, the HRRR was too aggressive in pushing 2"+ snows past Allentown and into Philadelphia. The HRRR also did better in such locations as Albany and Boston. 12/26 18z NAM: 12/26 18z HRRR: Outcomes for 12 Cities: