donsutherland1
-
Posts
24,181 -
Joined
Content Type
Profiles
Blogs
Forums
American Weather
Media Demo
Store
Gallery
Everything posted by donsutherland1
-
Light freezing rain has commenced in Larchmont, NY. A few sleet pellets are mixed in.
-
Beyond two weeks, predictability of the AO is not great. And it’s just one variable in the mix.
-
A period of light precipitation is likely tonight into tomorrow. Little or no snow accumulation (0.5" or less) is likely in Philadelphia, Newark, and New York City. Some freezing rain is possible, with larger amounts north and west of those cities. Additional storms will very likely impact the region next week. Parts of the Northern Plains and Canada experienced a continuation of record and near record cold temperatures from what has been the coldest air mass since February 1994 in parts of that region. Minimum temperatures included: Duluth: -35° (old record: -29°, 1905) ***Coldest since February 2, 1996*** Estevan, SK: -37° (old record: -31°, 1970) Flin Flon, MB: -44° (old record: -38°, 1974) International Falls, MN: -42° (old record: -39°, 1909) Norway House, MB: -48° (old record: -38°, 2008) Prince Albert, SK: -43° (old record: -41°, 1951) Regina: -37° Saskatoon: -34° The Pas, MB: -43° (old record: -34°, 2008) Thompson, MB: -46° (old record: -45°, 2014) Winnipeg: -36° (old record: -34°, 1949) That frigid air will continue to slowly advance south and eastward through the remainder of this weekend. This will lead to snow and record-breaking cold in Texas. Select Record Low Maximum Temperatures for February 14: Austin: 33°, 1951 Brownsville: 44°, 1951 Corpus Christi: 30°, 1895 Dallas: 27°, 1951 Select Record Low Minimum Temperatures for February 14: Austin: 10°, 1899 Brownsville: 18°, 1899 Corpus Christi: 26°, 1895 Dallas: 15°, 1905, 1909, 1936 Select Snowfall Records for February 14: Austin: 1.6", 2004 Dallas: 3.0", 1951 Dallas will likely see temperatures fall to the single digits and likely the coldest levels on record so late in the season. On Monday, the high temperature at Dallas could also challenge that city's record for the lowest maximum temperature on record. That record is 12°, which was set on February 12, 1899.However, this air mass will likely avoid any direct impact on the Middle Atlantic and New England areas. A piece of the air mass could still graze the region at some point next week. The Arctic Oscillation (AO) is now rebounding from its lowest levels in nearly eight years. It is forecast to rise sharply in coming days. The latest guidance suggests that the AO could attain positive values for the first time since December 25, 2020 when the AO was +0.226. This development will likely lead to at least a period of above normal temperatures in the East. Whether it will mark the end of the prolonged period of blocking that has prevailed throughout winter 2020-21, or a temporary break, remains to be seen. A dramatic increase in the AO has sometimes coincided with storminess. Therefore, the February 14-24 period might offer a window of opportunity for a meaningful storm. That window of opportunity could extend through the end of February should blocking persist or return. Since 1950, there were 11 cases during the January 16-February 28 timeframe that saw the AO rise at least 3 sigma from a minimum value of -4.000 or below within a 7-day period. Four cases saw a major snowstorm in parts of the Middle Atlantic or New England regions within 3 weeks of the AO's reaching its minimum value. The dates of the AO's minimum value for those four cases with storm dates in parentheses are January 25, 1958 (February 14-17, 1958 NESIS: 6.25), January 19, 1969 (February 8-10, 1969 NESIS: 3.51), February 15, 1969 (February 22-28, 1969 NESIS: 4.29), and January 16, 2016 (January 22-24, 2016 NESIS: 7.66). The ENSO Region 1+2 anomaly was -0.2°C and the Region 3.4 anomaly was -0.7°C for the week centered around February 3. For the past six weeks, the ENSO Region 1+2 anomaly has averaged -0.65°C and the ENSO Region 3.4 anomaly has averaged -1.00°C. La Niña conditions will likely prevail at least through meteorological winter. The SOI was +2.69 today. The preliminary Arctic Oscillation (AO) figure was -3.177 today On February 12 the MJO was in Phase 7 at an amplitude of 2.610 (RMM). The February 11-adjusted amplitude was 2.131. Based on the latest guidance, no significant stratospheric warming event is likely through the end of the third week of February. The significant December 16-17 snowstorm during what has been a blocky December suggests that seasonal snowfall prospects have increased especially from north of Philadelphia into southern New England. At New York City, there is a high probability based on historic cases that an additional 20" or more snow will accumulate after December. Since January 1, New York City has picked up 23.3" snow. Winters that saw December receive 10" or more snow, less than 10" in January, and then 10" or more in February, saw measurable snowfall in March or April in 83% of cases. Winter 2009-2010 was the exception where only a trace of snow was recorded. This group of winters saw 6" or more snow during the March-April period in 50% of the cases. All said, it is more likely than not that there will be measurable snowfall after February. Based on sensitivity analysis applied to the latest guidance, there is an implied 83% probability that New York City will have a colder than normal February. February will likely finish with a mean temperature near 32.4° (2.9° below normal).
-
It depends on how much predictability one is looking for. The statistical evidence is fairly clear that snowfall is more frequent during negative AO states in the New York City area (and also Middle Atlantic Region). For all days in December, January, February, and March from January 1, 1950 through January 31, 2021, there were 4,628 days (53.6% days) when the AO was negative, including 2,945 (34.1% days) when it was -1.000 or below. There were 4,008 days (46.4% days) when the AO was positive, including 2,337 days (27.0% days) with values of +1.000 or above. On three days, the AO was 0.000. Below is the share of total January-March and December snowfall for New York City: AO of -1.000 or below: 41.9% of snowfall (34.1% days): Overrepresented AO-: 61.6% of snowfall (53.6% days): Overrepresented AO+: 38.4% of snowfall (46.4% days): Underrepresented AO of +1.000 or above: 20.1% of snowfall (27.0% days): Underrepresented. In addition, days with measurable snowfall were 28% more frequent when the AO was negative than when it was positive and 42% more frequent at values of -1.000 or below than when it was positive. In terms of daily snowfall of 4" or more, those outcomes were 48% more frequent when the AO was negative than when it was positive and 58% more frequent when the AO was -1.000 or below than when it was positive. If one compares AO cases of -1.000 or below vs. AO cases of +1.000 or above, days with measurable snowfall and days with 4" or more snowfall were 43% and 75% more frequent respectively. For a more recent illustration, for the last five February cases (through February 13, 2021), there were 31 days (31.6% days) during which the AO was negative and 67 days (68.4% days) when it was positive. During the AO- days, there was 25.6" snow (89.2% snow) and 3.1" snow (10.8% snow) when the AO was positive. Even excluding February 2021 on account of the big storm, 58.7% of the snow was recorded during the 21.1% of days when the AO was negative while 41.3% of the snowfall was recorded during the 78.9% of days when the AO was positive. In short, a negative AO, especially one at -1.000 or below, provides a favorable large-scale state for snowfall overall in the Middle Atlantic Region. However, the synoptic details matter. The placement of synoptic features and their evolution occur within the large-scale hemispheric background state and are, at least in part, influenced by the AO.
-
That’s why I did not cite it. On one day,(2/24), ISP was shown to have received 11.0” snow on 0.11” precipitation. The correct figure almost certainly is 1.1”, as snow cover rose from 0” to 1”.
-
A due north wind spends more time over the Long Island Sound for JFK than it does for LGA.
-
March 29.
-
Mostly rain. NYC saw 1.3”, JFK received 1.6”, and LGA picked up 2.0”.
-
Sometimes, such storms favor New England e.g., the late February 1969 snowstorm.
-
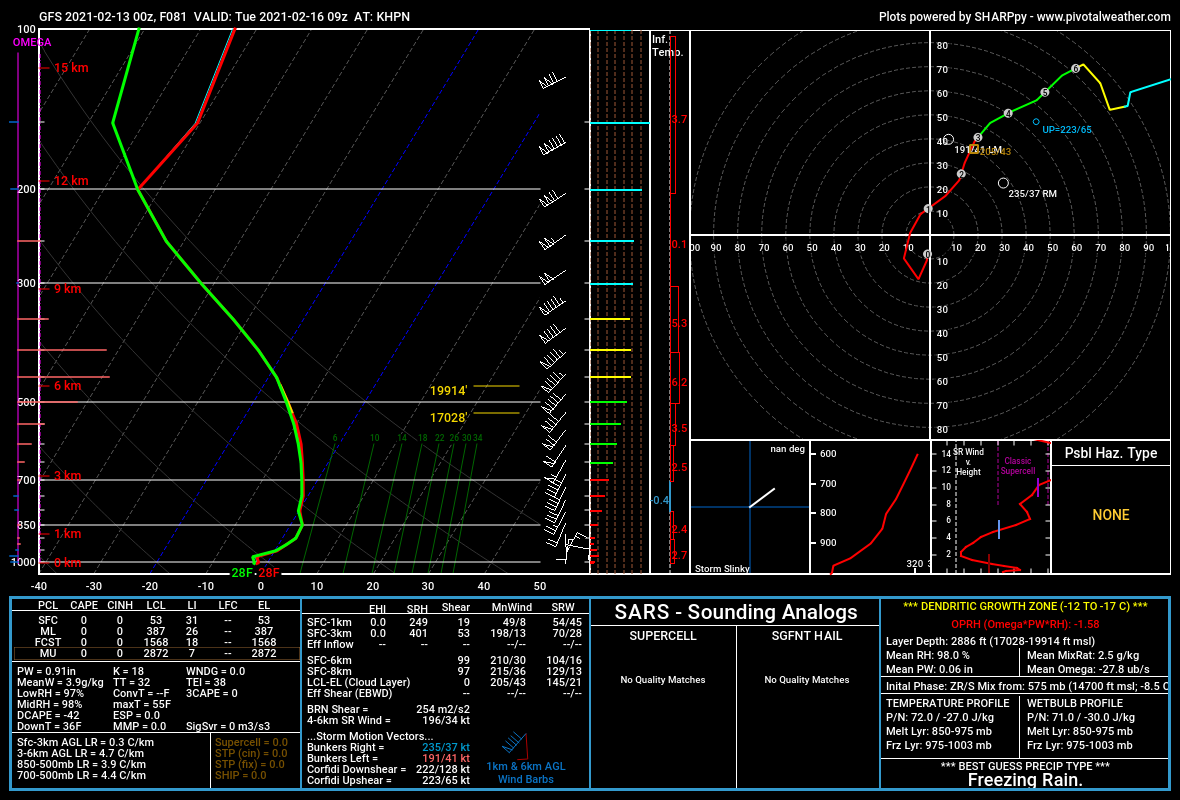
Morning thoughts... A weak system will move rapidly from the Gulf of Mexico off the Virginia Capes over the next 24 hours bringing some light precipitation to the region. With a warm layer at 800 mb to 850 mb, most of the precipitation will not fall as snow. Today will be mostly cloudy and unseasonably cool. Light snow, sleet or freezing rain will develop in parts of the region later this afternoon or evening. Any snow accumulations from Philadelphia to New York City will be minimal (0.5” or less). Temperatures will likely top out in the upper 20s to perhaps lower 30s in most of the region. Likely high temperatures around the region include: New York City (Central Park): 29° Newark: 29° Philadelphia: 30° Tomorrow will likely see additional light precipitation. In the long-range, there is growing consensus among the ensembles that a sustained milder pattern will develop around or just after February 20.
-
2/13 0z GFS at 81 hours for HPN: Icy

-
It’s posted on the NWS Eastern Region Headquarters Facebook page: https://m.facebook.com/pg/NWSEastern/posts/?ref=page_internal&mt_nav=0
-
Yes. It was -3 on January 19, 1994.
-
The winters where December had 10” or more snow, January had less than 10”, and February had 10” or more.
-
It was probably enough, as the cold air advection wasn’t quite sufficient to push the mercury below zero. And, the colder air was also passing across a part of the Long Island Sound to the north.
-
Today was fair but cold in the northern Middle Atlantic and southern New England regions. The ongoing colder-than-normal regime will continue through the weekend. A period of light precipitation is likely tomorrow night into Sunday. Little or no snow accumulation (0.5" or less) is likely in Philadelphia, Newark, and New York City. Some freezing rain is possible, with larger amounts north and west of those cities. Additional storms will very likely impact the region next week. Meanwhile, parts of the Northern Plains and Canada experienced a continuation of record and near record cold temperatures from what has been the coldest air mass since February 1994 in parts of that region. Minimum temperatures included: Cut Bank, MT: -38° (old record: -32°, 1936) ***Coldest reading since February 8, 1994*** Estevan, SK: -29° (old record: -28°, 1951) Flin Flon, MB: -45° (old record: -41°, 1981) Gillam, MB: -43° Great Falls, MT: -33 (old record: -21°, 1936) Lynn Lake, MB: -43° (old record: -39°, 2008) Norway House, MB: -44° (old record: -24°, 2008) The Pas, MB: -40° (old record: -38°, 1946) Thompson, MB: -50° (old record: -45°, 1979) Timmins, ON: -31° Williams Lake, BC: -25° (old record: -18°, 1975) Winnipeg: -27° That frigid air will continue to slowly advance south and eastward through this weekend. This will lead to snow and record-breaking cold in Texas. Dallas will likely see temperatures fall to the single digits and likely the coldest levels on record so late in the season. However, this air mass will likely avoid any direct impact on the Middle Atlantic and New England areas. A piece of the air mass could still graze the region at some point next week. The Arctic Oscillation (AO) is now rebounding from its lowest levels in nearly eight years. It is forecast to rise sharply in coming days. The latest guidance suggests that the AO could attain positive values for the first time since December 25, 2020 when the AO was +0.226. Whether this development will mark the end of the prolonged period of blocking that has prevailed throughout winter 2020-21, and the evolution toward a sustained milder pattern, remains to be seen. A dramatic increase in the AO has sometimes coincided with storminess. Therefore, the February 14-24 period might offer a window of opportunity for a meaningful storm. That window of opportunity could extend through the end of February should blocking persist or return. Since 1950, there were 11 cases during the January 16-February 28 timeframe that saw the AO rise at least 3 sigma from a minimum value of -4.000 or below within a 7-day period. Four cases saw a major snowstorm in parts of the Middle Atlantic or New England regions within 3 weeks of the AO's reaching its minimum value. The dates of the AO's minimum value for those four cases are January 25, 1958, January 19, 1969, February 15, 1969, and January 16, 2016. The ENSO Region 1+2 anomaly was -0.2°C and the Region 3.4 anomaly was -0.7°C for the week centered around February 3. For the past six weeks, the ENSO Region 1+2 anomaly has averaged -0.65°C and the ENSO Region 3.4 anomaly has averaged -1.00°C. La Niña conditions will likely prevail at least through meteorological winter. The SOI was +6.15 today. Today, the preliminary Arctic Oscillation (AO) figure was -4.597 today. On February 11 the MJO was in Phase 7 at an amplitude of 2.131 (RMM). The February 10-adjusted amplitude was 2.075. Based on the latest guidance, no significant stratospheric warming event is likely through the end of the third week of February. The significant December 16-17 snowstorm during what has been a blocky December suggests that seasonal snowfall prospects have increased especially from north of Philadelphia into southern New England. At New York City, there is a high probability based on historic cases that an additional 20" or more snow will accumulate after December. Since January 1, New York City has picked up 23.3" snow. In addition, 78% of winters that saw 10" or more snow in New York City during December had measurable snow in March or April vs. the 77% figure for all other winters. However, the subset of the December cases with less than 10" snow in January and more than 10" in February saw 83% of cases with measurable snowfall in March or April. When it came to 6" or more snow in March or April, that's where there was some divergence. For all cases without 10" or more snow in December, 35% had 6" or more snow in March and/or April. For the 10" December cases, that figure was somewhat lower at 30%. For the subset of December cases, it was 50%. The single exception from the subset was winter 2009-10 when just a trace of snow was recorded after February. All said, it is more likely than not that there will be additional measurable snowfall after February. Based on sensitivity analysis applied to the latest guidance, there is an implied 86% probability that New York City will have a colder than normal February. February will likely finish with a mean temperature near 32.1° (3.2° below normal).
-
Close proximity to the Jamaica Bay.
-
No. Its streak is 26 days (through yesterday), which ranks as the 41st longest on record.
-
Yes. That is correct. Climatological Data for New York-Kennedy Airport Area, NY (ThreadEx) - January 1994 Click column heading to sort ascending, click again to sort descending. Date Max Temperature Min Temperature Avg Temperature Avg Temperature Departure HDD CDD Precipitation Snowfall Snow Depth Sum 1041 591 - - 1191 0 4.92 7.1 - Average 33.6 19.1 26.3 -6.4 - - - - 0.4 Normal 39.1 26.3 32.7 - 1001 0 3.16 6.3 - 1994-01-01 42 25 33.5 -0.2 31 0 0.02 0.0 1 1994-01-02 51 33 42.0 8.4 23 0 0.03 0.0 0 1994-01-03 35 30 32.5 -0.9 32 0 0.22 0.6 0 1994-01-04 43 24 33.5 0.2 31 0 0.35 0.2 1 1994-01-05 34 22 28.0 -5.2 37 0 T T T 1994-01-06 26 18 22.0 -11.0 43 0 0.01 0.1 0 1994-01-07 32 23 27.5 -5.4 37 0 0.47 0.6 T 1994-01-08 32 17 24.5 -8.3 40 0 0.27 0.1 1 1994-01-09 26 15 20.5 -12.2 44 0 0.00 0.0 1 1994-01-10 26 16 21.0 -11.6 44 0 0.00 0.0 1 1994-01-11 36 17 26.5 -6.1 38 0 0.00 0.0 1 1994-01-12 34 30 32.0 -0.5 33 0 0.45 1.0 T 1994-01-13 39 32 35.5 3.0 29 0 0.00 0.0 T 1994-01-14 36 22 29.0 -3.4 36 0 T T 0 1994-01-15 22 8 15.0 -17.4 50 0 T 0.1 0 1994-01-16 16 4 10.0 -22.3 55 0 0.00 0.0 T 1994-01-17 45 14 29.5 -2.8 35 0 1.18 0.4 0 1994-01-18 37 6 21.5 -10.8 43 0 0.26 0.7 T 1994-01-19 10 0 5.0 -27.3 60 0 0.00 0.0 T 1994-01-20 15 3 9.0 -23.3 56 0 T T T 1994-01-21 23 6 14.5 -17.8 50 0 0.00 0.0 T 1994-01-22 33 17 25.0 -7.4 40 0 0.00 0.0 0 1994-01-23 33 20 26.5 -5.9 38 0 0.00 0.0 0 1994-01-24 47 31 39.0 6.6 26 0 0.00 0.0 0 1994-01-25 38 33 35.5 3.0 29 0 T T 0 1994-01-26 33 9 21.0 -11.6 44 0 0.28 3.3 2 1994-01-27 34 2 18.0 -14.6 47 0 0.07 T 3 1994-01-28 51 34 42.5 9.8 22 0 1.31 0.0 1 1994-01-29 43 34 38.5 5.7 26 0 0.00 0.0 0 1994-01-30 36 26 31.0 -1.8 34 0 0.00 0.0 0 1994-01-31 33 20 26.5 -6.4 38 0 0.00 0.0 0
-
No. Threshold Search for Minimum Temperature (F) New York-Kennedy Airport Area (NY) JFKthr 9 Lat/Lon/Elev: / / Years: 1948 to 2021 Dates: 01-01 to 12-31 Condition is: Minimum Temperature (F) less than 0 To sort multiple columns, hold SHIFT while clicking on the columns. Date MINT MAXT MEAN PCPN SNOW SNOWD 1961-02-02 -1 19 9.0 0.00 0.0 4 1963-02-08 -2 28 13.0 0.00 0.0 0 1977-01-17 -1 8 3.5 0.00 0.0 7 1982-01-17 -1 22 10.5 0.00 0.0 6 1985-01-21 -2 10 4.0 0.00 0.0 3
-
That was Dallas. Central Park’s last day was February 14, 2016 with a -1 reading.
-
Last subzero day: December 23, 1989: -1 degree.
-
It’s likely a whole combination of factors related to climate change. Rapid Arctic warming has had some impact on the jet stream. The warm oceans impact ridge-trough positions and convection (e.g., the MJO now spends more time in the warmer Maritime Continent Phases). Cold air masses are, in general (not always), less expansive and less severe in magnitude.
-
OBS and nowcast mainly midnight - Noon Thursday Feb 11
donsutherland1 replied to wdrag's topic in New York City Metro
JFK was 2.2”. -
Morning thoughts... At 7:50 am, a storm was moving away from Virginia. Rain was falling at Norfolk while some snow was reported in Charlottesville. That storm will not impact the Philadelphia to New York City region. Today will be partly sunny and unseasonably cool. Temperatures will likely top out in the upper 20s to perhaps lower 30s in most of the region. Likely high temperatures around the region include: New York City (Central Park): 28° Newark: 29° Philadelphia: 30° Tomorrow will become mainly cloudy. A system could bring some precipitation to the region tomorrow night and Sunday. Most of the precipitation will be in the form of sleet, freezing rain or rain. Any snowfall amounts will be light, generally a half-inch or less.