donsutherland1
-
Posts
24,181 -
Joined
Content Type
Profiles
Blogs
Forums
American Weather
Media Demo
Store
Gallery
Everything posted by donsutherland1
-
I favor the higher ones. The ECMWF has a good track record. The NAM and RGEM are within their best range. The GFSv16 has been very consistent and did well with the December storm. Sometimes the HRRR takes time to “catch on.” The GFS is a caution flag, but not enough to think the forecast is in trouble.
-
The parallel has double the snowfall through 18z for NYC.
-
No problem. Sorry, my iPhone pasted the map multiple times.
-
That’s from 7 am today through 7 am Wednesday, not including what has already fallen. Storm total

-
DCA: 0.2 NYC: 0.3 BOS: 0.8 ORD: -0.9 ATL: -0.5 IAH: 0.2 DEN: 0.0 PHX: 0.4 SEA: -1.0
-
The record low in January is 0.0”, which occurred in 1890.
- 1,932 replies
-
- 1
-

-
- heavy snow
- wind damage
- (and 1 more)
-
This is likely the result of the transition of energy from the primary storm to the secondary one that will produce the excessive snows.
-
9:06 PM: The ground is dusted and the light snow is picking up in intensity.
- 1,932 replies
-
- 2
-

-
- heavy snow
- wind damage
- (and 1 more)
-
You’re welcome. Unfortunately, I am not aware of any such webcams in Central Park or the New York Botanical Garden.
-
I hope all is well with you in Israel. Here is a link to the Times Square webcam. With the lighting, one can see the first snowflakes of the forthcoming storm already swirling about. Stay well.
- 1,932 replies
-
- 4
-
-
-
- heavy snow
- wind damage
- (and 1 more)
-
January 2021 General Discussions & Observations Thread
donsutherland1 replied to Stormlover74's topic in New York City Metro
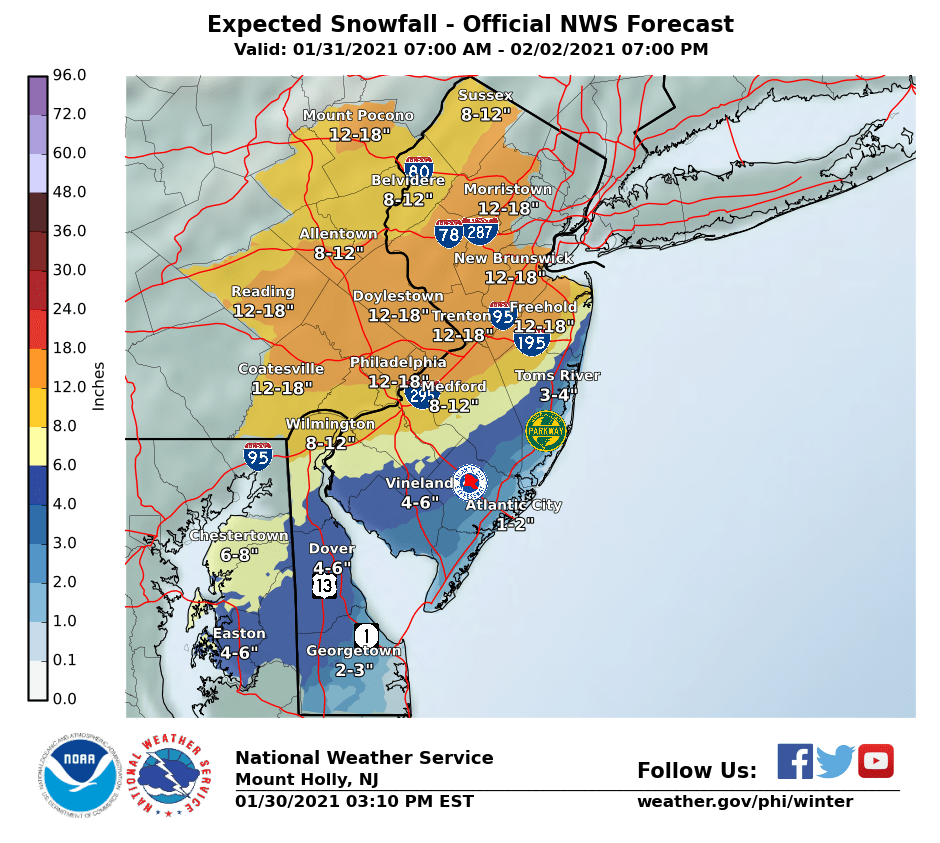
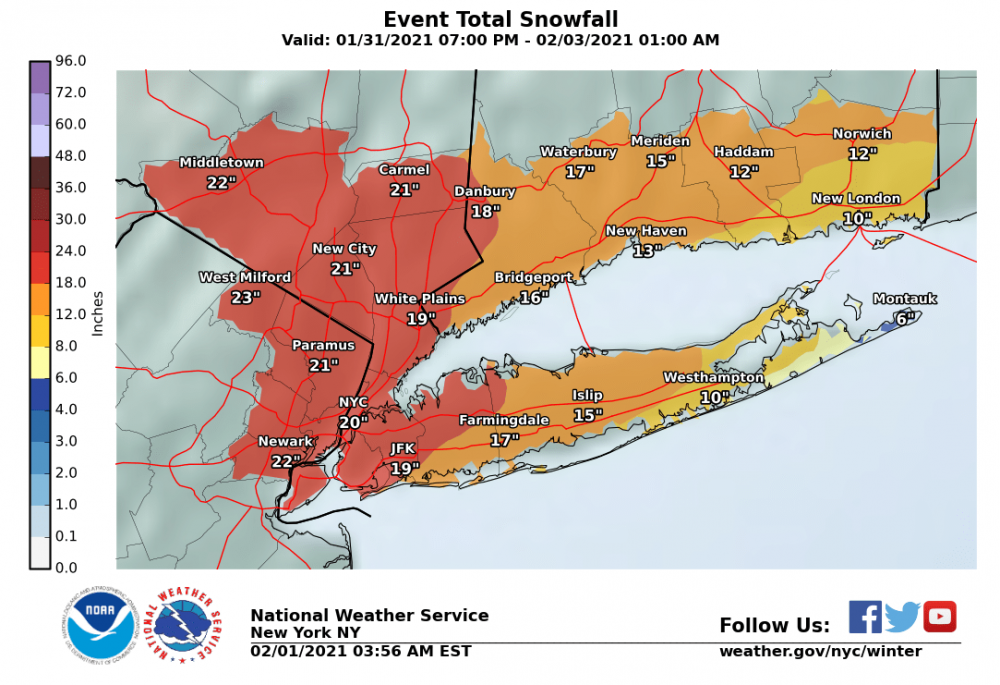
January finished with a mean temperature of 34.8° (2.2° above normal) in New York City. February will likely finish with temperatures averaging within 0.5° of normal in both the New York City and Philadelphia areas. A major to perhaps historic snowstorm is now moving into the region. Parts of Long Island could see its biggest snowfall since March 20-22, 2018. The New York City and Philadelphia areas could experience their largest snowfall since January 22-24, 2016. Blizzard conditions are possible in parts of the region tomorrow afternoon and evening. Enough warmer air could come in off the Atlantic Ocean to change the snow to mixed precipitation or rain along New Jersey's south shore, parts of Long Island and southeastern New England (Cape Cod and Nantucket). Some of the guidance continues to bring the mixing into New York City. Final snowfall estimates: Allentown: 16"-24" Boston: 5"-10" Bridgeport: 12"-18" Islip: 12"-18" Mount Pocono: 20"-30" New York City: 14"-20" Newark: 16"-24" Philadelphia: 7"-14" Poughkeepsie: 12"-18" After somewhat milder air returns late in the first week in February, another shot of cold air is possible early in the second week of the month. That cold shot could be preceded by a storm. The ENSO Region 1+2 anomaly was -0.8°C and the Region 3.4 anomaly was -1.1°C for the week centered around January 20. For the past six weeks, the ENSO Region 1+2 anomaly has averaged -0.85°C and the ENSO Region 3.4 anomaly has averaged -1.07°C. La Niña conditions will likely prevail at least through meteorological winter. The SOI was +6.18 today. Today, the preliminary Arctic Oscillation (AO) figure was -2.496. On January 30 the MJO was in Phase 6 at an amplitude of 2.358 (RMM). The January 29-adjusted amplitude was 2.446. Following a significant stratospheric warming event, the stratosphere has continued to cool. Based on the latest guidance, no significant stratospheric warming event is likely into the first week of February. The significant December 16-17 snowstorm during what has been a blocky December suggests that seasonal snowfall prospects have increased especially from north of Philadelphia into southern New England. At New York City, there is a high probability based on historic cases that an additional 20" or more snow will accumulate after December. Were blocking to disappear, snowfall prospects would diminish. -
Thanks for the kind words.
-
If things remain on course and there are no surprises, parts of the Lehigh Valley could see 20"-30" snow. A lot depends on where the banding will set up. This should be a memorable storm.
-
The entire 1950-99 period had 10 such storms. Almost certainly, the increased moisture content associated with warming is leading to higher impact storms when there is sufficient cold. There has also been a disproportionate increase in the frequency of such storms in the Islip, Newark and New York City areas since 2000..
-
That was a remarkable winter. Philadelphia received a seasonal record 78.7" snow.
-
For reference, Philadelphia has had 10 snowstorms of 12" or more since 2000. Those snowstorms were: February 15-18, 2003: 20.8" January 22-24, 2005: 13.2" February 11-12, 2006: 12.0"' December 19-20, 2009: 23.2" February 5-6, 2010: 28.5" February 9-10, 2010: 15.8" December 26-27, 2010: 12.4" January 26-27, 2011: 15.1" January 21-22, 2014: 13.5" January 22-23, 2016: 22.4"
-
January 2021 General Discussions & Observations Thread
donsutherland1 replied to Stormlover74's topic in New York City Metro
JFK: 12”-18” MPO: 20”-30” -
January 2021 General Discussions & Observations Thread
donsutherland1 replied to Stormlover74's topic in New York City Metro
Morning thoughts... A major to perhaps borderline historic snowstorm (top 20 or above) will affect the region over the next several days. At 6:45 am, snow was falling in Washington, DC and parts of nearby Maryland. That snow will move into Baltimore early this morning and Philadelphia later this morning or early this afternoon. Clouds will increase and snow will push in Newark and New York City late this afternoon or perhaps early this evening. Snow will fall at varying intensities overnight. Temperatures will top out in the upper 20s and lower 30s in most of the region. Likely high temperatures around the region include: New York City (Central Park): 28° Newark: 29° Philadelphia: 32° As the secondary storm develops and then wanders near the Middle Atlantic coastline, blizzard conditions are possible in parts of the northern Mid-Atlantic region tomorrow into tomorrow night. An area running from eastern Pennsylvania through the New York City Metro area and across Nassau County could see some of the storm’s highest snowfall totals with embedded figures approaching or reaching two feet. Estimated snowfall totals: Allentown: 16”-24” Boston: 5”-10” Bridgeport: 12”-18” Islip: 8”-16” New York City: 14”-20” Newark: 14”-20” Philadelphia: 7”-14” Poughkeepsie: 8”-16” This storm will very likely join the 10 one-foot or larger snowstorms that have blanketed New York City since 2000. Six of those storms dumped 18” or more snow. Those 10 storms were: December 30, 2000: 12.0” February 16-17, 2003: 19.8” December 5-7, 2003: 14.0” January 22-23, 2005: 13.8” February 11-12, 2006: 26.9” February 25-26, 2010: 20.9” December 26-27, 2010: 20.0” January 26-27, 2011: 19.0” February 13-14, 2014: 12.5” January 22-24, 2016: 27.5” -
January 2021 General Discussions & Observations Thread
donsutherland1 replied to Stormlover74's topic in New York City Metro
The overnight guidance (UKMET excluded) was great. -
The NAM’s focus of heaviest snows closely resembles earlier cycles of the GFSv16.
- 2,426 replies
-
- 2
-
-
- heavy snow
- ice pellets
- (and 3 more)
-
January 2021 General Discussions & Observations Thread
donsutherland1 replied to Stormlover74's topic in New York City Metro
A storm will move into the Ohio Valley tomorrow with secondary development taking place off the Middle Atlantic coast. As a result, much of the region will experience its biggest snowfall since at least December 16-17, 2020. At present, much of the region appears to be in line for a significant to potentially major snowfall from late Sunday through Tuesday. There will be widespread amounts of 6" or above in the Middle Atlantic and southern New England areas. There will also be a swath of 12" or greater snowfall, but details concerning the location of the heaviest snow still remain somewhat uncertain. Enough warmer air could come in off the Atlantic Ocean to change the snow to mixed precipitation or rain along New Jersey's south shore, parts of Long Island and southeastern New England (Cape Cod and Nantucket). Some of the guidance even brings the mixing into New York City. Initial snowfall estimates: Boston: 5"-10" Bridgeport: 7"-14" Islip: 6"-12" New York City: 7"-14" Newark: 8"-16" Philadelphia: 6"-12" Poughkeepsie: 5"-10" The GFSv16 is more aggressive with snowfall amounts across New York City and Long Island. In contrast, the National Blend of Models shows at least a 40% probability of rain in New York City Tuesday morning, which results in a lower accumulation figure than seen on much of the individual guidance. The ENSO Region 1+2 anomaly was -0.8°C and the Region 3.4 anomaly was -1.1°C for the week centered around January 20. For the past six weeks, the ENSO Region 1+2 anomaly has averaged -0.85°C and the ENSO Region 3.4 anomaly has averaged -1.07°C. La Niña conditions will likely prevail at least through meteorological winter. The SOI was +6.65 today. Today, the preliminary Arctic Oscillation (AO) figure was -2.904. On January 29 the MJO was in Phase 6 at an amplitude of 2.436 (RMM). The January 28-adjusted amplitude was 2.281. Following a significant stratospheric warming event, the stratosphere has continued to cool. Based on the latest guidance, no significant stratospheric warming event is likely into the first week of February. The significant December 16-17 snowstorm during what has been a blocky December suggests that seasonal snowfall prospects have increased especially from north of Philadelphia into southern New England. At New York City, there is a high probability based on historic cases that an additional 20" or more snow will accumulate after December. Were blocking to disappear, snowfall prospects would diminish. Based on sensitivity analysis applied to the latest guidance, there is an implied near 100% probability that New York City will have a warmer than normal January. January will likely finish with a mean temperature near 34.8°. -
January 2021 General Discussions & Observations Thread
donsutherland1 replied to Stormlover74's topic in New York City Metro
Morning thoughts... Today will be fair but continued unseasonably cold. In spite of bright sunshine, temperatures will likely top out in the upper 20s and lower 30s in most of the region. Likely high temperatures around the region include: New York City (Central Park): 29° Newark: 31° Philadelphia: 33° A significant to potentially major snowstorm is likely in the northern Middle Atlantic and southern New England regions late Sunday through Tuesday.