donsutherland1
-
Posts
23,765 -
Joined
Content Type
Profiles
Blogs
Forums
American Weather
Media Demo
Store
Gallery
Everything posted by donsutherland1
-
Tomorrow will be warm for the season. A shower is possible. The temperature will top out in the lower and middle 70s. It will turn somewhat cooler on Sunday. Monday could see some showers as a strong cold front crosses the region. In its wake, the region will see its coolest air so far this season. In the Southwest and parts of California, near record and record heat continued. As of 2 pm MST, Tucson had reached 106°, which broke that city's October record of 105° that had been set on October 1. Phoenix had reached 108°, surpassing the old October monthly record for the fourth consecutive day. The extreme heat will persist into early next week. The NAO fell to a preliminary -2.751 on September 24th (all-time September record: -2.371, September 12, 1971). That was the 9th lowest value on record. La Niña winters following September cases where the NAO fell to -1.900 or below featured a predominantly positive NAO. The most recent such winters were 2016-2017 and 2022-2023. The mean temperatures for those winters in New York City were 39.3° and 41.0° respectively. The 1991-2020 normal value is 36.2°. A warmer outcome is favored by the September run of the C3S multi-model forecast for Winter 2024-2025. The ENSO Region 1+2 anomaly was +0.2°C and the Region 3.4 anomaly was -0.5°C for the week centered around September 18. For the past six weeks, the ENSO Region 1+2 anomaly has averaged -0.20°C and the ENSO Region 3.4 anomaly has averaged -0.18°C. Neutral ENSO conditions will likely evolve into a La Niña event during the fall. The SOI was -5.61 today. The preliminary Arctic Oscillation (AO) was -1.421 today.
-
The 95-degree high in SF was really impressive.
-
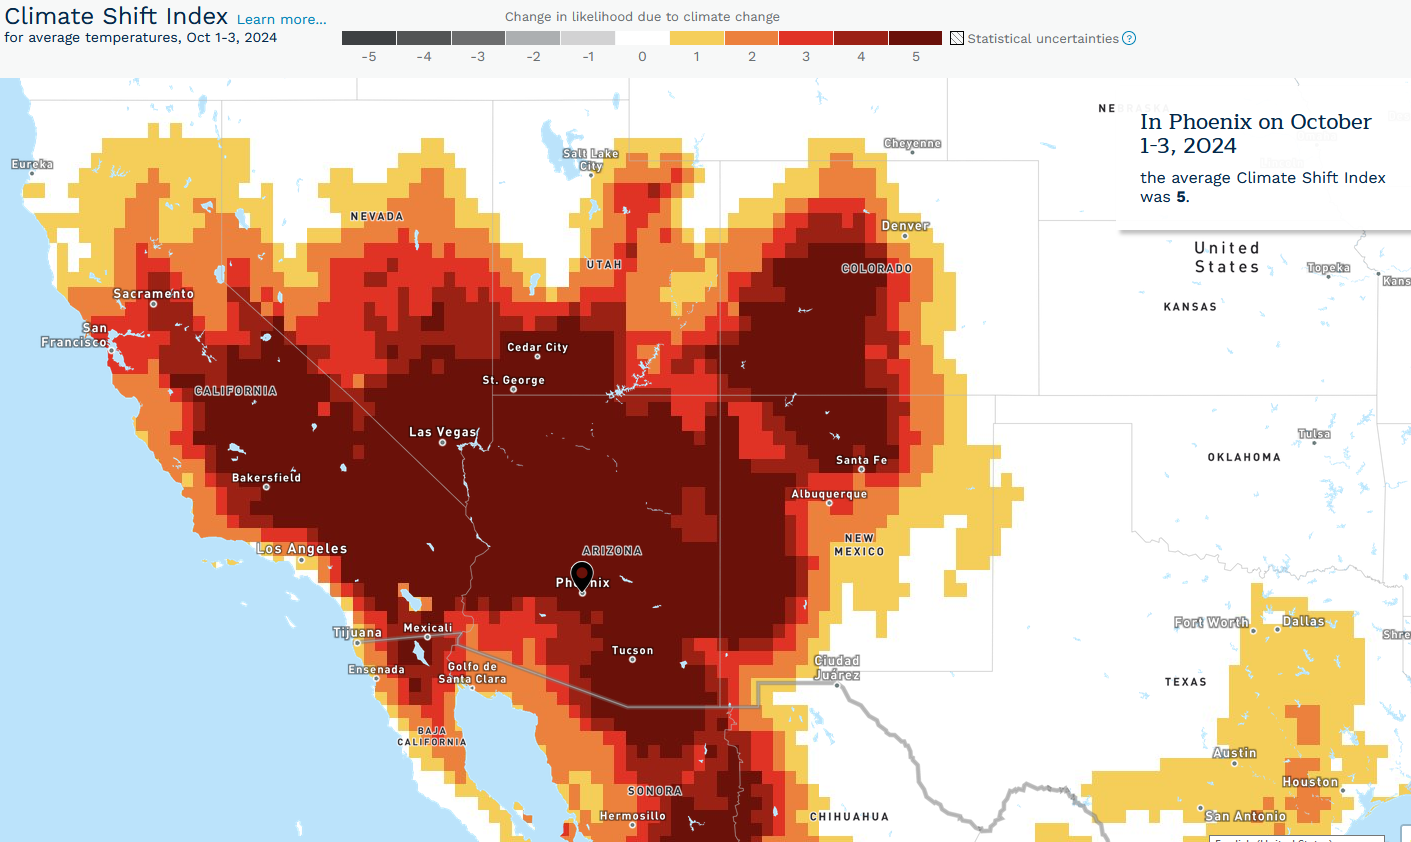
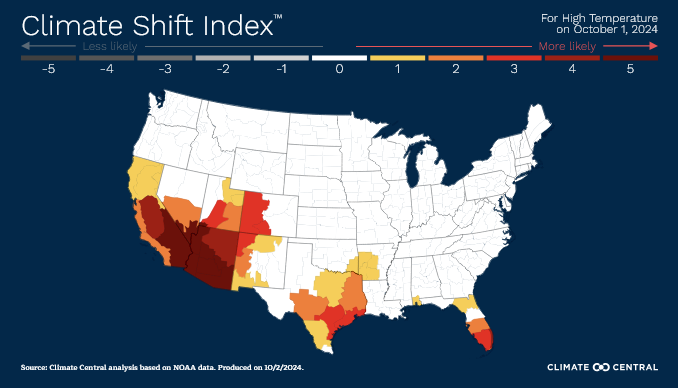
The heat so far in October has been made at least 5 times as likely by climate change in the Phoenix area and a large swath of the southwestern United States.

-
Occasional Thoughts on Climate Change
donsutherland1 replied to donsutherland1's topic in Climate Change
I'm actually not surprised by this development. Daily/monthly temperature extremes recorded in various parts of the world exceed the amount of overall warming that has occurred. It seems that on shorter timeframes, there are factors or combinations of variables that amplify what one would expect from the warming and, in this case, increase in atmospheric water vapor. There has been periodic discussion of a non-linear response in extremes. This is probably one area where more research is needed. -
I agree. A wide range of data products has been disrupted.
-
It will likely turn somewhat milder for tomorrow and Saturday. Temperatures will top out generally in the lower and perhaps middle 70s. Cooler air could arrive Sunday and then again early next week with the coolest air so far this season moving into the region. In the Southwest and parts of California, near record and record heat continued. Numerous locations including Fresno, Hanford, and Stockton tied or broke October monthly records. Phoenix reached 109°. Needles reached 110° for the 80th time this year, breaking the record of 79 days from 1924. The extreme heat will persist into the weekend. The NAO fell to a preliminary -2.751 on September 24th (all-time September record: -2.371, September 12, 1971). That was the 9th lowest value on record. La Niña winters following September cases where the NAO fell to -1.900 or below featured a predominantly positive NAO. The most recent such winters were 2016-2017 and 2022-2023. The mean temperatures for those winters in New York City were 39.3° and 41.0° respectively. The 1991-2020 normal value is 36.2°. A warmer outcome is favored by the September run of the C3S multi-model forecast for Winter 2024-2025. The ENSO Region 1+2 anomaly was +0.2°C and the Region 3.4 anomaly was -0.5°C for the week centered around September 18. For the past six weeks, the ENSO Region 1+2 anomaly has averaged -0.20°C and the ENSO Region 3.4 anomaly has averaged -0.18°C. Neutral ENSO conditions will likely evolve into a La Niña event during the fall. The SOI was -5.61 today. The preliminary Arctic Oscillation (AO) was -1.078 today.
-
That's probably because of Helene's impact on NCEI's Asheville center.
-
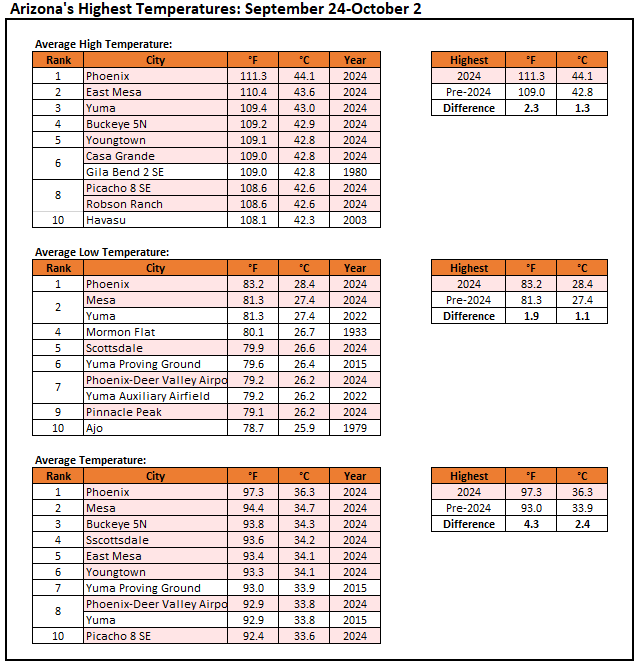
The ongoing historic late-season heatwave in Arizona is unprecedented in the State's climate record. The 9-day period has set state records for highest average high temperature, average low temperature, and average temperature for the September 24-October 2 period. All of those marks are at least 1°C (1.8°F) above their prior marks.
-
Tomorrow will be variably cloudy with temperatures again reaching the upper 60s and lower 70s. It will likely turn somewhat milder for Friday and Saturday. Cooler air could arrive Sunday with the coolest air so far this season arriving early next week. In the Southwest and parts of California, near record and record heat continued. Through 3:50 pm MST, Phoenix had reached a daily record 108°. That marked the second consecutive day that the temperature surpassed the pre-2024 October monthly record. The extreme heat will persist into the weekend. The NAO fell to a preliminary -2.751 on September 24th (all-time September record: -2.371, September 12, 1971). That was the 9th lowest value on record. La Niña winters following September cases where the NAO fell to -1.900 or below featured a predominantly positive NAO. The most recent such winters were 2016-2017 and 2022-2023. The mean temperatures for those winters in New York City were 39.3° and 41.0° respectively. The 1991-2020 normal value is 36.2°. A warmer outcome is favored by the September run of the C3S multi-model forecast for Winter 2024-2025. The ENSO Region 1+2 anomaly was +0.2°C and the Region 3.4 anomaly was -0.5°C for the week centered around September 18. For the past six weeks, the ENSO Region 1+2 anomaly has averaged -0.20°C and the ENSO Region 3.4 anomaly has averaged -0.18°C. Neutral ENSO conditions will likely evolve into a La Niña event during the fall. The SOI was 0.00 today. The preliminary Arctic Oscillation (AO) was -0.697 today.
-
Occasional Thoughts on Climate Change
donsutherland1 replied to donsutherland1's topic in Climate Change
While Phoenix's unprecedented late-season heatwave is making global headlines, as it should, San Juan has destroyed its record for most 80° lows for the second consecutive year.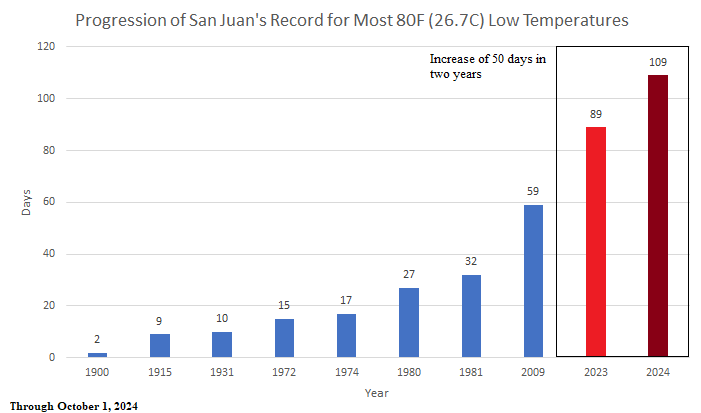
-
Occasional Thoughts on Climate Change
donsutherland1 replied to donsutherland1's topic in Climate Change
One is already witnessing the impact of climate change (warming oceans) on precipitation from atmospheric rivers in California. Precipitation amounts and intensity will continue to increase in a warming climate. https://www.science.org/doi/full/10.1126/sciadv.aba1323 -
Occasional Thoughts on Climate Change
donsutherland1 replied to donsutherland1's topic in Climate Change
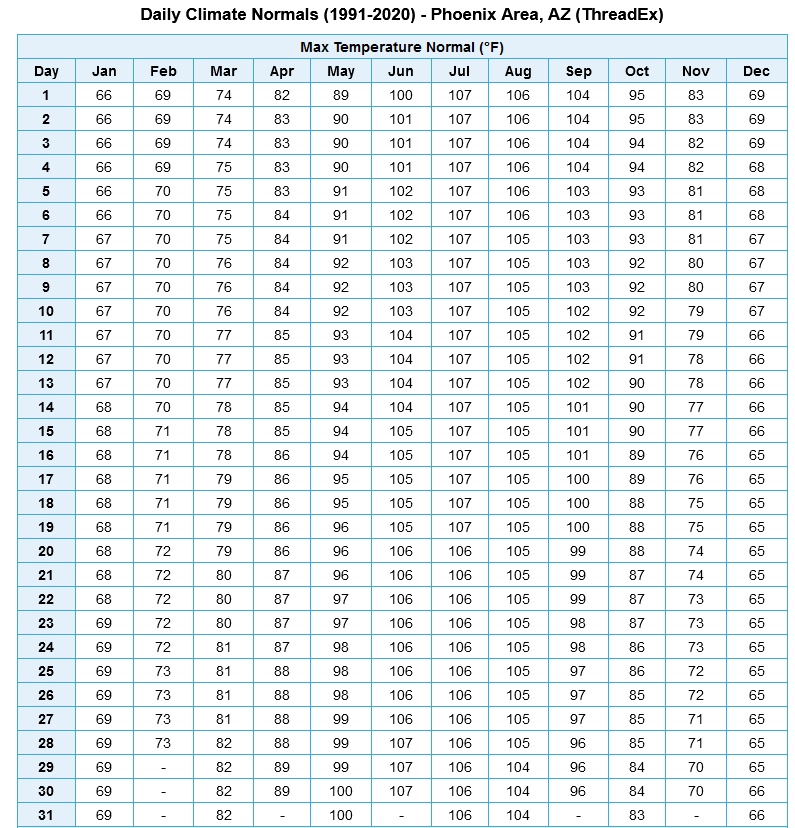
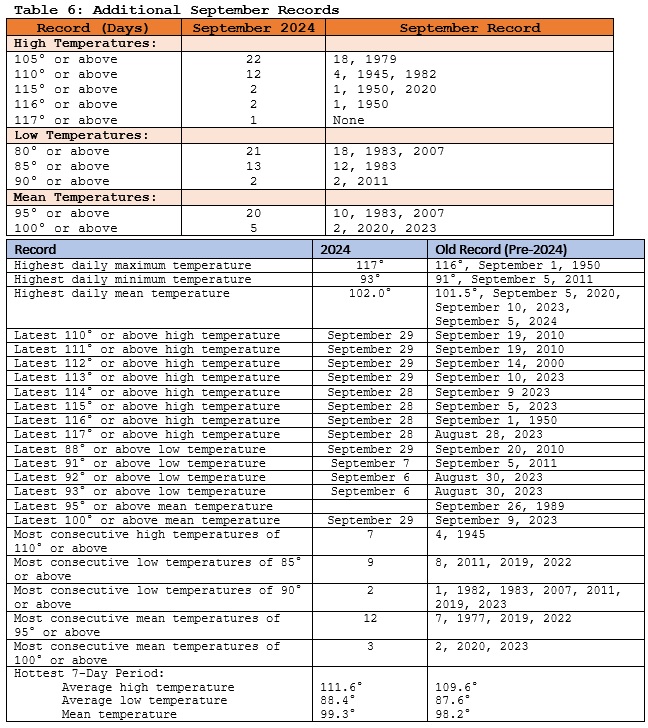
Phoenix is in the midst of an unprecedented late-season heatwave that saw the city reach a September (and August-tying) monthly record of 117° on September 28th and an October monthly record of 113° (old monthly mark: 107°) on October 1st. The seven-day September 25-October 1 period has had an average high temperature of 112.3° (old September 25-October 1 mark: 104.9°). That period has also seen six 110° or above high temperatures and five 113° or above temperatures. Prior to this heatwave, Phoenix had never seen a 110° or above temperature after September 19th and a 113° or above temperature after September 10th. Records go back to August 1895. The extraordinary heat, which has also seen Indio, CA and Palm Springs tie the national October record of 117° has brought out a torrent of climate change deniers seeking to dismiss what is taking place. Each has revealed climate illiteracy in their wide-ranging efforts to dismiss what is taking place. Key Points: 1. The discussion has concerned Phoenix's climate record, which goes back to August 1895. References to 1367 and regional temperatures millions of years ago before the city even existed are irrelevant. Globally, the paleoclimate record shows that 2023-level temperatures were the warmest in 125,000 years. Phoenix was not experiencing the kind of heatwaves like the current one during colder global periods within its climate record. It is all but certain statistically that had instruments existed and temperatures been recorded in 1367, Phoenix would not have seen a late-season heatwave anywhere close to the current one. 2. Urban Heat Island (UHI) is real. However, its impacts are greatest at night. Moreover, even small towns e.g., Tacna, AZ (2024 population: 511) have been experiencing an unprecedented late-season heatwave. Moreover, USCRN sites in Arizona have also been experiencing notable warming. UHI cannot solely or largely explain the Phoenix's warming, much less its current heatwave. Rapid attribution by Climate Central revealed that, for example, yesterday's high temperatures in the Phoenix area were made at least 5 times as likely as due to climate change. A World Weather Attribution study of concurrent European, Asian, and Mexico/U.S. heatwaves (including in the Phoenix area) during July 2023 revealed that the heatwave was "virtually impossible" without climate change and about 2°C (3.6°F) warmer due to climate change. The individual suggesting that UHI fully explains Phoenix's heat has been fact checked for posting misleading or incorrect information three times by AFP. 3. Although the desert is hot, there are climate records. The current heatwave is far above what is normal for this time of year. In Phoenix, the October 1 high temperature was 18° above the normal value for the date. 4. Bastardi has already been fact checked by AFP on his claims regarding volcanoes. Human emissions are driving rising atmospheric CO2. Rising atmospheric greenhouse gases, including CO2, are driving the ongoing warming. In its Sixth Assessment Report, the IPCC explained: Human activities, principally through emissions of greenhouse gases, have unequivocally caused global warming, with global surface temperature reaching 1.1°C above 1850-1900 in 2011-2020. Global greenhouse gas emissions have continued to increase, with unequal historical and ongoing contributions arising from unsustainable energy use, land use and land-use change, lifestyles and patterns of consumption and production across regions, between and within countries, and among individuals (high confidence). 5. Numerous drivers impact climate. A recent study covering 485 million years revealed, "CO2 is the dominant control on Phanerozoic climate." Conclusion: Phoenix is experiencing an unprecedented late-season heatwave. Climate change has increased the likelihood and intensity of such a heatwave. Those seeking information should look to credible sources of weather and climate information, not Social Media noisemakers who have little or no understanding of Phoenix's climate or climate change or who seek to mislead on climate/climate change.
-
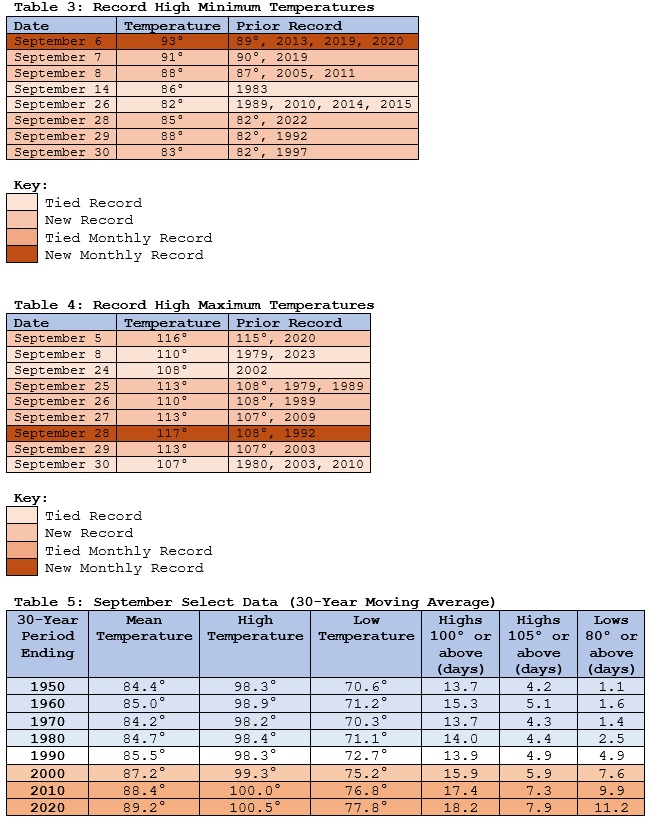
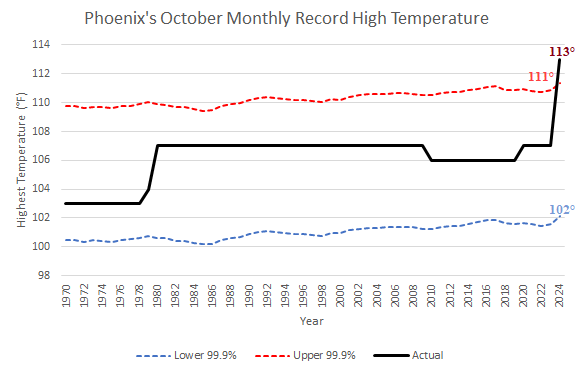
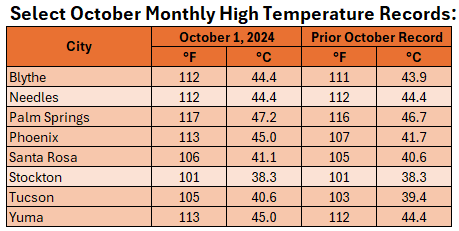
The high temperature of 117° on September 28, 2024 set a new monthly record and matched the August monthly record. It was so extreme for the second half of September that i fell well outside what statistically would be expected using a 99.9% confidence interval based on 30-year moving average September 16-30 high temperatures. The October 1, 2024 113° high temperature, which demolished the prior October record of 107° (October 1, 1980, October 2, 1980, and October 1, 2020) was so extreme that it falls outside of what would statistically be expected using a 99.9% confidence interval based on 30-year moving average October high temperatures. Although the charts start at 1970 for easier viewing, 2024 is the only year in Phoenix's climate record (October 1895-present) that saw the September 16-30 and October monthly high temperature break out of their 99.9% confidence intervals. Separately, both July 2023 and July 2024 broke out of the same confidence interval for monthly average temperatures. Further, during the 7-day September 25-October 1, 2024 period, Phoenix has had an average high temperature of 112.3°. The previous record high average maximum temperature during the September 25-October 1 period was set in 2010. That average was 104.9°. Phoenix has never experienced a late-season heatwave like the current one. And Phoenix wasn't alone with extreme heat on October 1st. Blythe, Palm Springs, Tucson, and Yuma were among cities that set new monthly records. At Palm Springs, the temperature reached 117°, which tied the U.S. national October record high temperature.

-
Amber is a top-notch meteorologist. She has done a terrific job conveying both the forecast to her viewers and the reality that what is taking place is being driven by climate change. She's a real asset to the Phoenix community.
-
Occasional Thoughts on Climate Change
donsutherland1 replied to donsutherland1's topic in Climate Change
No. It's down due to Helene's flood. I don't believe there is any estimated time when the site will be back online. -
The ongoing historic late-season heatwave toppled October monthly records in parts of Arizona and California. Palm Springs reached the highest U.S. temperature on record for October.
-
Tomorrow will be variably cloudy with temperatures reaching the upper 60s and lower 70s. It will likely turn somewhat milder for Friday and Saturday. Cooler air could arrive Sunday with the coolest air so far this season arriving early next week. In the Southwest and parts of California, near record and record heat continued. October opened with a host of monthly record high temperatures being tied or broken. As of 5 pm EDT, monthly records included Palm Springs: 116° (tied monthly mark); Phoenix: 111° (old record: 107°); and Tucson: 105° (old record: 103°). The extreme heat will persist into the weekend. The NAO fell to a preliminary -2.751 on September 24th (all-time September record: -2.371, September 12, 1971). That was the 9th lowest value on record. La Niña winters following September cases where the NAO fell to -1.900 or below featured a predominantly positive NAO. The most recent such winters were 2016-2017 and 2022-2023. The mean temperatures for those winters in New York City were 39.3° and 41.0° respectively. The 1991-2020 normal value is 36.2°. A warmer outcome is favored by the September run of the C3S multi-model forecast for Winter 2024-2025. The ENSO Region 1+2 anomaly was +0.2°C and the Region 3.4 anomaly was -0.5°C for the week centered around September 18. For the past six weeks, the ENSO Region 1+2 anomaly has averaged -0.20°C and the ENSO Region 3.4 anomaly has averaged -0.18°C. Neutral ENSO conditions will likely evolve into a La Niña event during the fall. The SOI was +6.84 today. The preliminary Arctic Oscillation (AO) was -0.472 today.
-
For some measure of how extreme and abnormal the heat in Phoenix has been this year, just last year Phoenix recorded its hottest summer on record (surpassed this year). The three-month mean temperature for Summer 2023 was 97.1°. The four-month June-September 2024 mean temperature exceeded that mark, coming in at 97.9°.
-
2024 Atlantic Hurricane Season
donsutherland1 replied to Stormchaserchuck1's topic in Tropical Headquarters
This is wonderful news. -
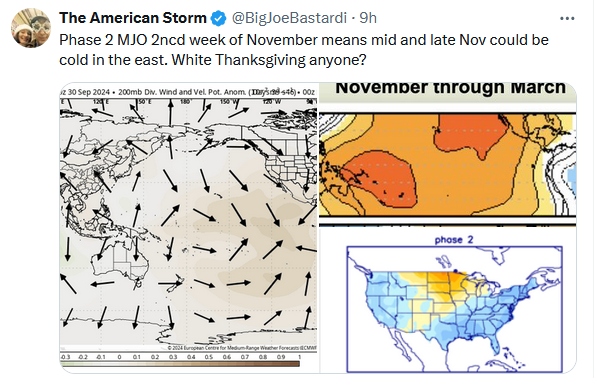
Like clockwork: It should be noted that the MJO cannot be predicted reliably at such timeframes.
-
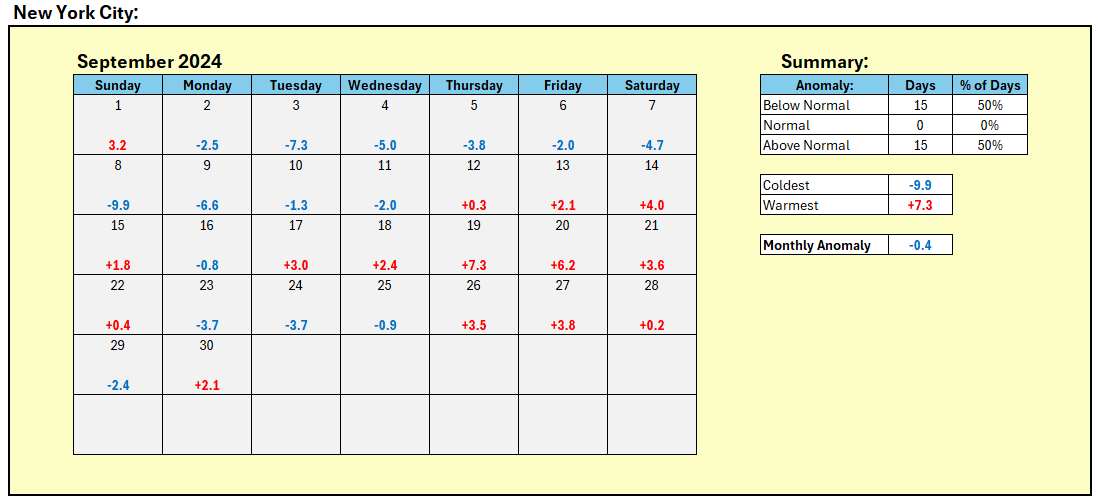
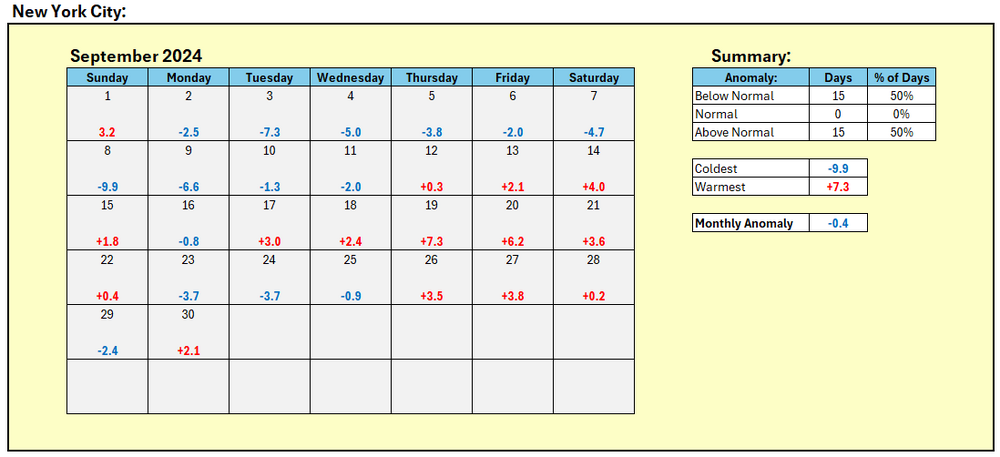
New York City's daily summary for September.
-
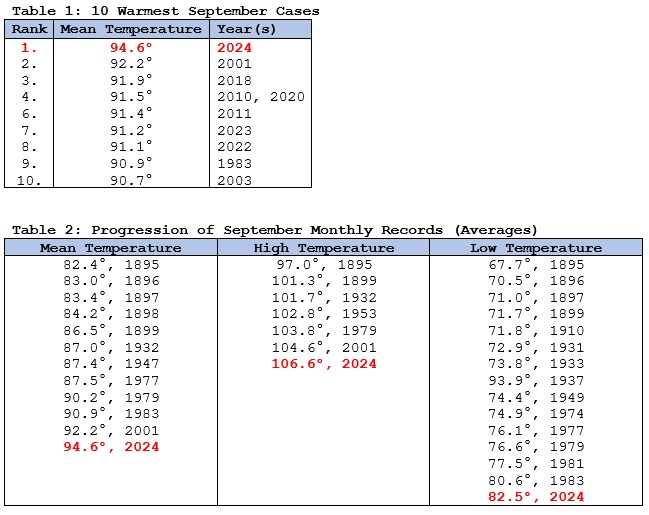
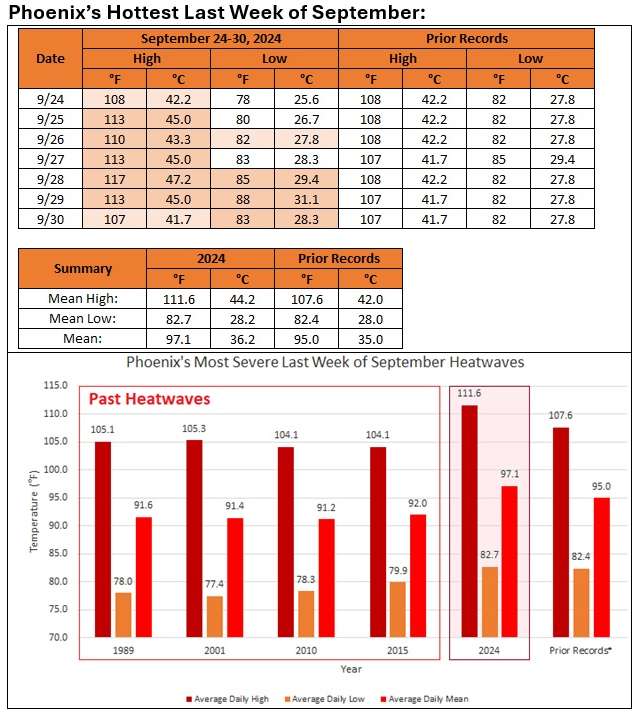
2024 has been a marathon of heat in Phoenix. Following the hottest summer on record, Phoenix experienced its hottest September on record as the heat persisted. September 2024’s monthly mean temperature of 94.6° crushed the old record of 92.2° that had stood since 2001. September started with its hottest first week on record (mean temperature: 99.3° vs. the old record of 98.2° from 2019). It concluded with its hottest last week of the month (mean temperature: 97.1° vs. 92.0°, 2015). June-September 2024 was also the hottest June-September on record with a four-month mean temperature of 97.9°. That smashed the record of 95.6° that was set just last year. September highlights included a new September monthly high temperature record (117°), a new record high September low temperature (93°), a new September record high daily mean temperature (102.0°), and the conclusion of a record 113-day stretch during which the temperature rose to 100° or above on each day (old record: 76 days). Anthropogenic climate change amplified by the urban heat island effect is driving a warming of Arizona’s and Phoenix's summers and Septembers. A potential key mechanism by which climate change drives extreme events involves the increased frequency of quasi-resonant amplification (QRA) events. QRA events result in persistent summer extreme events, including heatwaves, in the Northern Hemisphere (Guimarães et al., 2024). QRA events likely contributed to recent persistent and often extreme heat in parts of North America (including the Phoenix area), Europe, and Asia. Currently, the normal September mean temperature (1991-2020 baseline) is 89.2°. That exceeded the 30-year average value for August 1939-1968. The warming has been especially pronounced during the second half of September. Between 1961-1990 and 1991-2020, the September 1-15 mean temperature rose 2.9° from 88.1° to 91.0° with the first week warming 3.3° from 89.1° to 92.4°. During the same periods, the September 16-30 mean temperature rose 4.4° from 82.9° to 87.3° with the last week warming 4.5° from 82.1° to 86.6°. Since record keeping began in August 1895, 8 of the 11 (73%) last weeks of September with mean temperatures of 90.0° have occurred since 2000 and all have occurred since 1989. Six (55%) of those weeks have occurred since 2010 and three (27%) have occurred since 2020.

-
Phoenix experienced its hottest last week of September on record. No past last week of September heatwave was comparable. In fact, the 2024 heatwave was so extreme that it exceeded a synthetic heatwave constructed from all the pre-2024 daily record values for the September 24-30. The average 111.6° high temperature was the highest for any 7-day period in September. Prior to 2024, the hottest average maximum temperature was 109.6° from September 1-7, 1945. September 4-10, 2024 beat that mark with a 111.1° average. September 24-30 exceeded that new mark.
-
September finished with a mean temperature of 68.8° in New York City. That was 0.4° below normal. Tomorrow and Wednesday will be variably cloudy with temperatures reaching the upper 60s and lower 70s. It will likely turn somewhat milder late in the week. Cooler air could arrive during the weekend. In the Southwest and parts of California, near record and record heat continued. As of 2 pm MST, Phoenix had a high temperature of 106°. The extreme heat will persist into the weekend. October could wind up warmer than normal across much of the U.S. The western U.S. could be particularly warm relative to normal. Widespread October warmth occurred during the last case where the AO fell to -2.000 or below while the PNA rose to +1.000 or above with a cool ENSO Region 3.4 anomaly in late September (2010), as was the case this year. The NAO fell to a preliminary -2.751 on September 24th (all-time September record: -2.371, September 12, 1971). That was the 9th lowest value on record. La Niña winters following September cases where the NAO fell to -1.900 or below featured a predominantly positive NAO. The most recent such winters were 2016-2017 and 2022-2023. The mean temperatures for those winters in New York City were 39.3° and 41.0° respectively. The 1991-2020 normal value is 36.2°. A warmer outcome is favored by the September run of the C3S multi-model forecast for Winter 2024-2025. The ENSO Region 1+2 anomaly was +0.2°C and the Region 3.4 anomaly was -0.5°C for the week centered around September 18. For the past six weeks, the ENSO Region 1+2 anomaly has averaged -0.20°C and the ENSO Region 3.4 anomaly has averaged -0.18°C. Neutral ENSO conditions will likely evolve into a La Niña event during the fall. The SOI was +6.84 today. The preliminary Arctic Oscillation (AO) was +0.156 today.
- 1,154 replies
-
- 1
-

-
- tropics
- heavy rainfall
- (and 3 more)
-
Yes. It seems to be a programming issue.