donsutherland1
-
Posts
24,196 -
Joined
Content Type
Profiles
Blogs
Forums
American Weather
Media Demo
Store
Gallery
Everything posted by donsutherland1
-
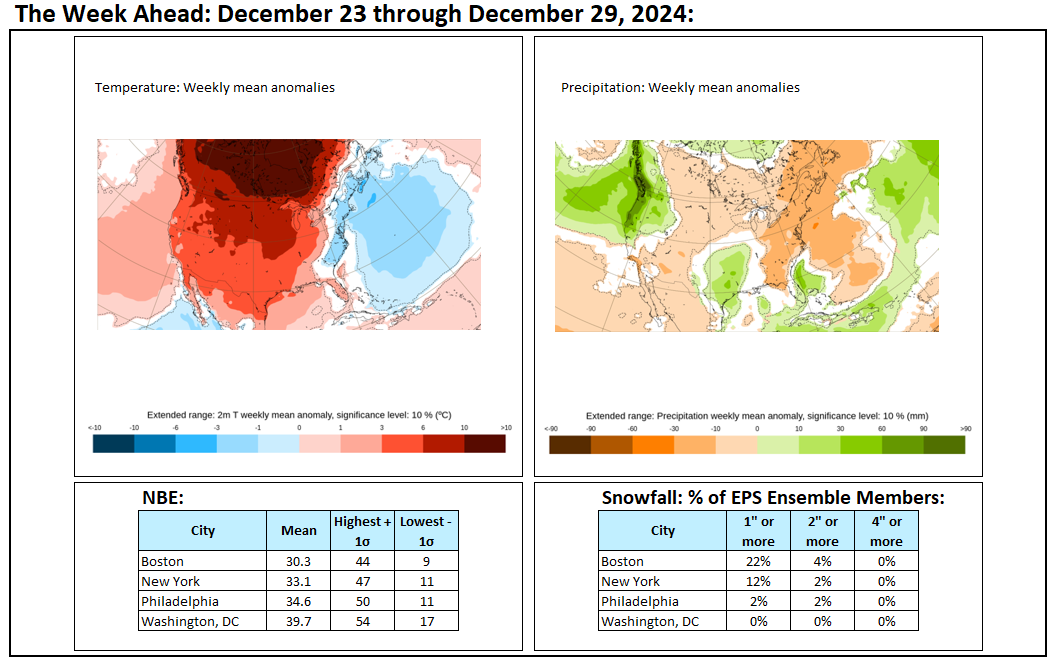
An extended period of generally below normal temperatures is now poised to commence in the New York City area. Although the general below normal temperature regime will likely extend through at least mid-month, it appears increasingly likely that there won't be severe cold that sees minimum temperatures fall below 10° in the Philadelphia to New York City areas during that period. The cold could still peak with readings dropping into the teens with several subfreezing highs. A storm will bring parts of the Middle Atlantic region a moderate to locally significant snowfall Sunday night into Monday. Washington, DC and Baltimore appear to be in line for 4"-8" of snow. Philadelphia has the potential to pick up 3"-6", but there is greater uncertainty there. Once north of Philadelphia, accumulations could fall off quite rapidly. A light amount remains likely for the New York City area. Richmond will likely see an end to its ongoing record streak of 1,083 days without daily 1" or greater daily snowfall. However, that outcome isn't completely assured. In addition to snow, sleet and freezing rain are likely in Richmond. Small changes in the models may still occur in coming cycles. Big changes seem unlikely as the AO block that will influence the storm's track and confluence to its north is well-modeled. The second and third weeks of January will likely feature widespread cold anomalies in much of the eastern half of the CONUS and Canada south of the Hudson and James Bays. The potential exists for widespread cold anomalies of 6°-10° below normal during that week in parts of that region, particularly the Southeast. Those anomalies will likely result more from the prolonged nature of the cold than its severity. However, notable exceptions could be areas with fresh snow cover that experience strong radiational cooling. The ENSO Region 1+2 anomaly was -0.2°C and the Region 3.4 anomaly was -1.1°C for the week centered around December 25. For the past six weeks, the ENSO Region 1+2 anomaly has averaged +0.10°C and the ENSO Region 3.4 anomaly has averaged -0.53°C. Neutral ENSO conditions may still evolve into a La Niña event during the winter. Uncertainty as to whether a La Niña will actually develop persists. On the December 19 outlook, 56% of dynamical models but 0% of the statistical models forecast the development of a La Niña. The SOI was -7.63 today. The preliminary Arctic Oscillation (AO) was -2.085 today.
-
In this thread, I already noted that my expectations for less severe cold stated in this thread will likely prove too aggressive given the latest guidance. That hasn't occurred yet, but I don't see, for example, single-digit cold occurring in NYC, PHL, or BOS Unfortunately, the Internet Archive doesn't have Easternuswx. I believe I noted how unusual it was that Sandy would turn westward and how abnormal the AO block was at the time. The biggest bust that I can recall concerned being late with the idea that what would become the Boxing Day blizzard wasn't going to merely scrape the coast. And, as I post daily my thoughts looking ahead, from December 24 regarding the first half of January: The cold will begin to recede toward the end of the week. December will likely close with above normal temperatures and periods of rain. The opening days of January will likely also begin with above normal temperatures, but it will start to turn colder. Snowfall prospects will remain limited through the end of December. However, the pattern could become more favorable for moderate or perhaps larger snowfalls as the cold returns during the first week of January. There is growing potential for the second week of January to feature widespread cold anomalies in much of the eastern half of the CONUS and Canada south of the Hudson and James Bays. So far: January 1: 9.8° above normal January 2: 3.0° above normal January 3: 0.2° to 1.2° above normal (estimate) January 4: Likely start of the below normal regime as per the guidance The timing from 10 days out is in line with what is occurring. In addition, there is ongoing light snowfall in parts of the region today. Moreover, a significant snowstorm will affect parts of the East Sunday night and Monday. The potential of the pattern is going to be realized. But New York City and northward will see little if any snow from that storm. Details can't really be pinned down that far out, so even if the exact placement of the snow is outside the Greater NYC area, the general idea that the pattern would become more favorable seems poised to be a good one. Having said all this, there is a huge difference between busting on forecasts, and hyping events to gain engagement.
-
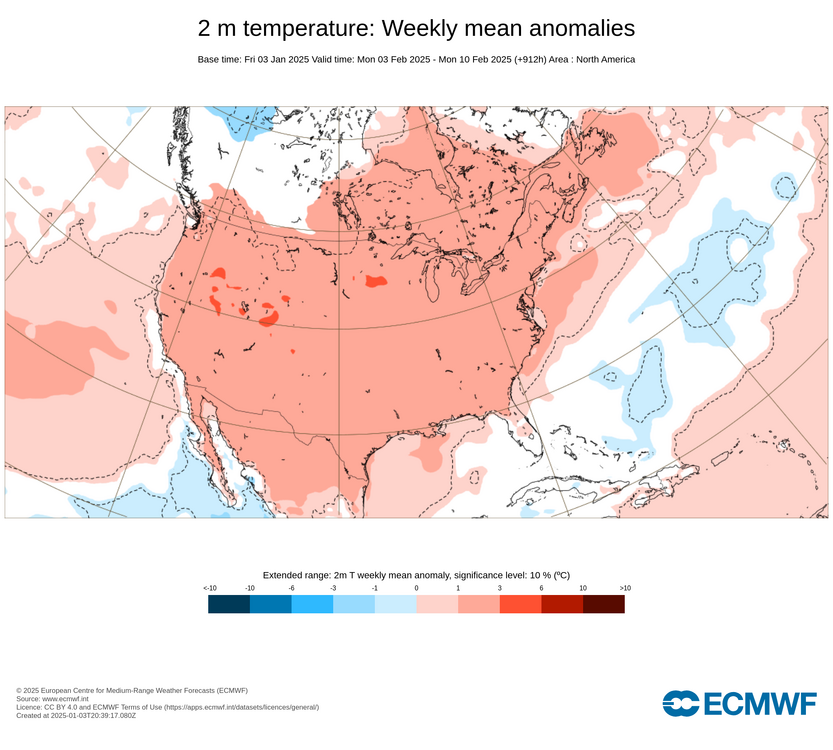
Even as much of the CONUS is in the early stages of what should be a multiweek period of generally sustained cold, albeit with only limited severe cold, if that, there are distant hints of a dramatic pattern shift for late January or the start of February. The 46-day ECMWF ensemble forecast now shows the development of a strong EPO+/AO+ pattern. At the same time, the AAM will likely have been negative for approximately two weeks. The January 2, 2025 ECMWF weekly forecast showed a break from the cold to start February. The January 3 cycle reaffirmed that change with an even more expansive warm signal. January 3 run of the ECMWF Weeklies: Strong EPO+/AO+ Patterns (February 1-10, 1980-2024): It should be noted that the maps are currently used to illustrate a scenario now showing up on the long-range guidance. Skill scores at the timeframe involved are low. What is important is that one has now seen multiple runs suggesting that a milder/warmer regime could set in for the start of February. That's the only point that should be taken from the post at this time. In short, if the early shift in the long-range guidance is correct, winter could relax to end January/start February.
-
Yes, that's correct. It's not surprising, either, as the pattern was not forecast to become a classic KU snowstorm-type pattern.
-
Snowfall NYC subforum Jan 6 and OBS if needed
donsutherland1 replied to wdrag's topic in New York City Metro
I think there's room for some marginal adjustments, but this very likely won't be a moderate, much less, significant snowfall for the Greater NYC area. -
Some users of weather information such as the energy, transportation, and agriculture sectors, need such information for planning purposes, imperfect as it is. They understand the limitations of the information. The general public doesn't. Unfortunately, irresponsible actors on Social Media use the models to hype extreme solutions. In the past, I would never comment on such things. However, with almost an equal share of the public now getting its news/information from Social Media as from conventional sources and widespread perceptions that meteorologists essentially have no skill, I have decided to push back in recent years. Indeed, even at my own workplace, people ask me about some of the extreme stuff from Social Media (one, despite my advice, relies largely on X and TikTok for news/weather/information).
-
Snowfall NYC subforum Jan 6 and OBS if needed
donsutherland1 replied to wdrag's topic in New York City Metro
Just so there is no confusion, the evolving 500 mb pattern was not a classic KU storm pattern for January, particularly the first half of January. Instead, it was one that favored moderate and localized significant snow events if things came together. The possible heavier snow showers later today in parts of the Mid-Atlantic and the upcoming storm that will favor the Washington, DC-Baltimore areas shows that the potential of this pattern could be realized. Unfortunately, central NJ northward won't benefit through at least the next 7-10 days. The power of the strong and rapidly strengthening block will limit opportunities until that block begins to relax. Whether there will be sufficient short waves and how the synoptic details come together at that point will determine whether NYC to Boston could benefit down the road. Right now, that's not assured, which is frustrating for snow lovers given that parts of this region are experiencing their worst two-year snow drought on record. A week ago, things looked more promising for a larger part of the East when the AO was forecast to bottom out near or just above -3. Now, it's forecast to dive to near -4. Moreover, it's forecast to do so very rapidly. It's that factor that a lot of the commentators on social media missed in automatically assuming that this event would "trend" north. Things did shift gradually northward for a time over several model cycles, but IMO, as the models began showing the evolving deeper block overnight (the AO fell from -1.461 to -2.085), that shift rapidly corrected. Overall, the pattern for the Sunday-Monday storm has characteristics of Clusters 2 and 5 from Washington, DC's 6"+ January snowstorms in the eastern CONUS. It is not a perfect match for either cluster, but has enough similarity to provide insight. The trailing trough is too far south relative to NYC's 6"+ patterns. That's why I felt, and still feel, that snowfall amounts could fall off sharply once one gets north of Philadelphia and that NYC would be limited to a light snowfall. A lot would have to change for this idea to be invalid. The block is the big driver and it's the block that would need to change (weaker, farther north). At the current timeframe, the guidance is quite skillful when it comes to such big picture features. Finally, if New York City receives no measurable snowfall (still not a done deal, but certainly plausible), this wouldn't be the first January snowstorm to dump 6" or more in Washington, DC while bringing no measurable snowfall to NYC. The list is below: January 11-12, 1904: Washington, DC: 6.0"; New York City: None January 23-25, 1940: Washington, DC: 9.5"; New York City: Trace January 30, 2010: Washington, DC: 6.4"; New York City: None January 12-14, 2019: Washington, DC: 10.3"; New York City: Trace January 3, 2022: Washington, DC: 6.9"; New York City: None Highest Washington, DC snowfall with none in NYC: 8.4", March 9-10, 1999 Highest Washington, DC snowfall with a trace in NYC: 17.8", February 5-6, 2010, which also brought 28.5" to Philadelphia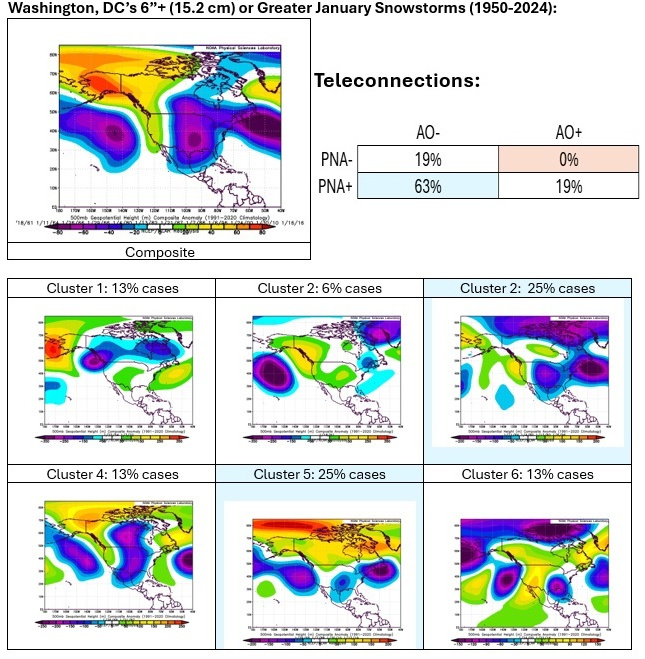
-
Snowfall NYC subforum Jan 6 and OBS if needed
donsutherland1 replied to wdrag's topic in New York City Metro
NYC is at 12.6". I believe you missed the 1.0" that fell on 12/24. As to your question, it has on 11 occasions. The most recent such period was 1987-1989 with DCA's 3-year average coming to 24.8" and NYC's to 18.6". -
Snowfall NYC subforum Jan 6 and OBS if needed
donsutherland1 replied to wdrag's topic in New York City Metro
Hartford is one example on the 12z with 0.4" of snow. -
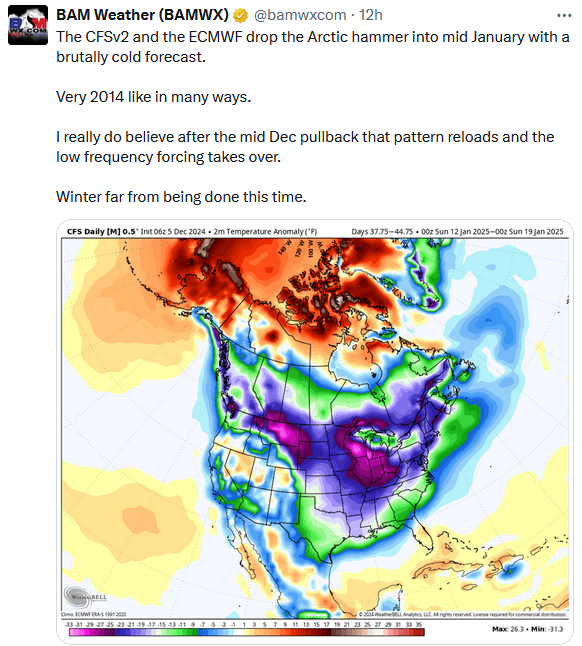
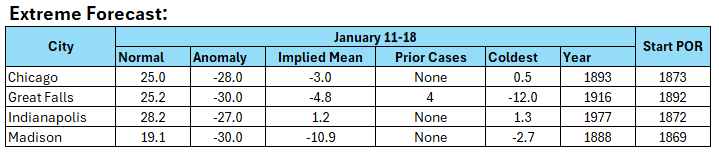
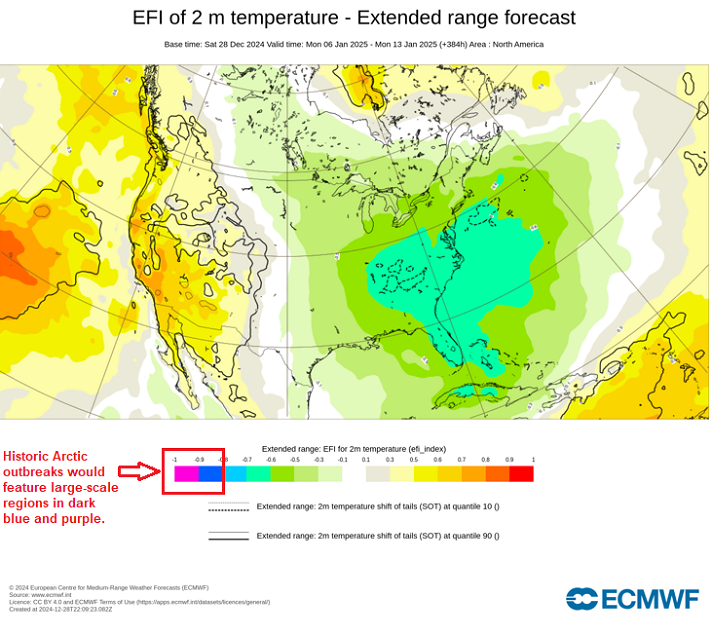
Brief update: Now that the forecast period is within the range of the EPS and GEFS, it is possible to get a reasonable idea of whether the extreme forecast is in line for possible verification. In fact, BAM's forecast appears headed for a spectacular bust (>20°F in all four highlighted cities). Some will argue that I shouldn't treat it as BAM's forecast, but when one posts deterministic output to the general public with no clarifications or caveats, that's exactly what one is doing. Again, what the social media site ignored or did not understand is that: 1. Amount of deep cold in the Northern Hemisphere matters (it was limited then and it remains limited now) 2. Historic climate provides useful benchmarks for assessing the credibility of model output. One can't blindly take model output verbatim stripped of historic context, especially when one is dealing with potentially extreme events. 3. Model skill at the timeframe involved (> 5 weeks!) is essentially non-existent. Thus, one should typically focus on patterns and probabilities, not details and values 4. Basing one's forecasts on cherry-picked model runs is especially risky. To date, no other single model run has come close to the cherry-picked one featured by BAM. On a side note, in late December, the site cherry-picked another extreme model run to invoke "historic cold." Day's later, the local NBC affiliate called it out. In addition, NWS Atlanta called out the posting of extreme snowfall maps on social media. In the end, the failure to consider or understand (or both) the four points raised above are bad practices. Indeed, if one is tempted to even consider a model at the timeframe involved, one should ask, "Is the output reasonable?" One then needs to look at whether such events have occurred before (rarity) and what was involved. As the kind of cold shown was extremely rare or unprecedented for the climate record, one should wait for strong evidence before embracing the outlier guidance. Of course, the outlier guidance did not survive to the following model cycle, but that wasn't mentioned. Hype does not serve the public interest. Social Media today, which is now relied upon by the public almost as much as conventional sources for news/weather/information, provides a powerful platform for hype. Not surprisingly, the general public is confused about the skill of meteorologists, because hype is psychologically more memorable and the busts that occur skew their perceptions of the profession. The next update will be the verification here and on X.
-
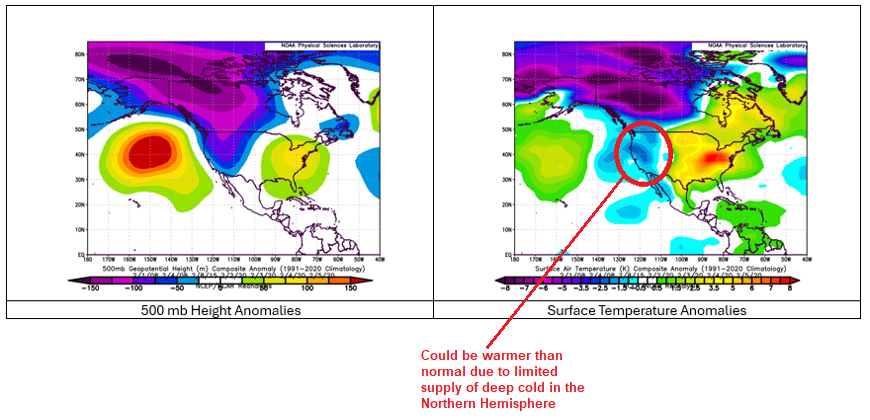
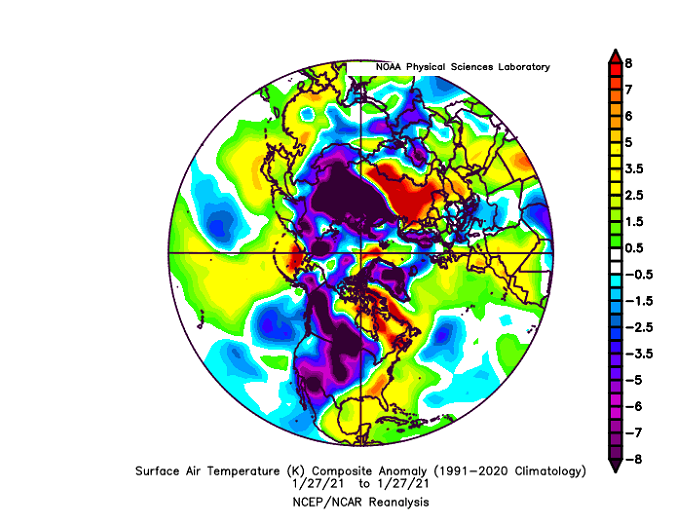
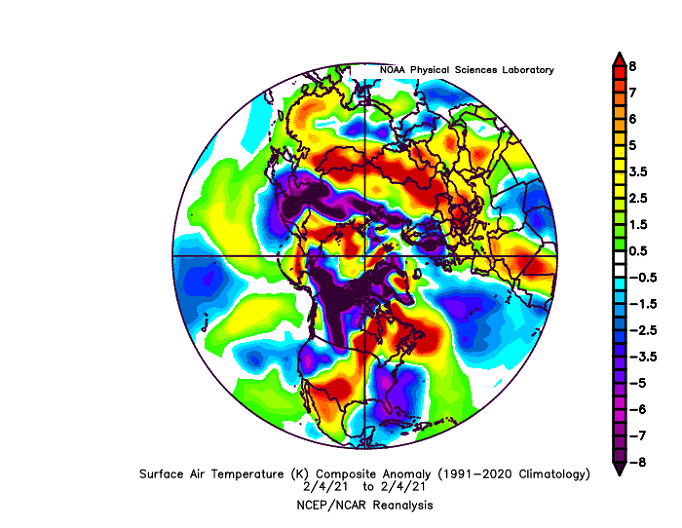
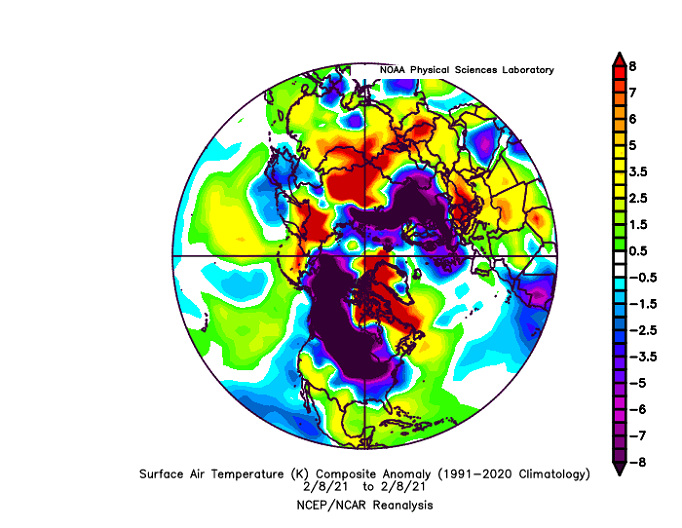
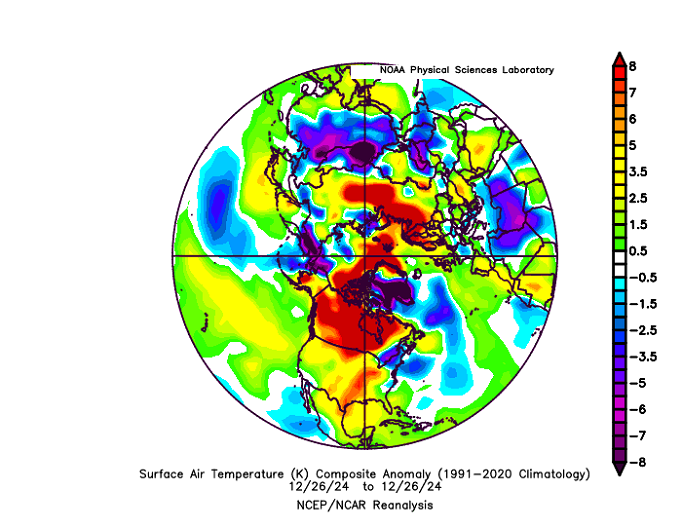
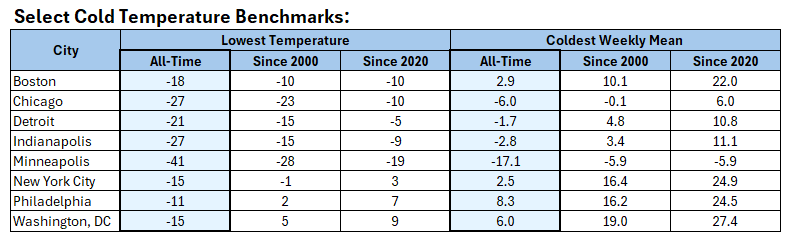
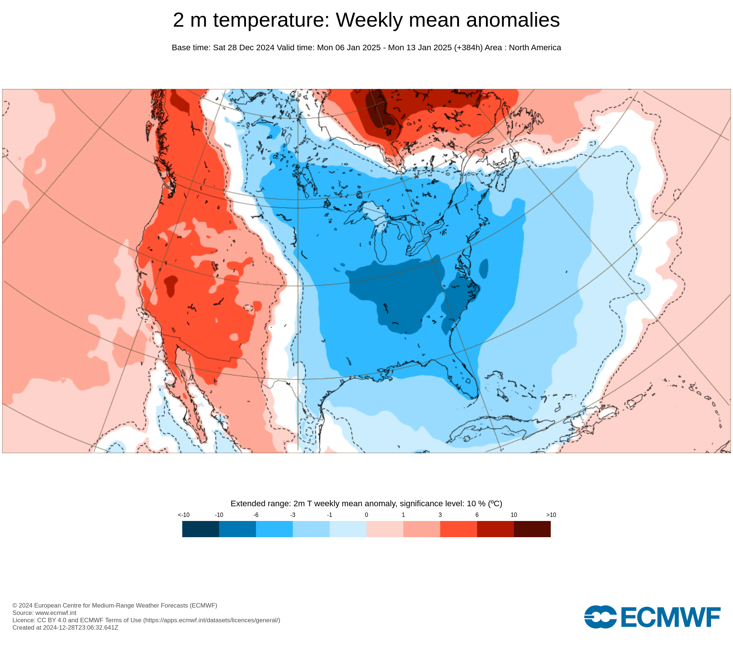
A quick follow-up: Truly bitter cold air remains in very limited supply in the Northern Hemisphere: Based on the latest data, even as the cold will be sustained, it likely won't be notable in many places. My own thinking from six days ago will be too cold. NYC and Philadelphia might see some teens, but single digits are unlikely. There's a chance that Boston may not even see teens courtesy of the powerful block suppressing the coldest air to the South. Detroit, Chicago, and Indianapolis could still see a subzero low, but for Detroit that is less likely than for Chicago or Indianapolis. Moreover, most of the below cities likely will not match or exceed their coldest low temperatures or coldest 7-day period since 2020. All this does not mean that the ECMWF weekly guidance will be incorrect. It's becoming clearer, that the guidance's cold anomaly is more the result of persistence of cold than severity of cold.

-
A gradual transition toward sustained colder than normal weather is ongoing. Temperatures could fall to below normal levels during or after the coming weekend. An upper level disturbance will likely bring some snow flurries and snow showers from Washington, DC to central New Jersey. Some areas could pick up a small accumulation. A more important storm will bring parts of the Middle Atlantic region a moderate to locally significant snowfall Sunday night into Monday. Washington, DC, Baltimore, and Philadelphia have the potential to see 3"-6" of snow with locally higher amounts. The highest amounts will likely be centered over the Washington, DC-Baltimore area. Some degree of uncertainty persists. Once north of Philadelphia, accumulations could fall off quite rapidly. A light amount remains likely for the New York City area. With the storm appearing a little stronger and tracking slightly farther to the north on the guidance, the probability of Richmond's seeing an end to its current record streak of 1,082 days without daily 1" or greater daily snowfall has decreased. The risk of sleet and freezing rain there has increased. The second and third weeks of January will likely feature widespread cold anomalies in much of the eastern half of the CONUS and Canada south of the Hudson and James Bays. The potential exists for widespread cold anomalies of 6°-10° below normal during that week in parts of that region, particularly the Southeast. Severe cold still appears unlikely in the New York City and Philadelphia areas through at least mid-month. The ENSO Region 1+2 anomaly was -0.2°C and the Region 3.4 anomaly was -1.1°C for the week centered around December 25. For the past six weeks, the ENSO Region 1+2 anomaly has averaged +0.10°C and the ENSO Region 3.4 anomaly has averaged -0.53°C. Neutral ENSO conditions may still evolve into a La Niña event during the winter. Uncertainty as to whether a La Niña will actually develop persists. On the December 19 outlook, 56% of dynamical models but 0% of the statistical models forecast the development of a La Niña. The SOI was -5.36 today. The preliminary Arctic Oscillation (AO) was -1.461 today.
-
Yes, that is true. But it's still worth trying to identify those who routinely make irresponsibly extreme calls if the public is to be truly weather-aware.
-
Apparently the local NBC outlet called out one site that has been hyping coming extreme to historic cold for several weeks. Viewers were probably asking why the station wasn’t forecasting such cold. IMO, only when meteorologists start to call out their own peers for irresponsible claims will incentives for hyping events for clicks and engagement diminish. This is a welcome development.
-
Snowfall NYC subforum Jan 6 and OBS if needed
donsutherland1 replied to wdrag's topic in New York City Metro
There appears to be a significant disconnect between the snowfall forecast and QPF forecast on the National Blend of Models. Even where zero QPF is forecast, snow is forecast. I'm not aware of this issue having occurred with the prior version (4.1). I suspect that there is an adjustment algorithm concerning the edge of the snow shield that is leading to this disconnect. Taken literally, NYC would see 95:1 snow-liquid ratios. More than likely, either the QPF will prove to be higher or the snowfall will prove to be lower. Perhaps the disconnect will also disappear as the event grows nearer.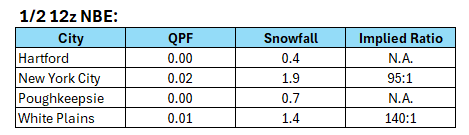
-
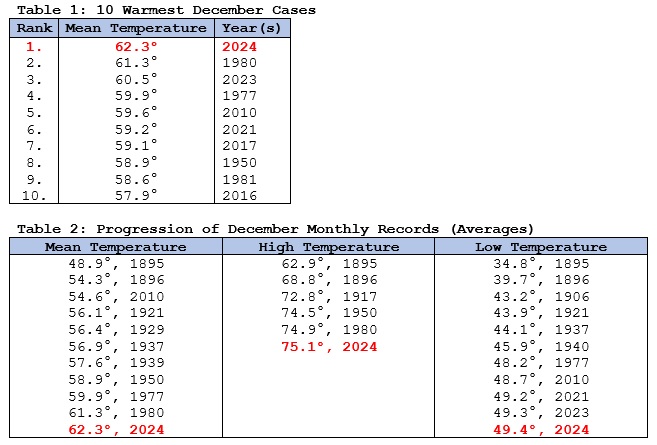
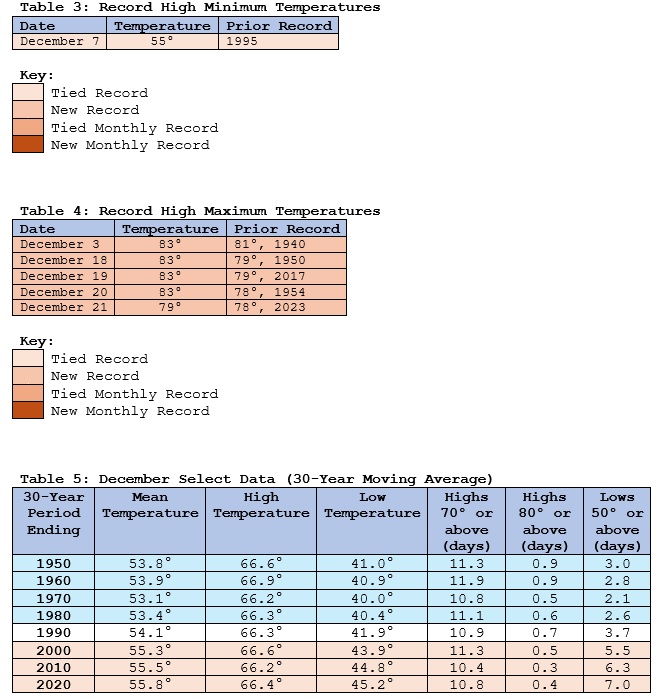
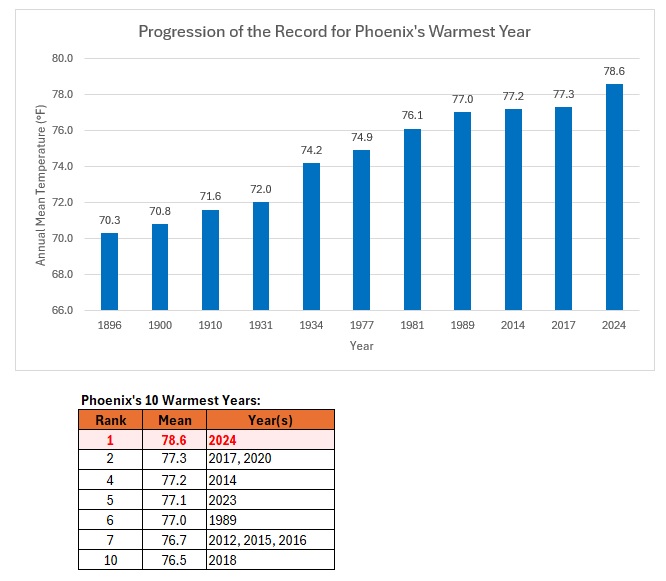
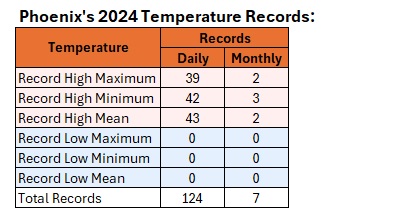
Phoenix Caps Off its Warmest Year with Its Warmest December on Record Phoenix capped off its warmest year on record with its warmest December on record. During 2024, Phoenix tied or broke 39 daily record high maximum temperatures, 42 daily record high minimum temperatures, and 43 record high mean temperatures. December has seen remarkable stability in the average monthly high temperatures. Its overall warming has been driven largely by increasing low temperatures. December 2024: Annual: During 2024, Phoenix also had an average high of 90.5° (old record: 89.8°, 1989) and an average low of 66.7° (old record: 65.5°, 2014).
-
A gradual transition toward sustained colder than normal weather is getting underway. Temperatures could fall to below normal readings during or after the coming weekend. The second and third weeks of January will likely feature widespread cold anomalies in much of the eastern half of the CONUS and Canada south of the Hudson and James Bays. The potential exists for widespread cold anomalies of 6°-10° below normal during that week in parts of that region, particularly the Southeast. Overall, January will likely be colder than normal in such cities as Philadelphia and New York City. Should the AO dive below -3.000, which now appears likely, the prospects for a significant or major snowfall in the New York City area could be reduced. Since 1950, a January AO ranging from -2.600 to -1.400 accounted for the largest share of 6" and 10" or above January snowfalls for storms that dumped 4" or more snow in New York City. For the 4" or above storms, 67% saw 6" or more while 56% went on to see 10" or more. When the AO was -3.000 or below, 60% of 4" or above snowstorms saw 6" or more snowfall, while 20% of those storms saw 10" or more. The exact synoptic details will be crucial to determining whether that potential will be realized. As a result, a storm that brings parts of the Middle Atlantic region a moderate snowfall Sunday night into Monday could bring only a light amount to the New York City area. It is possible that all of the snow could miss to the south of the City. Richmond will very likely see its current record streak of 1,081 days without daily 1" or greater snowfall come to an end. The NAO fell to a preliminary -2.751 on September 24th (all-time September record: -2.371, September 12, 1971). That was the 9th lowest value on record. La Niña winters following September cases where the NAO fell to -1.900 or below featured a predominantly positive NAO. The most recent such winters were 2016-2017 and 2022-2023. The mean temperatures for those winters in New York City were 39.3° and 41.0° respectively. The 1991-2020 normal value is 36.2°. A warmer to much warmer than normal outcome was favored by the November run of the ECMWF for Winter 2024-2025. Even as the NAO outlook appears on course to be relatively accurate, Winter 2024-2025 will likely wind up being notably colder than the subset of winters listed above. The ENSO Region 1+2 anomaly was -0.2°C and the Region 3.4 anomaly was -1.1°C for the week centered around December 25. For the past six weeks, the ENSO Region 1+2 anomaly has averaged +0.10°C and the ENSO Region 3.4 anomaly has averaged -0.53°C. Neutral ENSO conditions may still evolve into a La Niña event during the winter. Uncertainty as to whether a La Niña will actually develop persists. On the December 19 outlook, 56% of dynamical models but 0% of the statistical models forecast the development of a La Niña. The SOI was -1.97 today. The preliminary Arctic Oscillation (AO) was -1.282 today.
-
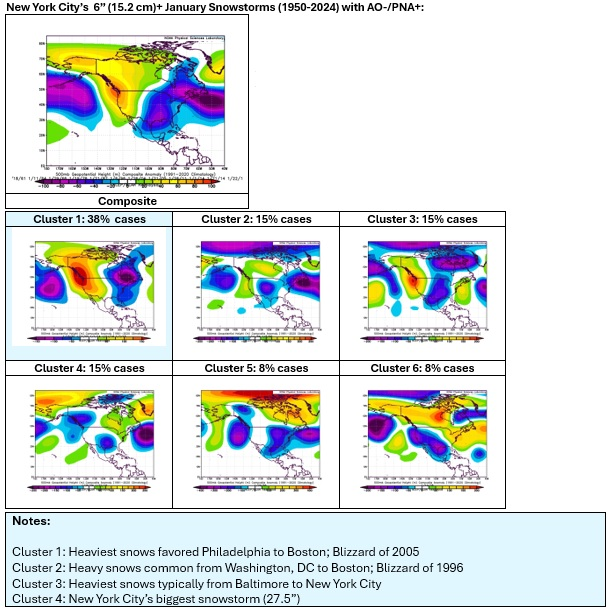
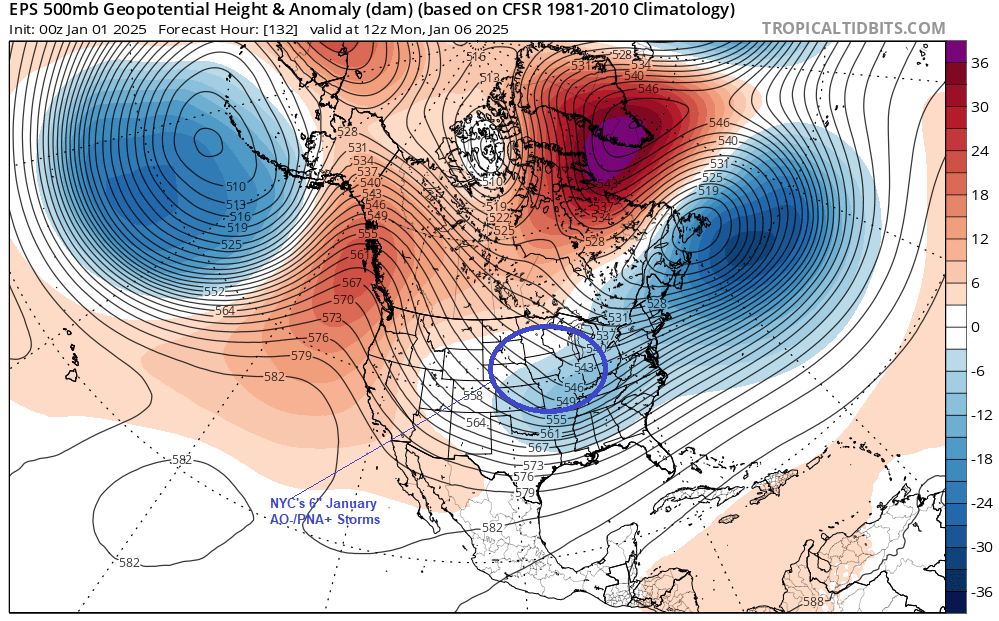
The AO is now forecast to drop toward -4.000 in coming days. That can lead to suppressed solutions. Indeed, the EPS 500 mb height anomalies at 132 hours illustrates the issue. I've compared the map with a cluster of 6" or greater January snowstorms for the NYC area during AO-/PNA+ regimes. That's why the best chance for accumulating snow--perhaps even a moderate snowstorm--will likely be from Philadelphia and southward. A light snowfall is possible in the NYC area, but one can't rule out the prospect that all of the snow misses to the south at this point. Put simply, the forecast pattern through at least January 10th is not conducive for KU snowstorms even as there will be sufficient cold. Richmond's ongoing record-breaking 1,081-day stretch without a 1" or above snowfall will likely end, perhaps on Sunday or Monday.
-
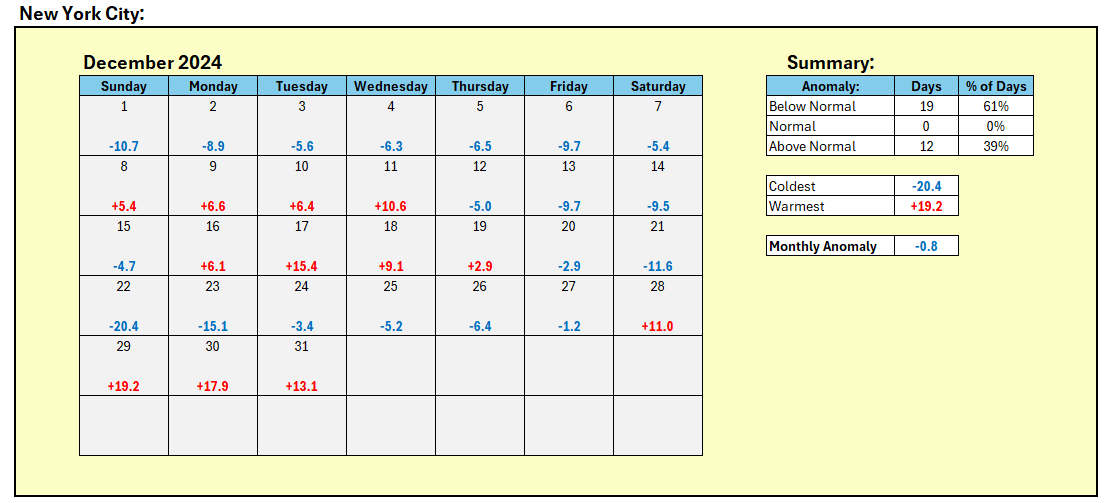
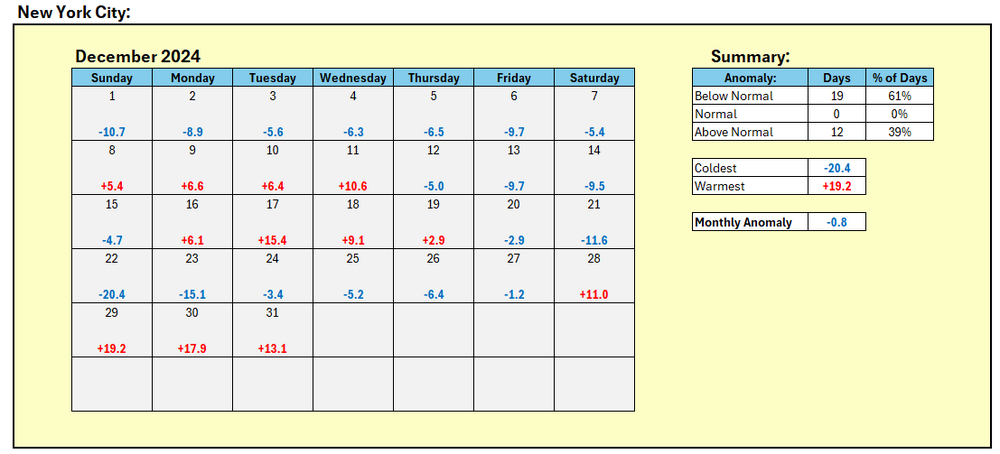
Final December numbers:
-
December is closing on a warmer than normal note, but a big change toward sustained colder weather lies ahead for January. The pattern will likely become more favorable for light or moderate snowfalls as the cold returns during the first week of January. The second and third weeks of January will likely feature widespread cold anomalies in much of the eastern half of the CONUS and Canada south of the Hudson and James Bays. The potential exists for widespread cold anomalies of 6°-10° below normal during that week in parts of that region, particularly the Southeast. Overall, January will likely be colder than normal in such cities as Philadelphia and New York City. Should the AO dive below -3.000, which now appears likely, the prospects for a significant or major snowfall in the New York City area could be reduced. Since 1950, a January AO ranging from -2.600 to -1.400 accounted for the largest share of 6" and 10" or above January snowfalls for storms that dumped 4" or more snow in New York City. For the 4" or above storms, 67% saw 6" or more while 56% went on to see 10" or more. When the AO was -3.000 or below, 60% of 4" or above snowstorms saw 6" or more snowfall, while 20% of those storms saw 10" or more. The exact synoptic details will be crucial to determining whether that potential will be realized. On account of a lack of snowfall, 2023-2024 will set new records for the lowest snowfall over a two-year period for Boston and New York City. Boston: 2023-2024 Total to Date: 26.9"; Record: 38.2", 1979-1980 New York City: 2023-2024 Total to Date: 12.6"; Record: 17.4", 1997-1998 The NAO fell to a preliminary -2.751 on September 24th (all-time September record: -2.371, September 12, 1971). That was the 9th lowest value on record. La Niña winters following September cases where the NAO fell to -1.900 or below featured a predominantly positive NAO. The most recent such winters were 2016-2017 and 2022-2023. The mean temperatures for those winters in New York City were 39.3° and 41.0° respectively. The 1991-2020 normal value is 36.2°. A warmer to much warmer than normal outcome was favored by the November run of the ECMWF for Winter 2024-2025. Even as the NAO outlook appears on course to be relatively accurate, Winter 2024-2025 will likely wind up being notably colder than the subset of winters listed above. The ENSO Region 1+2 anomaly was -0.2°C and the Region 3.4 anomaly was -1.1°C for the week centered around December 25. For the past six weeks, the ENSO Region 1+2 anomaly has averaged +0.10°C and the ENSO Region 3.4 anomaly has averaged -0.53°C. Neutral ENSO conditions may still evolve into a La Niña event during the winter. Uncertainty as to whether a La Niña will actually develop persists. On the December 19 outlook, 56% of dynamical models but 0% of the statistical models forecast the development of a La Niña. The SOI was -7.58 today. The preliminary Arctic Oscillation (AO) was -0.855 today.
-
DCA -5.0 NYC -2.5 BOS -1.0 ORD -2.0 ATL -5.5 IAH -0.7 DEN +0.8 PHX + 3.2 SEA +3.0
-
Yes. It illustrates that even within a week, the ensembles can be incorrect.
-
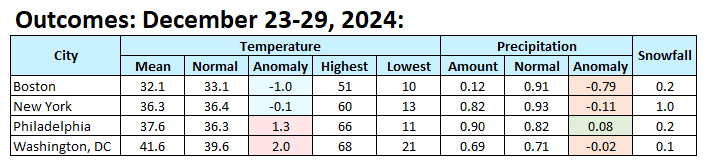
The weekly outcome:
-
Today was an unseasonably mild day in the Mid-Atlantic region. High temperatures included: Atlantic City: 63° Baltimore: 65° Bridgeport: 56° Islip: 56° New York City: 60° Newark: 65° Norfolk: 72° Philadelphia: 66° Reading: 65° (old record: 64°, 1982) Richmond: 69° Trenton: 65° Washington, DC: 67° December will close with above to much above normal temperatures and additional periods of rain. The opening days of January will likely also begin with above normal temperatures, but it will start to turn colder. Snowfall prospects will remain limited through the end of December. However, the pattern will likely become more favorable for moderate or perhaps larger snowfalls as the cold returns during the first week of January. The second week of January will likely feature widespread cold anomalies in much of the eastern half of the CONUS and Canada south of the Hudson and James Bays. The potential exists for widespread cold anomalies of 6°-10° below normal during that week in that region. Should the AO dive below -3.000, the prospects for a significant or major snowfall in the New York City area could be reduced. Since 1950, a January AO ranging from -2.600 to -1.400 accounted for the largest share of 6" and 10" or above January snowfalls for storms that dumped 4" or more snow in New York City. For the 4" or above storms, 67% saw 6" or more while 56% went on to see 10" or more. When the AO was -3.000 or below, 60% of 4" or above snowstorms saw 6" or more snowfall, while 20% of those storms saw 10" or more. The exact synoptic details will be crucial to determining whether that potential will be realized. On account of a lack of snowfall, 2023-2024 will set new records for the lowest snowfall over a two-year period for Boston and New York City. Boston: 2023-2024 Total to Date: 26.9"; Record: 38.2", 1979-1980 New York City: 2023-2024 Total to Date: 12.6"; Record: 17.4", 1997-1998 The NAO fell to a preliminary -2.751 on September 24th (all-time September record: -2.371, September 12, 1971). That was the 9th lowest value on record. La Niña winters following September cases where the NAO fell to -1.900 or below featured a predominantly positive NAO. The most recent such winters were 2016-2017 and 2022-2023. The mean temperatures for those winters in New York City were 39.3° and 41.0° respectively. The 1991-2020 normal value is 36.2°. A warmer to much warmer than normal outcome was favored by the November run of the ECMWF for Winter 2024-2025. Even as the NAO outlook appears on course to be relatively accurate, Winter 2024-2025 will likely wind up being notably colder than the subset of winters listed above. The ENSO Region 1+2 anomaly was -0.2°C and the Region 3.4 anomaly was -0.8°C for the week centered around December 18. For the past six weeks, the ENSO Region 1+2 anomaly has averaged +0.17°C and the ENSO Region 3.4 anomaly has averaged -0.35°C. Neutral ENSO conditions may still evolve into a La Niña event during the winter. Uncertainty as to whether a La Niña will actually develop persists. On the December 19 outlook, 56% of dynamical models but 0% of the statistical models forecast the development of a La Niña. The SOI was +3.06 today. The preliminary Arctic Oscillation (AO) was +0.226 today. Based on sensitivity analysis applied to the latest guidance, there is an implied near 100% probability that New York City will have a colder than normal December (1991-2020 normal). December will likely finish with a mean temperature near 38.0° (1.1° below normal).
-
The fireworks of the December 29 0z ECMWF and GFS runs have now faded. Even as those runs aren't cast in stone, they provided a glimpse of the potential that lies ahead. A colder pattern will develop starting around January 2-3. As an AO-/PNA+ pattern develops, the potential for moderate or perhaps significant snowfalls will increase in the northern Mid-Atlantic region, including the New York City area. The cold will be in place. There will be some short waves that offer the possibility of blossoming into storms. Synoptic details will be crucial. From this far out, they can't be resolved with reliability. Individual ensemble member snowfall forecasts maintain a wide spread among dates (January 6-12). Typically, they converge on a single narrow timeframe in advance of a significant or major event. In the meantime, below are 500 mb clusters for New York City's January 6" or above snowstorms during AO-/PNA+ regimes, which are most favorable for significant events relative to climatology, for reference.