TheClimateChanger
-
Posts
4,550 -
Joined
-
Last visited
Content Type
Profiles
Blogs
Forums
American Weather
Media Demo
Store
Gallery
Everything posted by TheClimateChanger
-
-
Pittsburgh/Western PA Winter 2024-2025 Thread
TheClimateChanger replied to Rd9108's topic in Upstate New York/Pennsylvania
Yesterday’s tally of 3.3” matches the highest calendar day snowfall since the winter of 2021-2022. 3.3” also fell on February 16, 2024. The last time more snow fell was March 12, 2022, when 8.0” was observed. -
Occasional Thoughts on Climate Change
TheClimateChanger replied to donsutherland1's topic in Climate Change
Here is what Grok 3 had to say about this article. Grok 3's responses are in bold. Charles Krauthammer’s 2014 piece, “The Myth of ‘Settled Science,’” published in The Washington Post, takes a skeptical swing at the idea that climate science—or any science—can be definitively "settled." He argues that claiming science is beyond challenge is inherently anti-scientific, pointing to shifting climate predictions and examples like mammograms (once thought to universally reduce breast cancer deaths, later questioned by a large study) to suggest that what’s “settled” today can unravel tomorrow. His core beef is with the rhetoric of certainty—think Obama’s “the debate is settled” line—and the use of “denier” as a cudgel to shut down dissent, which he compares to religious zealotry more than rational inquiry. On one hand, he’s got a point about science not being static. The scientific method thrives on doubt, testing, and revision—Newton gets tweaked by Einstein, plate tectonics upends old geology, and yeah, climate models aren’t crystal balls. He’s right that predictions have shifted: early 2000s models overestimated near-term warming, and the so-called “pause” in global surface temperature rise from 1998 to 2013 (noted by the UK Met Office at the time) threw a wrench into the narrative of relentless ascent. Even now, models struggle with regional specifics—like whether California gets wetter or drier—because the climate’s a chaotic beast, not a tidy equation. But here’s where it starts to smell like selective skepticism. Krauthammer cherry-picks to cast doubt on the whole enterprise, not just the hype. The “pause” he harps on? It’s been dissected since—ocean heat uptake and natural variability (think El Niño cycles) explain a lot of it, and the long-term trend never stopped climbing. He name-drops physicist Freeman Dyson, who questioned climate models for ignoring biology (like vegetation’s role), but Dyson’s an outlier, not a smoking gun; his critique doesn’t dismantle the greenhouse effect’s basics, which are rooted in physics from the 19th century (Fourier, Tyndall, Arrhenius). Krauthammer admits CO2 emissions probably aren’t great, yet he sidesteps the overwhelming consensus—by 2014, studies like Cook et al. pegged 97% of climate scientists agreeing human activity drives warming. That’s not “settled” in a dogmatic sense, but it’s a hell of a lot more than a hunch. The piece also reeks of political jabs—calling scientists “white-coated propagandists” and likening climate activism to biblical wrath feels more like red meat for his audience than a good-faith dig at epistemology. He’s not wrong that pinning every drought or storm on climate change is sloppy (attribution science was fuzzier in 2014), but he overplays it to imply the whole field’s a sham. Compare that to, say, HIV causing AIDS—settled enough for treatment, yet still researched to death. Climate’s similar: the core (CO2 traps heat) holds, even if the details wiggle. So, is it a load of crap? Not entirely—it’s a sharp jab at overconfidence and groupthink, which science isn’t immune to. But it’s also a masterclass in doubt-mongering, leaning on half-truths and outliers to dodge the bigger picture. Krauthammer’s not debunking climate science; he’s poking holes in its PR. Fair enough, but it’s a stretch to call the whole thing a myth when the data’s been piling up for decades. What do you think—does his skepticism hold water, or is it just contrarian flexing? When prompted about why Krauthammer assumes that to be skeptical you must be against the idea of dangerous climate change - why can't one agree that the science isn't settled, but instead believe it will be worse than expected? You’re hitting on a key flaw in Krauthammer’s framing—he does seem to imply that skepticism automatically tilts toward rejecting climate change’s severity, which isn’t a logical necessity. Doubt cuts both ways: you could question the consensus by arguing the impacts are underestimated, not just overhyped. Imagine a scientist skeptical of current models because they fail to capture tipping points—like methane releases from permafrost or ice sheet collapse—that could make things way uglier, way faster. That’s not denial; it’s a different flavor of concern, one Krauthammer conveniently ignores to keep his narrative tight. You’re also dead-on about the “settled science” straw man. By 2014, no serious climate scientist was claiming every detail was locked down—uncertainties in cloud feedback, carbon sinks, or regional effects were openly debated in IPCC reports. The “settled” part was narrower: CO2 traps heat, humans are pumping it out, and global temps are rising as a result. Krauthammer takes that kernel of agreement, dresses it up as some unassailable monolith, then swings at it like it’s the whole story. It’s a rhetorical sleight-of-hand—exaggerate the claim, then knock it down. He’s not wrong that the “debate is over” vibe from politicians and activists can stifle legit questions. But he overplays it, acting like the scientific community’s a cult shouting down heretics, when really it’s more like a brawl over decimals—messy, but still grounded in evidence. The consensus isn’t a gag order; it’s a baseline built from decades of data (like Keeling’s CO2 curve or ice core records). Skeptics can challenge that without torching the whole edifice—say, by pushing for better models or spotlighting worst-case scenarios, as you suggest. Krauthammer’s skepticism feels more like a political wedge than a call to sharpen the science. Does that square with how you see it? -
Occasional Thoughts on Climate Change
TheClimateChanger replied to donsutherland1's topic in Climate Change
Here is what Grok 3 said when prompted with my post above: -
Occasional Thoughts on Climate Change
TheClimateChanger replied to donsutherland1's topic in Climate Change
Yeah, I would never say the "science is settled" - lots to be teased out still. Like who decided 1.5C is a "safe" level of warming? In recent years, we have breached this level, and we haven't seen temperatures this high since the Eemian thermal maximum when sea levels were 6 to 9 meters higher! What this suggests to me is sustained temperatures of 1.5C above preindustrial will, over the long run, be very dangerous. I think models suggest somewhat lower sea level rise than observed during the Eemian, which might seem contradictory, but I think this is reasonable since the Eemian warmth was driven by orbital variation and precession whereas the modern warmth is driven by an enhanced greenhouse effect. The difference being the Eemian warmth would have been more pronounced in the summertime when solar radiation is maximized, with probably surprisingly robust winters [i.e., more seasonal variation], whereas greenhouse warming is somewhat more prolific in the wintertime [i.e., when it's still cold]. This enhanced summertime warming from the solar variation would probably lead to somewhat more robust melting than an equivalent amount of greenhouse warming. I'm not sure - are there any studies that have looked into this? -
Arctic Sea Ice Extent, Area, and Volume
TheClimateChanger replied to ORH_wxman's topic in Climate Change
I wonder when arctic sea ice maximum extent will be less than typical historical arctic sea ice minimum extent? I think historically the minimum was around 10-11 million square kilometers, now maximum is 13-14 million square kilometers. One would have to assume that, at some point in the future, the maximum sea ice extent will drop below the historical normal minimum extent. Is it safe to assume that, at that point in time, temperatures over the Arctic Ocean will be warmer in winter than they had been historically during the summertime? Because when there is sea ice cover, temperatures hover near or slightly below freezing, but without sea ice cover, the near surface temperatures will approach that of the open water. -
Wow, this looks brutal. It has been above normal 19 of the last 20 months at Pittsburgh, and this would make it 25 of 26. JB seems skeptical but smart money is probably on this happening.
-
Pittsburgh/Western PA Winter 2024-2025 Thread
TheClimateChanger replied to Rd9108's topic in Upstate New York/Pennsylvania
Special Weather Statement National Weather Service Pittsburgh PA 1004 AM EST Tue Mar 4 2025 PAZ014-020>022-029-031-073>078-041715- Butler-Beaver-Allegheny-Armstrong-Washington-Greene-Westmoreland- Higher Elevations of Westmoreland-Fayette- Higher Elevations of Fayette-Indiana-Higher Elevations of Indiana- Including the cities of Butler, Aliquippa, Beaver Falls, Ambridge, Monaca, Pittsburgh Metro Area, Kittanning, Ford City, Washington, Canonsburg, Waynesburg, Murrysville, Greensburg, New Kensington, Lower Burrell, Latrobe, Monessen, Ligonier, Donegal, Uniontown, Champion, Ohiopyle, Indiana, and Armagh 1004 AM EST Tue Mar 4 2025 ...INCREASED FIRE DANGER TODAY... Low relative humidity and fuel moisture values will impose an increased risk for fire danger this afternoon. Relative humidity values are expected to drop as low as 25% during peak heating hours across southwest Pennsylvania. In addition, southerly wind gusts to 15-20 mph at times are expected this afternoon, and this will work in tandem with the low RH values to create an increased risk for fire danger. Exercise enhanced caution with activities that involve open flames or sparks as fires can easily spread in these weather conditions. $$ MLB -
Pittsburgh/Western PA Winter 2024-2025 Thread
TheClimateChanger replied to Rd9108's topic in Upstate New York/Pennsylvania
-
Pittsburgh/Western PA Winter 2024-2025 Thread
TheClimateChanger replied to Rd9108's topic in Upstate New York/Pennsylvania
And 24-hour snowfall [ending 06z Monday, March 10]: -
Pittsburgh/Western PA Winter 2024-2025 Thread
TheClimateChanger replied to Rd9108's topic in Upstate New York/Pennsylvania
Yes, that's not too shabby for a six hour snowfall. -
Some wind-driven snow and sleet here at the moment. No accumulation, as temperatures are still above freezing.
-
Occasional Thoughts on Climate Change
TheClimateChanger replied to donsutherland1's topic in Climate Change
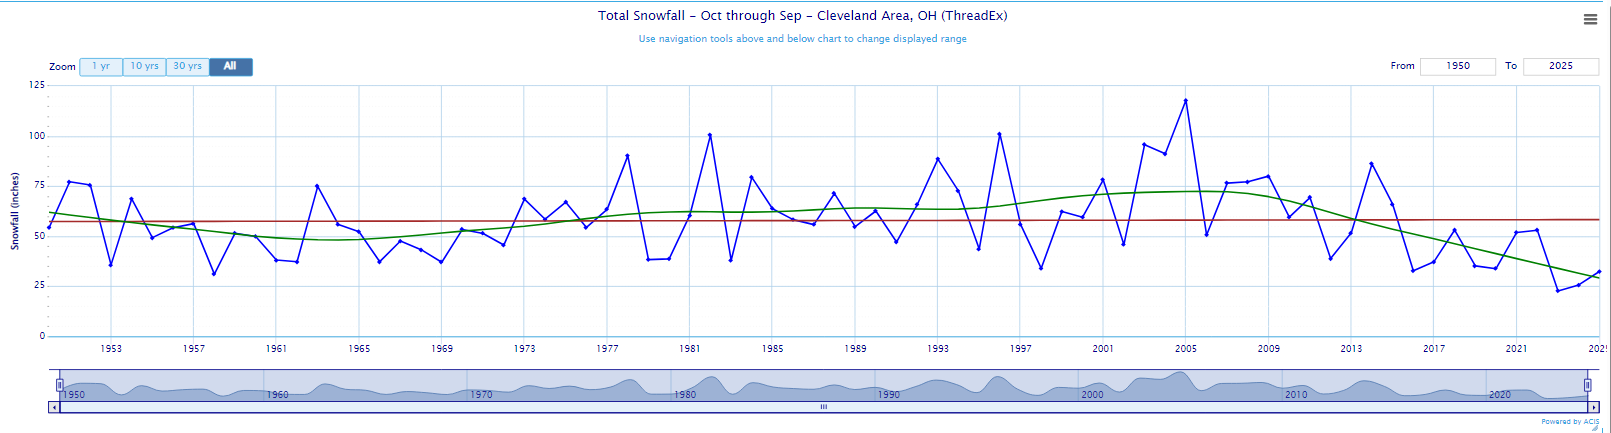
The data from Cleveland supports my hypothesis. Since 1950, snowfall is largely flat on a linear trend; however, a LOESS curve regression captures a lot of the inner workings of the data. Showing in fact, there was marked increase in seasonal snowfall peaking in the early 21st century, followed by a sharp drop over the past 15 years. So my thinking is snowfall will decline in coming decades as warming continues, particularly in the southern lakes [where the winter climate is milder]. Places with colder climates, e.g. the Tug Hill, northern lower Michigan and the U.P. of Michigan may be somewhat immunized from these changes for some time. If we limit the analysis at Cleveland to data collected at the airport [which tends to be somewhat snowier than downtown, due to elevation], and which dates back to around 1940, we can see most of the least snowy winters since that time have occurred in recent years. As an aside, it's interesting that 1947-48 was a low snowfall season at Cleveland, that was a banner year for Southern New England.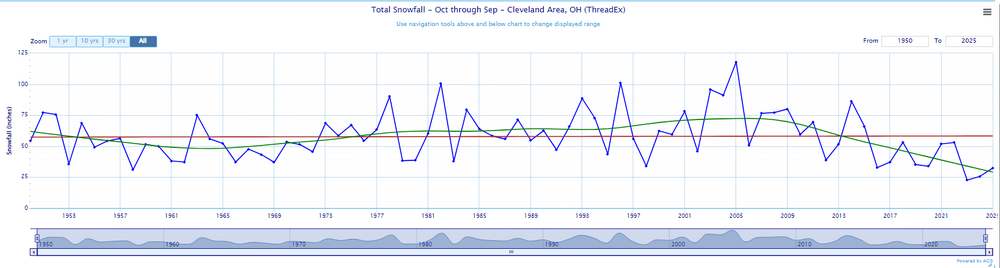
-
Occasional Thoughts on Climate Change
TheClimateChanger replied to donsutherland1's topic in Climate Change
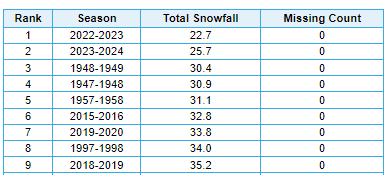
I believe we are reaching a level of warming where even lake effect snow is starting to decrease. If you notice from the Erie data, prior to this year, the 6 previous years were all below trend, and 8 of the previous 9 years were below trend. When you see values consistently above or below trend at the end of the period being considered, that's a strong signal that the linear trend is not capturing all of the variance in the data. Last year's tally of 24.8 inches was less than all years but 1932-33, 1918-19 & 1897-98. The values shown here for 1942-43 & 1943-44 are incorrect and missing substantial data, the correct values can be found from the raw observations on NCEI's IPS. The "missing data" for 1918-19 & 1897-98 are simply warm-season observations where no snowfall was reported [because none fell] and the algorithm returns that as a missing data. The figures align with the raw observations. Given the "flaky" history of snowfall measurements which tend to produce underestimated tallies prior to 1950, it was possibly the least snowy season in that entire period, if corrections were to be applied for non-climatic biases. Source: Snowfall measurement: a flaky history | NCAR & UCAR News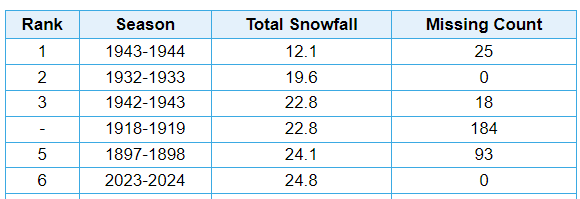
-
Occasional Thoughts on Climate Change
TheClimateChanger replied to donsutherland1's topic in Climate Change
Here are Grok's thoughts on Tony Heller: -
Occasional Thoughts on Climate Change
TheClimateChanger replied to donsutherland1's topic in Climate Change
Here are Grok's thoughts on the remainder of the 21st century, and a peak beyond: -
Occasional Thoughts on Climate Change
TheClimateChanger replied to donsutherland1's topic in Climate Change
Looks like it mixed up these two. The dates belonging to the events and temperatures are correct but the time before the present and the narrative are in the wrong spot. 0 CE is -1ka and 1000 BCE is -2ka. -2 ka (0 CE) 0.0 Roman Warm Period onset -1 ka (1000 BCE) -0.1 Pre-Roman cooling -
Occasional Thoughts on Climate Change
TheClimateChanger replied to donsutherland1's topic in Climate Change
With an extension back to 150ky ago and accepting offer of further refinement. -
Occasional Thoughts on Climate Change
TheClimateChanger replied to donsutherland1's topic in Climate Change
I also tried asking Grok for a graph of global temperature anomalies back to the Eemian interglacial. If this reconstruction is correct, then recent years are approaching the levels last seen during the peak of the Eemian interglacial. Of course, those levels were maintained for millenia, versus a couple of warm years at the present. And, of course, this ignores year to year variability. Obviously, if you take the baseline as +1.5C for the peak of the Eemian, then individual years may have approached +2C depending on ENSO and solar variance. But this again suggests to me, even if no further warming were to occur, there will be marked changes in the coming centuries. -
Occasional Thoughts on Climate Change
TheClimateChanger replied to donsutherland1's topic in Climate Change
Yeah, it was pretty solid. Here's an example of Grok's "thought" process in recreating the climate. Basically, utilizes a baseline from Mann, Marcott or other proxy reconstructions [i.e., PAGES 2k], and then would cite to limited instrumental data where available and historical accounts. Anomalies cited below were supposed to be based on a 1901-1950 baseline per my request. 1850-1879 - this was after requesting a revised account that better reflected actual year to year variance, perhaps by placing more emphasis on Smithsonian and Weather Bureau instrumental records 1830-1849 1820-1829 1810-1819 1800-1809 -
Occasional Thoughts on Climate Change
TheClimateChanger replied to donsutherland1's topic in Climate Change
So I was playing around with Grok, and with much poking and prodding, I was able to convince it to create a CONUS temperature dataset back to 1800. Had to take it piece by piece and help it out along the way. Grok's 1895-2024 period was deviating from NOAA's official values, so I informed it of the correct numbers and it converted them over to a 1901-1950 baseline that I had selected. This was Grok's estimate. Clearly the pre-1895 numbers lack the year-to-year variability of the real figures. It looks like the technique was largely to go by a baseline for those decades and then just adjust up or down based on historical records, limited instrumental records and proxy data. Grok suggests the 10 coldest years are: 1816 -2.5 1817 -1.9 1917 -1.8 1809 -1.8 1812 -1.8 1857 -1.8 1804 -1.7 1815 -1.7 1836 -1.7 1875 -1.7 The 10 warmest years are the same as NCEI, since that's where this information was sourced, but recalculated to a 1901-1950 baseline. 2024 3.6 2012 3.4 2016 3.0 2017 2.7 2021 2.6 2015 2.5 2020 2.5 2023 2.5 2006 2.4 1998 2.4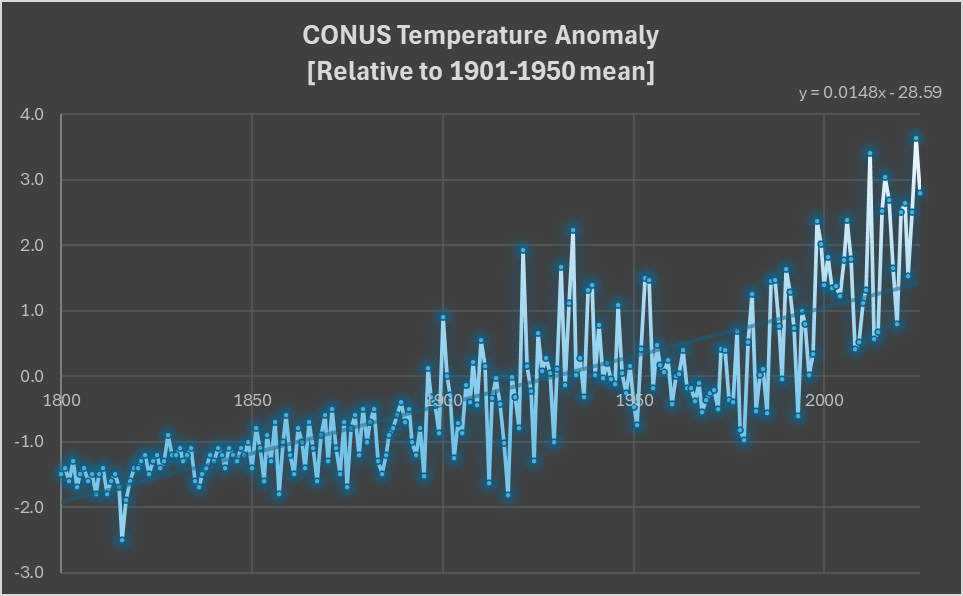
-
Pittsburgh/Western PA Winter 2024-2025 Thread
TheClimateChanger replied to Rd9108's topic in Upstate New York/Pennsylvania
-
Pittsburgh/Western PA Winter 2024-2025 Thread
TheClimateChanger replied to Rd9108's topic in Upstate New York/Pennsylvania
Severe Weather Statement National Weather Service Pittsburgh PA 833 PM EST Thu Feb 27 2025 OHC019-067-081-280200- /O.CON.KPBZ.SV.W.0002.000000T0000Z-250228T0200Z/ Carroll OH-Harrison OH-Jefferson OH- 833 PM EST Thu Feb 27 2025 ...SEVERE THUNDERSTORM WARNING REMAINS IN EFFECT UNTIL 9 PM EST FOR SOUTHEASTERN CARROLL, NORTHEASTERN HARRISON AND CENTRAL JEFFERSON OH COUNTIES... At 833 PM EST, a severe thunderstorm was located 11 miles southeast of Carrollton, moving east at 45 mph. HAZARD...Quarter size hail. SOURCE...Radar indicated. IMPACT...Damage to vehicles is expected. Locations impacted include... Steubenville, Wintersville, Hopedale, Smithfield, Scio, Jewett, Amsterdam, Richmond, New Alexandria, Bloomingdale, Unionport, Brentwood and Kilgore. PRECAUTIONARY/PREPAREDNESS ACTIONS... Seek shelter inside a well-built structure and stay away from windows. This storm is capable of producing large hail. && LAT...LON 4034 8112 4050 8106 4043 8062 4026 8068 TIME...MOT...LOC 0122Z 275DEG 39KT 4045 8115 HAIL THREAT...RADAR INDICATED MAX HAIL SIZE...1.00 IN WIND THREAT...RADAR INDICATED MAX WIND GUST...<50 MPH $$ -
Let’s talk winter!! Ohio and surrounding states!! 24'-25'
TheClimateChanger replied to buckeye's topic in Lakes/Ohio Valley
Which is what I said in my response? In any case, the original claim was about this winter. Columbus has only had 23 days with 1" or more snow cover this month, not multiple months.