TheClimateChanger
-
Posts
4,593 -
Joined
-
Last visited
Content Type
Profiles
Blogs
Forums
American Weather
Media Demo
Store
Gallery
Everything posted by TheClimateChanger
-
Wow, this looks brutal. It has been above normal 19 of the last 20 months at Pittsburgh, and this would make it 25 of 26. JB seems skeptical but smart money is probably on this happening.
-
Pittsburgh/Western PA Winter 2024-2025 Thread
TheClimateChanger replied to Rd9108's topic in Upstate New York/Pennsylvania
Special Weather Statement National Weather Service Pittsburgh PA 1004 AM EST Tue Mar 4 2025 PAZ014-020>022-029-031-073>078-041715- Butler-Beaver-Allegheny-Armstrong-Washington-Greene-Westmoreland- Higher Elevations of Westmoreland-Fayette- Higher Elevations of Fayette-Indiana-Higher Elevations of Indiana- Including the cities of Butler, Aliquippa, Beaver Falls, Ambridge, Monaca, Pittsburgh Metro Area, Kittanning, Ford City, Washington, Canonsburg, Waynesburg, Murrysville, Greensburg, New Kensington, Lower Burrell, Latrobe, Monessen, Ligonier, Donegal, Uniontown, Champion, Ohiopyle, Indiana, and Armagh 1004 AM EST Tue Mar 4 2025 ...INCREASED FIRE DANGER TODAY... Low relative humidity and fuel moisture values will impose an increased risk for fire danger this afternoon. Relative humidity values are expected to drop as low as 25% during peak heating hours across southwest Pennsylvania. In addition, southerly wind gusts to 15-20 mph at times are expected this afternoon, and this will work in tandem with the low RH values to create an increased risk for fire danger. Exercise enhanced caution with activities that involve open flames or sparks as fires can easily spread in these weather conditions. $$ MLB -
Pittsburgh/Western PA Winter 2024-2025 Thread
TheClimateChanger replied to Rd9108's topic in Upstate New York/Pennsylvania
-
Pittsburgh/Western PA Winter 2024-2025 Thread
TheClimateChanger replied to Rd9108's topic in Upstate New York/Pennsylvania
And 24-hour snowfall [ending 06z Monday, March 10]: -
Pittsburgh/Western PA Winter 2024-2025 Thread
TheClimateChanger replied to Rd9108's topic in Upstate New York/Pennsylvania
Yes, that's not too shabby for a six hour snowfall. -
Some wind-driven snow and sleet here at the moment. No accumulation, as temperatures are still above freezing.
-
Occasional Thoughts on Climate Change
TheClimateChanger replied to donsutherland1's topic in Climate Change
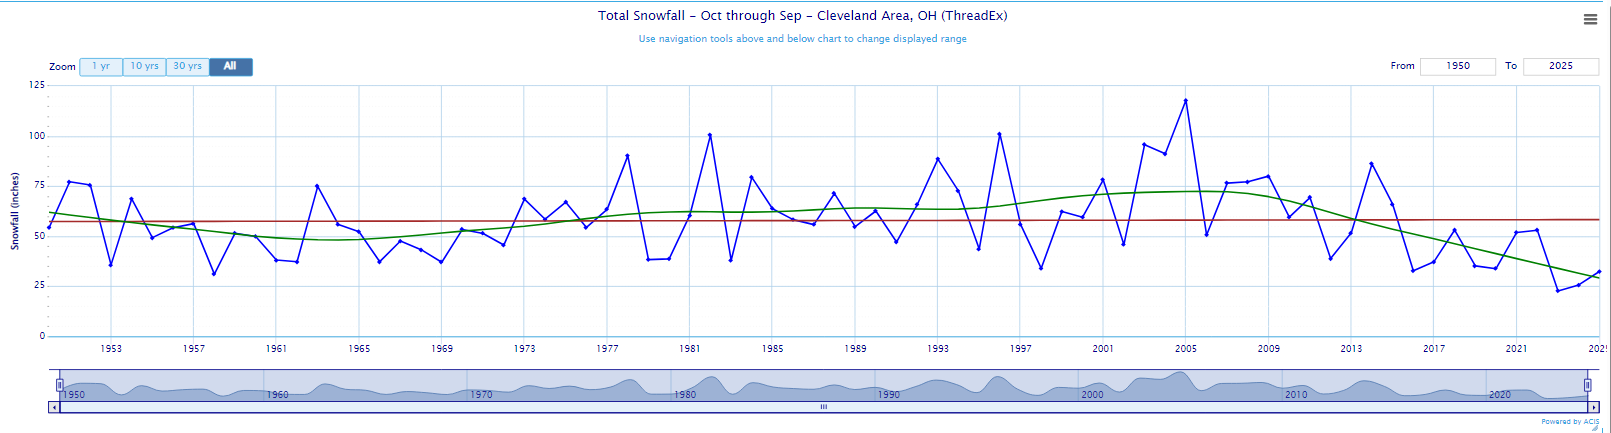
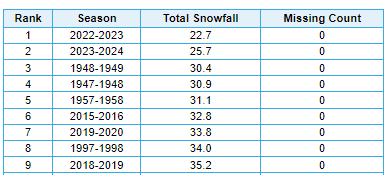
The data from Cleveland supports my hypothesis. Since 1950, snowfall is largely flat on a linear trend; however, a LOESS curve regression captures a lot of the inner workings of the data. Showing in fact, there was marked increase in seasonal snowfall peaking in the early 21st century, followed by a sharp drop over the past 15 years. So my thinking is snowfall will decline in coming decades as warming continues, particularly in the southern lakes [where the winter climate is milder]. Places with colder climates, e.g. the Tug Hill, northern lower Michigan and the U.P. of Michigan may be somewhat immunized from these changes for some time. If we limit the analysis at Cleveland to data collected at the airport [which tends to be somewhat snowier than downtown, due to elevation], and which dates back to around 1940, we can see most of the least snowy winters since that time have occurred in recent years. As an aside, it's interesting that 1947-48 was a low snowfall season at Cleveland, that was a banner year for Southern New England.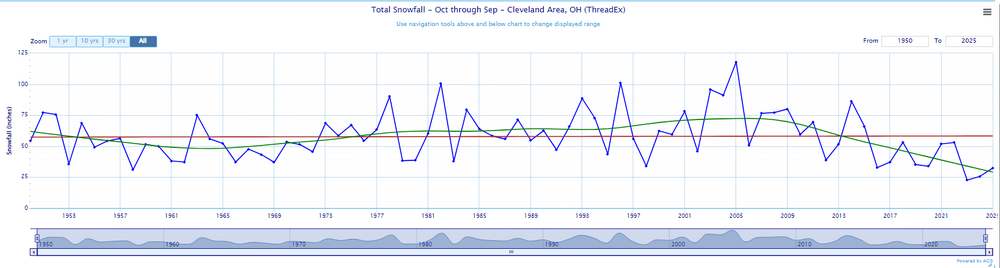
-
Occasional Thoughts on Climate Change
TheClimateChanger replied to donsutherland1's topic in Climate Change
I believe we are reaching a level of warming where even lake effect snow is starting to decrease. If you notice from the Erie data, prior to this year, the 6 previous years were all below trend, and 8 of the previous 9 years were below trend. When you see values consistently above or below trend at the end of the period being considered, that's a strong signal that the linear trend is not capturing all of the variance in the data. Last year's tally of 24.8 inches was less than all years but 1932-33, 1918-19 & 1897-98. The values shown here for 1942-43 & 1943-44 are incorrect and missing substantial data, the correct values can be found from the raw observations on NCEI's IPS. The "missing data" for 1918-19 & 1897-98 are simply warm-season observations where no snowfall was reported [because none fell] and the algorithm returns that as a missing data. The figures align with the raw observations. Given the "flaky" history of snowfall measurements which tend to produce underestimated tallies prior to 1950, it was possibly the least snowy season in that entire period, if corrections were to be applied for non-climatic biases. Source: Snowfall measurement: a flaky history | NCAR & UCAR News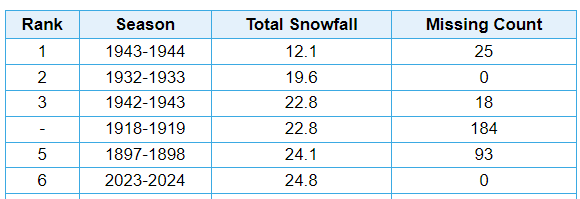
-
Occasional Thoughts on Climate Change
TheClimateChanger replied to donsutherland1's topic in Climate Change
Here are Grok's thoughts on Tony Heller: -
Occasional Thoughts on Climate Change
TheClimateChanger replied to donsutherland1's topic in Climate Change
Here are Grok's thoughts on the remainder of the 21st century, and a peak beyond: -
Occasional Thoughts on Climate Change
TheClimateChanger replied to donsutherland1's topic in Climate Change
Looks like it mixed up these two. The dates belonging to the events and temperatures are correct but the time before the present and the narrative are in the wrong spot. 0 CE is -1ka and 1000 BCE is -2ka. -2 ka (0 CE) 0.0 Roman Warm Period onset -1 ka (1000 BCE) -0.1 Pre-Roman cooling -
Occasional Thoughts on Climate Change
TheClimateChanger replied to donsutherland1's topic in Climate Change
With an extension back to 150ky ago and accepting offer of further refinement. -
Occasional Thoughts on Climate Change
TheClimateChanger replied to donsutherland1's topic in Climate Change
I also tried asking Grok for a graph of global temperature anomalies back to the Eemian interglacial. If this reconstruction is correct, then recent years are approaching the levels last seen during the peak of the Eemian interglacial. Of course, those levels were maintained for millenia, versus a couple of warm years at the present. And, of course, this ignores year to year variability. Obviously, if you take the baseline as +1.5C for the peak of the Eemian, then individual years may have approached +2C depending on ENSO and solar variance. But this again suggests to me, even if no further warming were to occur, there will be marked changes in the coming centuries. -
Occasional Thoughts on Climate Change
TheClimateChanger replied to donsutherland1's topic in Climate Change
Yeah, it was pretty solid. Here's an example of Grok's "thought" process in recreating the climate. Basically, utilizes a baseline from Mann, Marcott or other proxy reconstructions [i.e., PAGES 2k], and then would cite to limited instrumental data where available and historical accounts. Anomalies cited below were supposed to be based on a 1901-1950 baseline per my request. 1850-1879 - this was after requesting a revised account that better reflected actual year to year variance, perhaps by placing more emphasis on Smithsonian and Weather Bureau instrumental records 1830-1849 1820-1829 1810-1819 1800-1809 -
Occasional Thoughts on Climate Change
TheClimateChanger replied to donsutherland1's topic in Climate Change
So I was playing around with Grok, and with much poking and prodding, I was able to convince it to create a CONUS temperature dataset back to 1800. Had to take it piece by piece and help it out along the way. Grok's 1895-2024 period was deviating from NOAA's official values, so I informed it of the correct numbers and it converted them over to a 1901-1950 baseline that I had selected. This was Grok's estimate. Clearly the pre-1895 numbers lack the year-to-year variability of the real figures. It looks like the technique was largely to go by a baseline for those decades and then just adjust up or down based on historical records, limited instrumental records and proxy data. Grok suggests the 10 coldest years are: 1816 -2.5 1817 -1.9 1917 -1.8 1809 -1.8 1812 -1.8 1857 -1.8 1804 -1.7 1815 -1.7 1836 -1.7 1875 -1.7 The 10 warmest years are the same as NCEI, since that's where this information was sourced, but recalculated to a 1901-1950 baseline. 2024 3.6 2012 3.4 2016 3.0 2017 2.7 2021 2.6 2015 2.5 2020 2.5 2023 2.5 2006 2.4 1998 2.4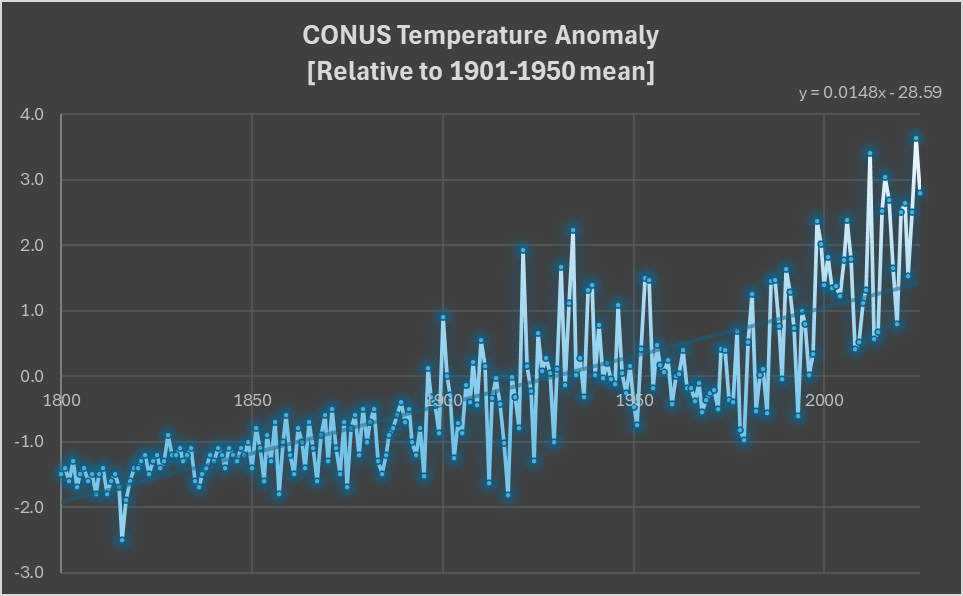
-
Pittsburgh/Western PA Winter 2024-2025 Thread
TheClimateChanger replied to Rd9108's topic in Upstate New York/Pennsylvania
-
Pittsburgh/Western PA Winter 2024-2025 Thread
TheClimateChanger replied to Rd9108's topic in Upstate New York/Pennsylvania
Severe Weather Statement National Weather Service Pittsburgh PA 833 PM EST Thu Feb 27 2025 OHC019-067-081-280200- /O.CON.KPBZ.SV.W.0002.000000T0000Z-250228T0200Z/ Carroll OH-Harrison OH-Jefferson OH- 833 PM EST Thu Feb 27 2025 ...SEVERE THUNDERSTORM WARNING REMAINS IN EFFECT UNTIL 9 PM EST FOR SOUTHEASTERN CARROLL, NORTHEASTERN HARRISON AND CENTRAL JEFFERSON OH COUNTIES... At 833 PM EST, a severe thunderstorm was located 11 miles southeast of Carrollton, moving east at 45 mph. HAZARD...Quarter size hail. SOURCE...Radar indicated. IMPACT...Damage to vehicles is expected. Locations impacted include... Steubenville, Wintersville, Hopedale, Smithfield, Scio, Jewett, Amsterdam, Richmond, New Alexandria, Bloomingdale, Unionport, Brentwood and Kilgore. PRECAUTIONARY/PREPAREDNESS ACTIONS... Seek shelter inside a well-built structure and stay away from windows. This storm is capable of producing large hail. && LAT...LON 4034 8112 4050 8106 4043 8062 4026 8068 TIME...MOT...LOC 0122Z 275DEG 39KT 4045 8115 HAIL THREAT...RADAR INDICATED MAX HAIL SIZE...1.00 IN WIND THREAT...RADAR INDICATED MAX WIND GUST...<50 MPH $$ -
Let’s talk winter!! Ohio and surrounding states!! 24'-25'
TheClimateChanger replied to buckeye's topic in Lakes/Ohio Valley
Which is what I said in my response? In any case, the original claim was about this winter. Columbus has only had 23 days with 1" or more snow cover this month, not multiple months. -
Coming years? It looks like you would need to have snow on or before November 22, 2025 in order to not match or surpass that record?
-
We were talking about historic snows and I mentioned February 1798 in Norfolk, and one of the citations I saw given for that storm was to C. F. Volney's "A View of the Soil and Climate of the United States" (1803), so I decide to read this book. And I was quite surprised because he mentions parakeets [paroquets] overwintering in the valley of the Scioto River. I'm thinking "parrots in Ohio" - this guy must have been off his rocker. It turns out there were literally parakeets in Ohio (and elsewhere in the eastern and central United States) and we killed them all. Insane. Source: Carolina parakeet - Wikipedia
-
There's no reason to believe that we would have reverted to even Pliocene conditions in the absence of manmade climate change any time in the near future. I suppose in hundreds of millions of years, the luminosity of the sun may have increased enough to create a new hothouse earth. Why do you think the climate should have reverted back to the conditions that were present millions of years ago? The Pleistocene began circa 2.8 mya and there have been periodic large-scale glaciations during that whole time.
-
I mean we have a pretty good idea of both, especially 24k years ago. That wasn't far from the last glacial maximum. Pretty sure it was considerably colder than today, and we've known that since at least the early 19th century.
-
Pittsburgh/Western PA Winter 2024-2025 Thread
TheClimateChanger replied to Rd9108's topic in Upstate New York/Pennsylvania
Well, snow is a different beast. More frequent observations can result in a huge mismatch between the "snowfall" and what has actually accumulated on the ground. Even 6-hourly observations can result in a boost of 15-20 percent versus the maximum depth from a storm. In the past, snowfall was typically measured once daily or even estimated using a 10:1 ratio from its melted liquid equivalent, or in some cases just a measurement of the change in snow depth. The current procedure didn't become common until the 1950s to as late as the 1990s at some first order sites. Source: Snowfall measurement: a flaky history | NCAR & UCAR News -
Pittsburgh/Western PA Winter 2024-2025 Thread
TheClimateChanger replied to Rd9108's topic in Upstate New York/Pennsylvania
The guidelines say that scenario is 3" of snow. The instructions here are for 24-hour observations, as that is the common practice for cooperative stations: one daily measurement, typically in the morning. This also suggests you can sum if it partially melts. I guess you'd have to also record what the depth dropped to, in order to determine the new snowfall, since the board cannot be cleared more than once in six hours. Source: Snow Measurement Guidelines -
Let’s talk winter!! Ohio and surrounding states!! 24'-25'
TheClimateChanger replied to buckeye's topic in Lakes/Ohio Valley
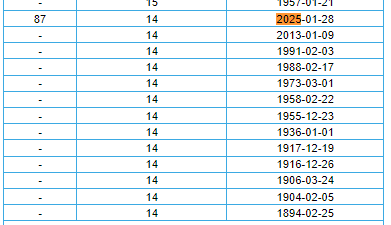
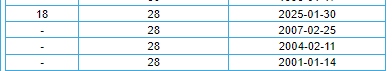
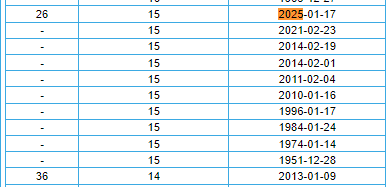
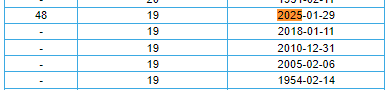
I mean it goes without saying that I am assuming he didn't actually observe 1" or more of snow cover for 60 days straight. There have been thaws. No place in the region has seen any unusually length of continuous snow cover. If he's in the woods, then, perhaps some traces of snow/ice persisted the whole time, but that's different and also probably not that unusual. 60 days of continuous snow cover would be very rare [not unprecedented, however], but three or four weeks of continuous snow cover is not at all uncommon for Ohio. Looks like for northern and north central Ohio, the historical frequency of such a stretch is from about 1 in every 3 winters. The longest streak at Cleveland this winter was 14 days. A value which has been exceeded 86 times and matched in at least 13 other years. This is a bit misleading since I believe most places in northern Ohio had longer stretches... For instance, Canton-Akron Airport had snow cover of 1" or greater for 28 days in a row ending on 1/30. But even that length has been met or exceeded in 21 other years since 1948. So even a full 4 weeks of snow cover (i.e., about a month) there occurs about once in every 3.5 years on average [and the frequency had been greater until recent years]. Columbus had 1" or more of snow cover for 15 days, ending 1/17. A streak that long has occurred 35 other times since 1948, or a little less frequently than every other year on average. Detroit's longest stretch this winter was 19 days ending on 1/29, a length which has been met or exceeded 52 times since 1948. On average, approximately 2 out of every 3 winters see this. It's actually more common than not at Detroit to see a stretch of about 3 weeks of continuous snow cover at some point in the winter.