TheClimateChanger
-
Posts
4,593 -
Joined
-
Last visited
Content Type
Profiles
Blogs
Forums
American Weather
Media Demo
Store
Gallery
Everything posted by TheClimateChanger
-
Occasional Thoughts on Climate Change
TheClimateChanger replied to donsutherland1's topic in Climate Change
-
Probably not ready to pull the trigger on record/near-record warmth. I would imagine 50s in Chicagoland would be close to a record for January 30. Edit: Yes, looks like the record is 55F.
-
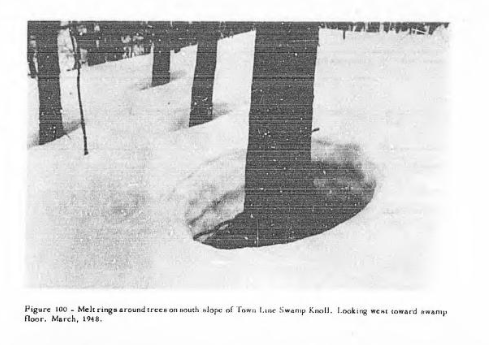
This is apparently a natural phenomenon. I was recently reading "Temperature Differences in Harvard Forest and their Significance" by Dr. Herbert A. Rasche, for the U.S. Army Environmental Protection Research Division (1958). Figure 100 in the report shows what are termed "melt rings" around the trees in Town Line Swamp Knoll in March 1948. Apparently, the dark trees must warm up and melt the snow around them.
-
That's crazy. And it's not even "fake" effect snow that's like mostly air and loses like half of its depth in 24 hours.
-
I'm inclined to agree with you on this point. I get told on certain subforums here that top 5/top 10 hottest months, seasons, years aren't that big of a deal. Forgive me for not finding a month where historically more than 1 in every 3 years were colder. And the historical rate was probably more like 1 in 2 before the recent warm period.
-
Wow, that's insane. How much snow is that? Looks like a winter of yore, but it's only 14 years ago.
-
New England Winter 2024-25 Bantering, Whining, and Sobbing Thread
TheClimateChanger replied to klw's topic in New England
Honestly, that might be the reason for the flag, not any equipment problem. It looks like the high and low were simply transposed on the 28th, but you can tell the observer was not properly resetting the instruments at a fixed time each day. Which unfortunately may have divested a legitimate state record, considering the Vermont state record was set on the same date. -
New England Winter 2024-25 Bantering, Whining, and Sobbing Thread
TheClimateChanger replied to klw's topic in New England
Probably not far off. Berlin was -41F and Pittsburg, New Hampshire was -44F on the same date. The mean temperature for the month at Pittsburg was 10.0F, just 0.7F warmer than the Dixville Notch observation. Bloomfield, Vermont reached -50F on the same date, which is the all-time record low for the State of Vermont. -
Fall/Winter '24 Banter and Complaints Go Here
TheClimateChanger replied to IWXwx's topic in Lakes/Ohio Valley
Caribou had 109 inches in the winter of 1966-67, where are you getting 36? Caribou has never had such little snow. -
Too bad January hath not 30 days.
-
Occasional Thoughts on Climate Change
TheClimateChanger replied to donsutherland1's topic in Climate Change
Can anyone explain this? I don't dispute the finding... that is, that climate-driven warming threatens agricultural productivity in Central Europe. My question is with these depictions of historical agroclimatic zones. If you just looked at this reconstruction, you would think the period 1501-1525 had similar regional temperatures to 2001-2018, and 1926-1950 was similar to 1601-1625, one of the coldest times of the Little Ice Age, and, bizarrely, even colder in the western parts of the region of interest. My problem is this... these reconstructions make zero sense based on hundreds of years of climatology. I realize there are regional variations, but I think it's implausible that this part of the world would have experienced similar agroclimatic zones to the recent past during a time when global temperatures were more than 1C cooler than the present. If we look at recent years, which have been as much as 1.5C of warming from the late 19th century, these periods were probably 2C or more cooler based on most reliable reconstructions. 1926-1950 was also a period of relative warmth globally on a millennial or multi-millennial timeframe, with some stability or even modest cooling in the ensuing decades, only for another large step-up in temperature to occur in the latter parts of the 20th century. More caution should be had when combining proxy data and instrumental records. I feel like if 1926-1950 and 2001-2018 were calculated in the same manner as the earlier periods, there should be a lot more oranges and reds in the earlier period, and the most recent should be blood red. Something is off here. Like I said, I don't dispute the finding AT ALL. However, to me, the graphic is casting a misleading view and literally flies in the face of hundreds of years of scientific understanding of the earth's climates - an understanding and knowledge that even predates the discovery of the greenhouse effect. -
One thing to note. Even in the places with large departures, most locations are not having Top 10 coldest Januarys. And these values will continue to moderate in the coming days. West Virginia is an exception with most sites currently having Top 10 cold Januarys, but a lot of those stations have significant site/elevation changes - from valley cities to elevated airports, shorter PORs and gaps in the records. That's also been the location with the largest departures relative to normal, as shown on the map. Although it does suggest that something else is going on with the position of the anomalies, other than moderation from the Great Lakes. If that was the cause, you would expect relatively warmer anomalies over western Pennsylvania and West Virginia, with the predominant northwest flow off the Lakes. Why would the warming be more significant on the Coastal Plain? It looks more like the relative position of the jet stream, blocking ridges and troughs, have a more significant impact. The relative lack of snow cover along the Coastal Plain relative to inland locations also playing a significant role. Central Park has a mean monthly snow depth of 0.3 inches, while Charleston, West Virginia has had a mean monthly snow depth of 3.4 inches, and has had at least an inch on the ground since the 5th with most days having several inches.
-
That’s the current steam flow map. I didn’t realize how dry it’s been in the Pacific Northwest, as well. Lots of streams at record low flow for today’s date. Isn’t it usually wet up there during La Niñas?
-
-
Let's take a look at some of the precipitation totals in the areas of drought improvement. Wheeling, West Virginia Fort Wayne, Indiana Toledo, Ohio Zanesville, Ohio Peoria, Illinois Williamsport, Pennsylvania Albany, New York
-
Someone should do a little fact checking on these "drought monitors." If we look at the outlook released on December 31, 2024, we see they were calling for marked improvement to the drought situation across the Great Lakes, Ohio Valley and New England, based on an expected active La Nina pattern with copious rainfall. This didn't actually happen. In fact, most locations are on track for one of the driest Januarys on record. Yet, the drought miraculously improved! "The party told you to reject the evidence of your eyes and ears. It was their final, most essential command."
-
Pittsburgh/Western PA Winter 2024-2025 Thread
TheClimateChanger replied to Rd9108's topic in Upstate New York/Pennsylvania
These are for Pittsburgh, to be clear. -
Pittsburgh/Western PA Winter 2024-2025 Thread
TheClimateChanger replied to Rd9108's topic in Upstate New York/Pennsylvania
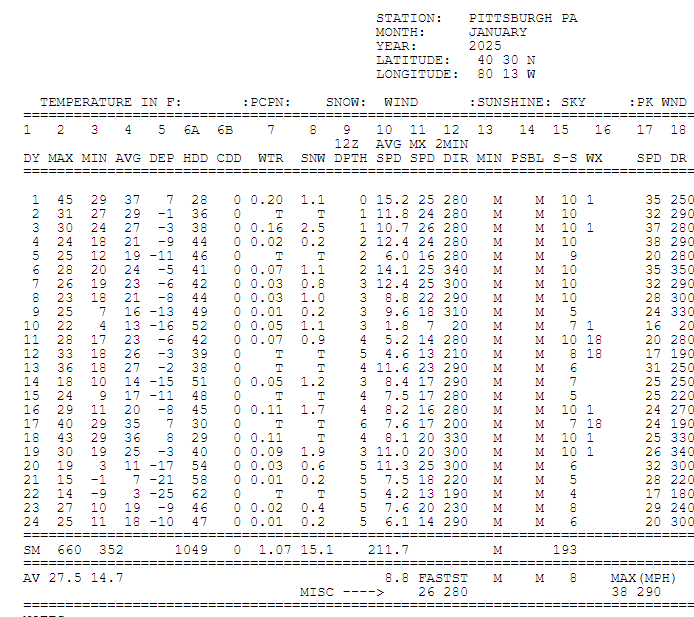
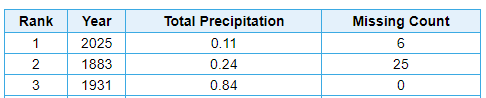
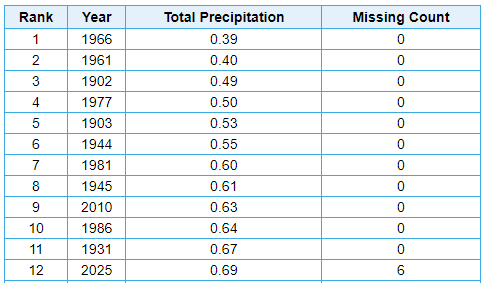
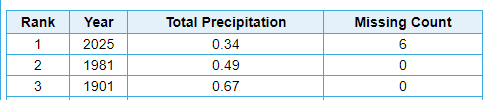
If the month ended today, it would be 4th driest & 10th coldest on record. Precipitation looks minimal this week, so likely to finish among the Top 10 driest Januarys. Temperatures looks somewhat milder, so we will probably fall in the rankings for coldest Januarys. -
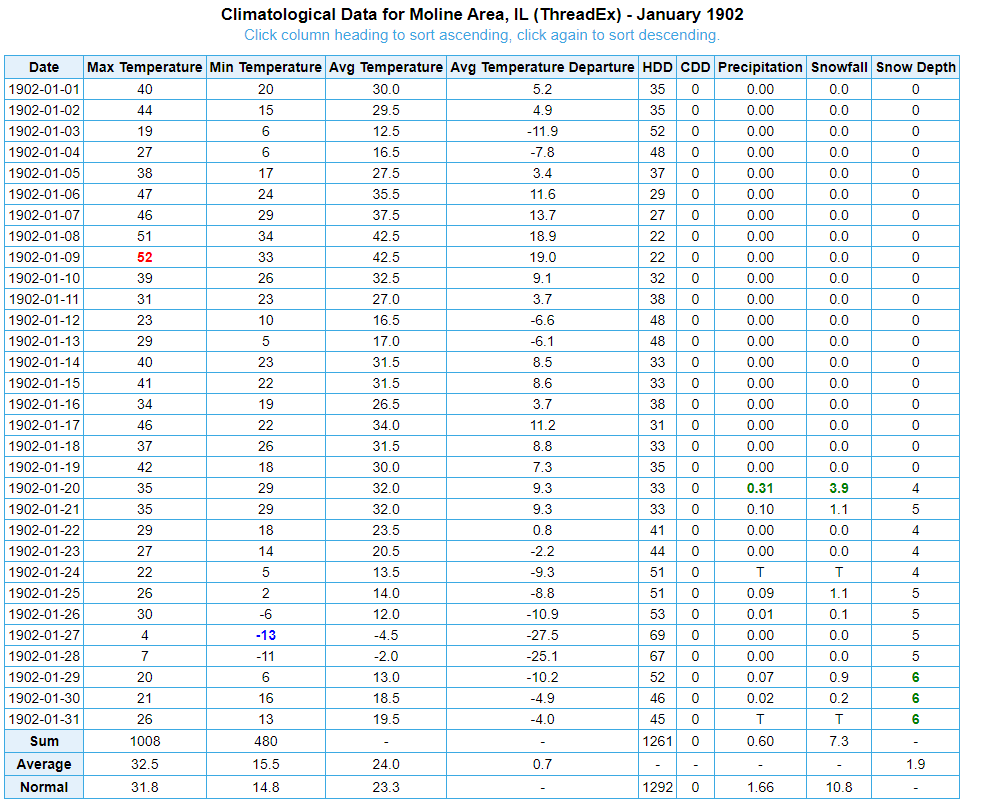
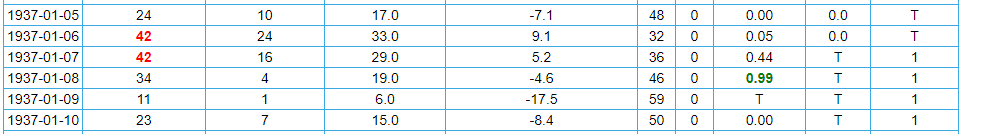
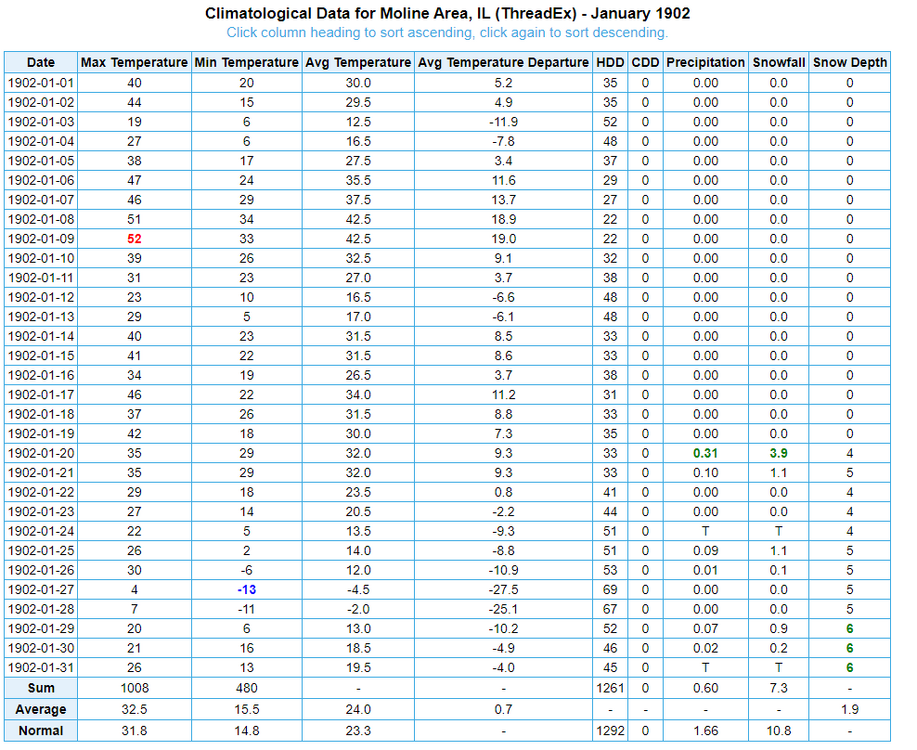
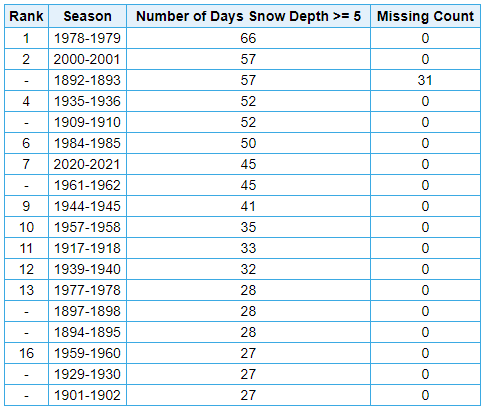
Looking at 1901-1902, we see some of these same irregularities. What I suspect is happening is they are measuring the change in depth, but used to report depth to the nearest tenth of an inch. So a 0.2" snowfall might represent a change in depth of 0.4" to 0.6" and appear as a jump of a Trace depth to 1" today. Of course, the 1936-37 are anomalous even then. Because it's not physically possible for the depth to increase with no snow at all! It actually turns out, however, that 1901-1902 was not a bad winter at all in Moline. January was bitter cold with a solid snowpack in place for the final 12 days of the month. The meteorological winter (DJF) mean temperature of 21.4F ranks as 32nd coldest (out of 151 years). Incredibly - and highlighting the absurdity of these numbers - the number of days during meteorological winter (DJF) with at least 5" of snow on the ground is tied for 16th most on record. Special recognition of 1892-1893 for ranking second on this list, despite missing the entire month of December. Anyways, 27 days of 5"+ snowfall (including 21 with at least 6") in a winter where 11" fell.
-
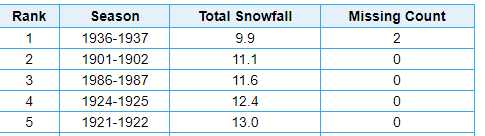
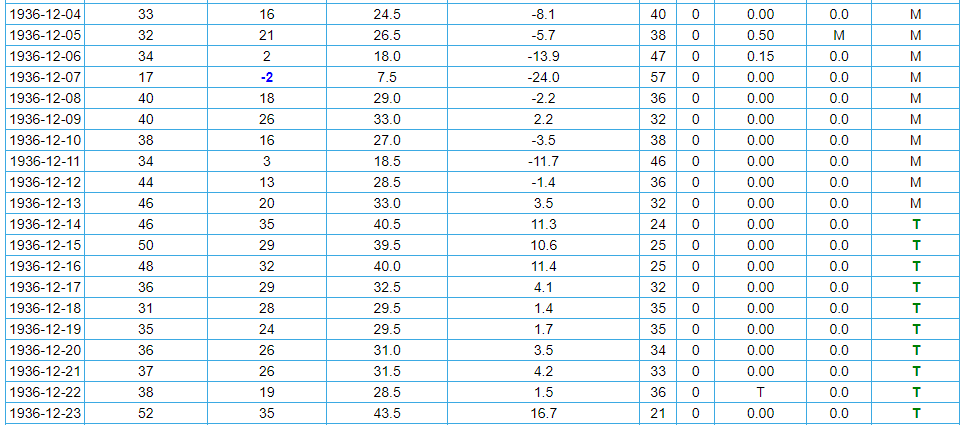
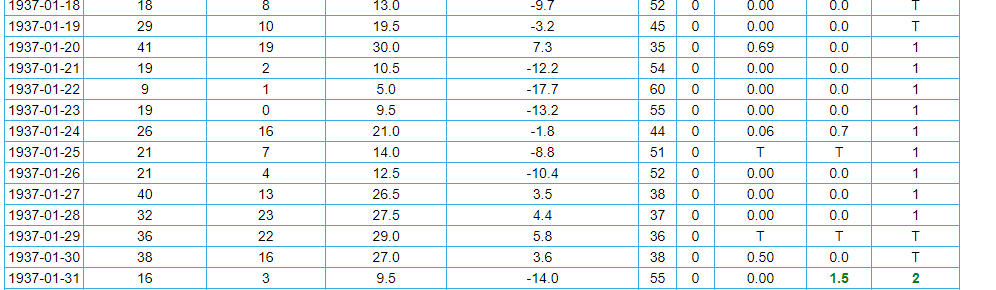
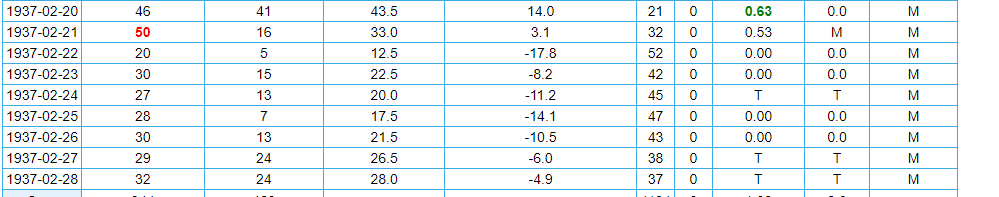
Indeed, if we look at the seasonal snowfall "futility" records at Moline, we find the following: As noted, 1936-37 is missing data. In fact, we can see a rather significant snowfall appears to have struck the Moline area in early December 1936, but is not reflected in the digitized records. Given the amount of precipitation noted, it is very likely this one event would bump 1936-37 out of the low spot. But the records in January have at least a couple dates where snow depth increases with no measurable snow recorded by the observer! Another date with possible rain to snow is also missing from February... So, yes, 1936-37 likely saw unusually sparse snowfall at Moline, but 9.9" - NO WAY, JOSE!
-
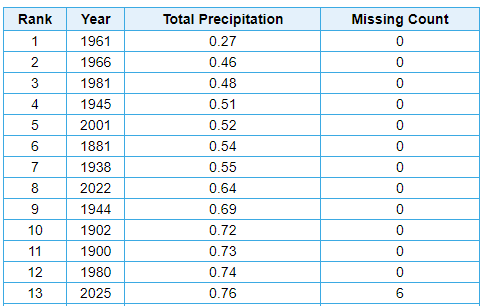
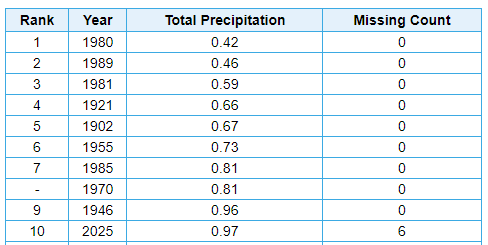
For those interested in futility records, caution is certainly warranted with older records. If we take Moline, Illinois, for example, we see snowfall through today's date appears to be 10th lowest. But note, there's one day missing for 1936-1937 (more on that later). The one day missing for 2024-2025 is today which isn't yet complete (but no snowfall is expected). If it can make it through the end of the month, that would bump up to 5th place. However, there are data irregularities and missing data affecting some of the older years.
-
This is why, in my opinion, a composite index factoring in winter temperatures, snowfall, average snow depths, and days of snow cover - similar to that proposed by user @beavis1729- is superior to an emphasis solely on reported snowfall, especially when factoring in site location changes and changes in measurement procedures.
-
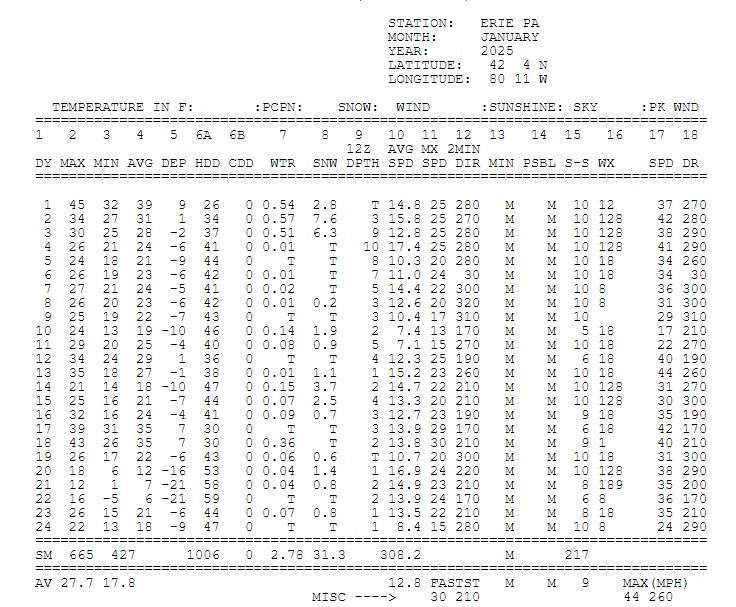
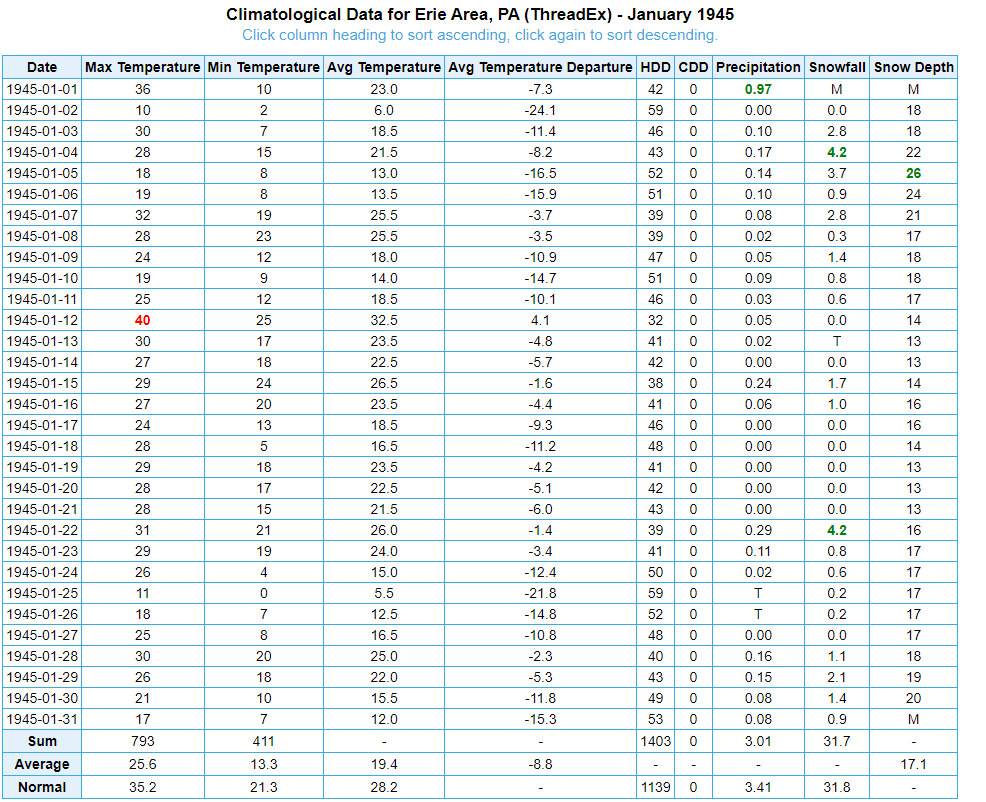
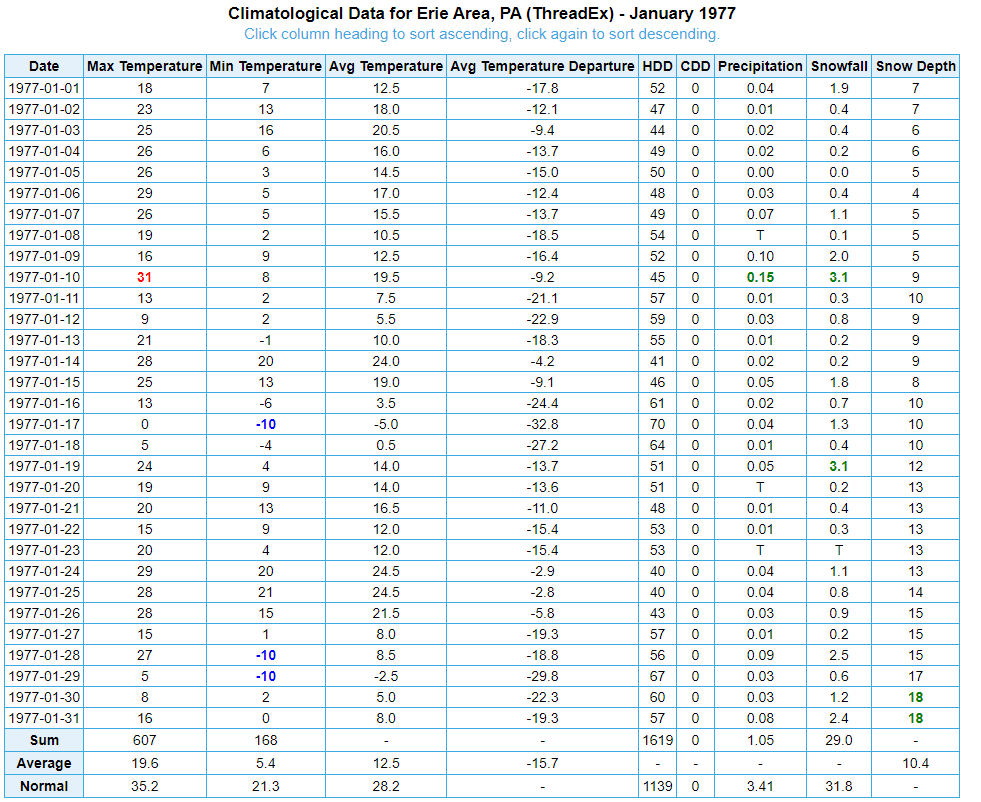
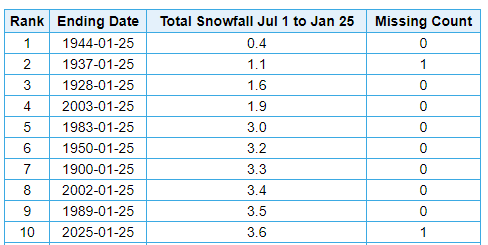
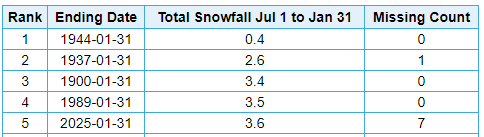
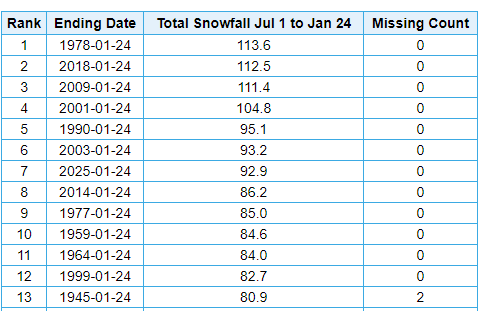
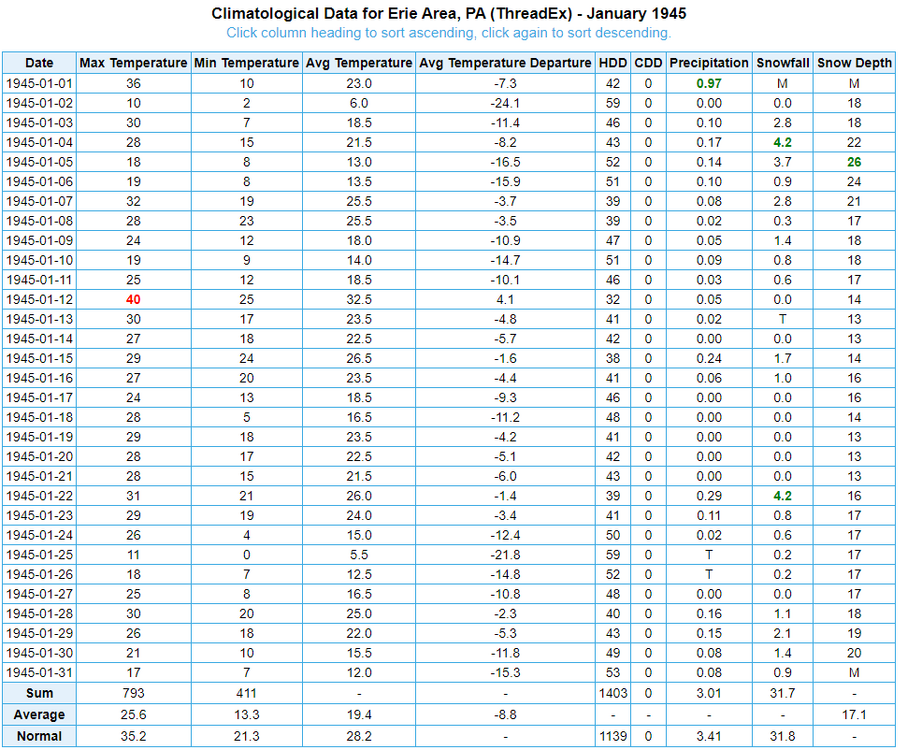
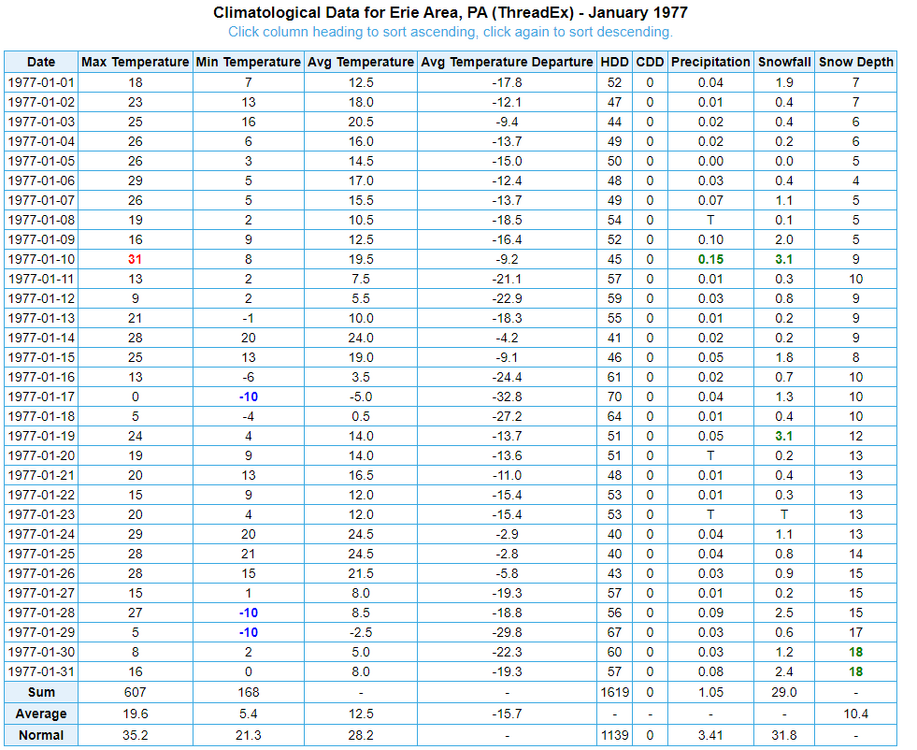
We can also see how snowfall is not the best measure of the harshness of a winter, especially with the inflated measurements of the present. Again, if we look at Erie, we see the seasonal snowfall to date ranks as 7th most. By comparison, 1977 had 85.0 inches to date, and 1945 had 80.9 inches (but with 2 dates missing - more on that later). But if we compare this month to January 1945 & January 1977, we can see those months were miles harsher than the present one. In January 1945, xMacis registers a total of 31.7 inches; however, it appears to have deleted a large snowstorm from January 1st. Nearly 1" of liquid equivalent fell on the 1st, with a high of 36 and low of 10. Snow depth was 18" on the 2nd. Snow depths that month ranged from 13 to 26 inches, with an average depth of 17.1 inches. In January 1977, 29.1 inches of snow fell, with depths ranging from 4 to 18 inches all month long, and an average depth of 10.4 inches.
-
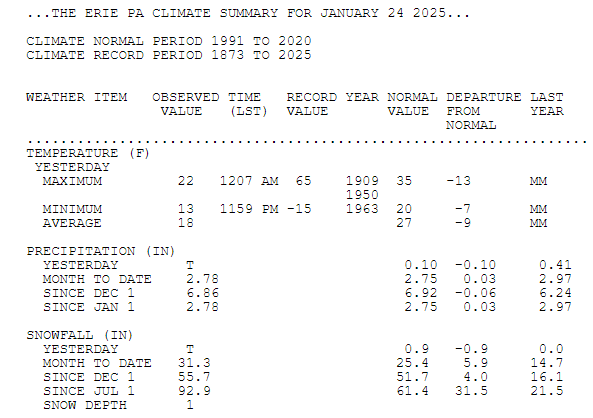
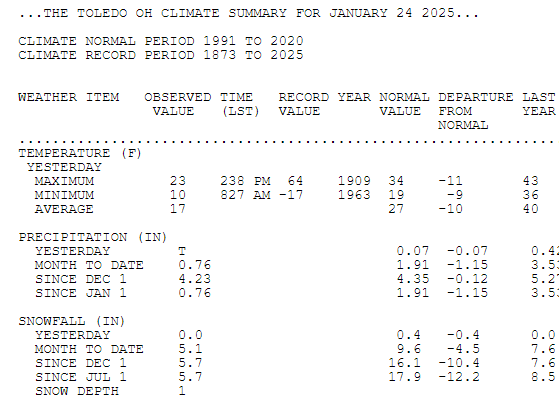
We can see a similar effect if we compare Toledo and Erie. At Erie, nearly 93 inches of snow has fallen this season, with a current depth of 1". At Toledo, 5.7" of seasonal snowfall has yielded an identical depth of 1 inch.
-
This has been a good month to see the impact of "fake" effect snow on snow depth. If we look at Erie, we see 31.3 inches of snow fell this month, with depth down to 1" despite temperatures largely staying below freezing for the month. Of note, 10" of snow cover on the 4th evaporated/sublimated down to 2" by the 10th despite temperatures remaining well below the freezing point over that entire stretch. Meanwhile, at Pittsburgh, snowfall has been less than half of that at Erie, but yesterday's snow depth was 5x larger, despite a similar temperature profile and lying more than 1.5 degrees south of Erie. Over the 4th through the 10th, while Erie's snow depth dropped 8", snow depth at Pittsburgh increased by 1 inch.