TheClimateChanger
-
Posts
4,598 -
Joined
-
Last visited
Content Type
Profiles
Blogs
Forums
American Weather
Media Demo
Store
Gallery
Everything posted by TheClimateChanger
-
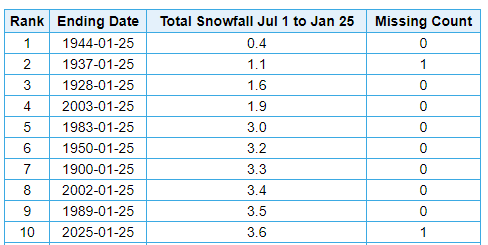
For those interested in futility records, caution is certainly warranted with older records. If we take Moline, Illinois, for example, we see snowfall through today's date appears to be 10th lowest. But note, there's one day missing for 1936-1937 (more on that later). The one day missing for 2024-2025 is today which isn't yet complete (but no snowfall is expected). If it can make it through the end of the month, that would bump up to 5th place. However, there are data irregularities and missing data affecting some of the older years.
-
This is why, in my opinion, a composite index factoring in winter temperatures, snowfall, average snow depths, and days of snow cover - similar to that proposed by user @beavis1729- is superior to an emphasis solely on reported snowfall, especially when factoring in site location changes and changes in measurement procedures.
-
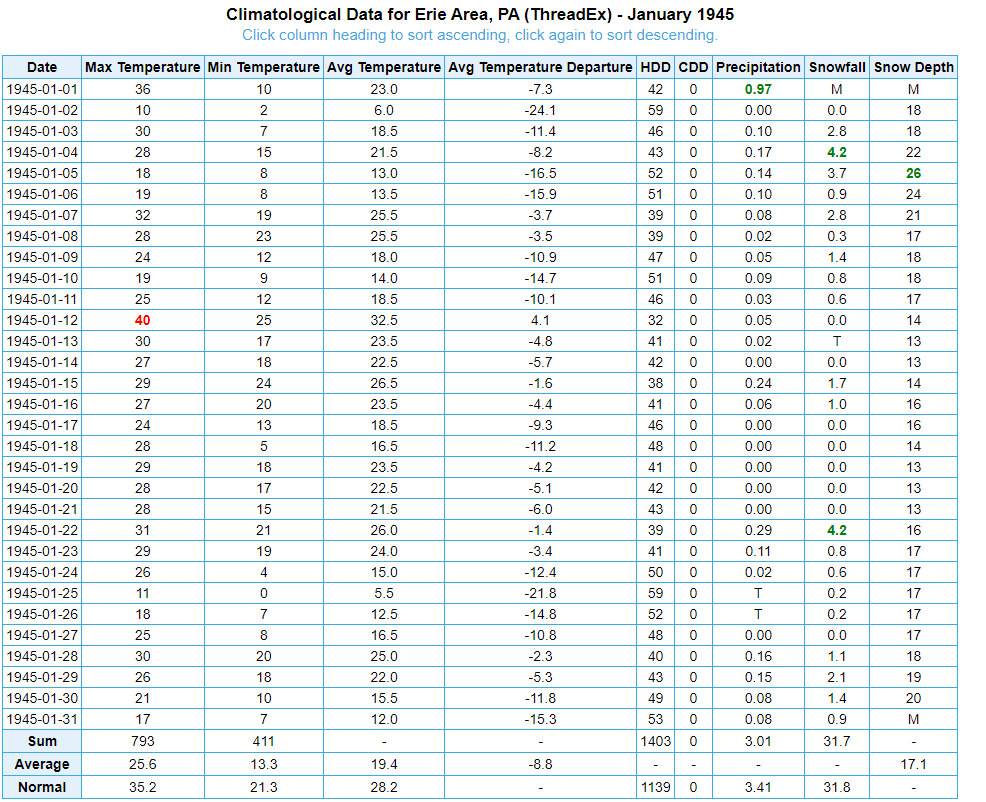
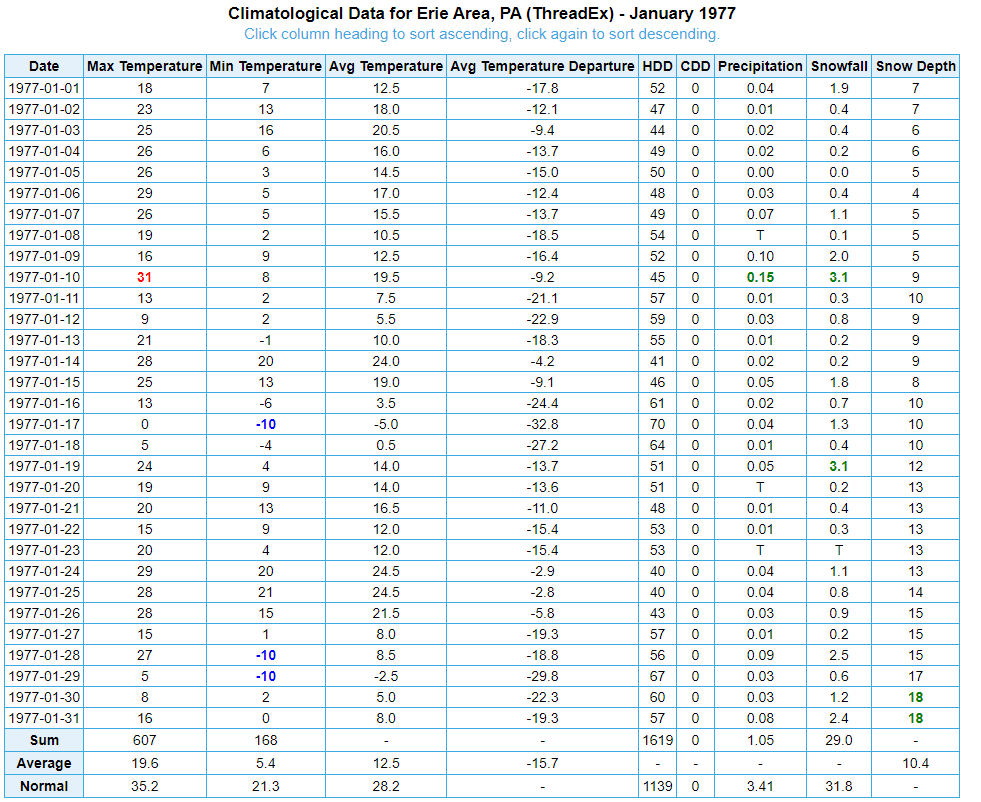
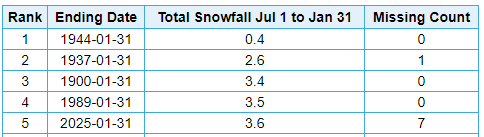
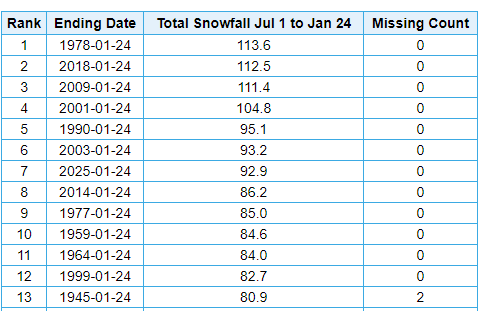
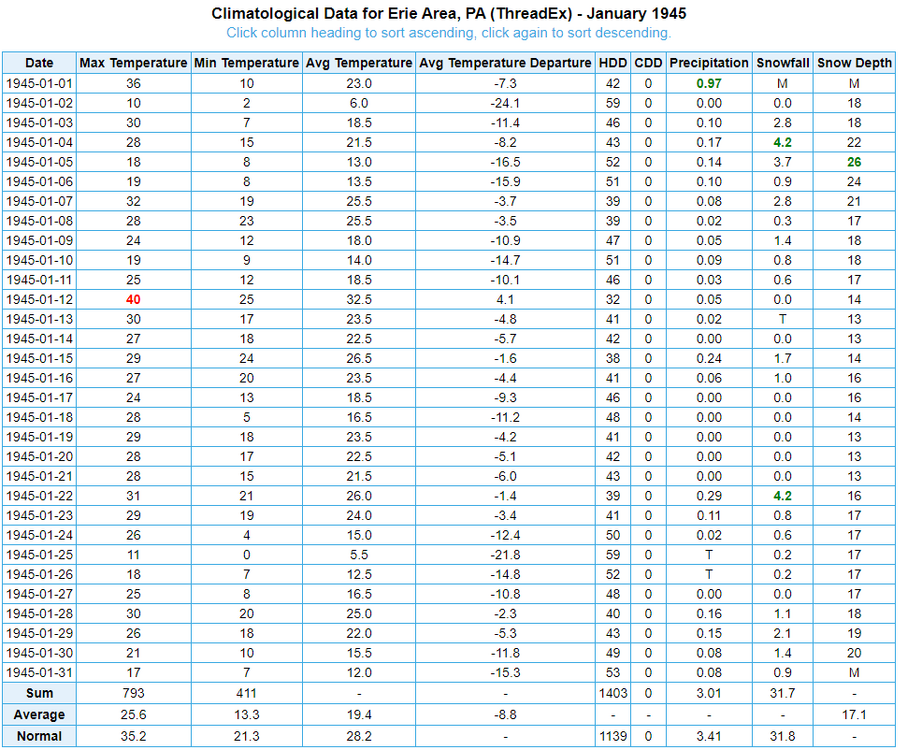
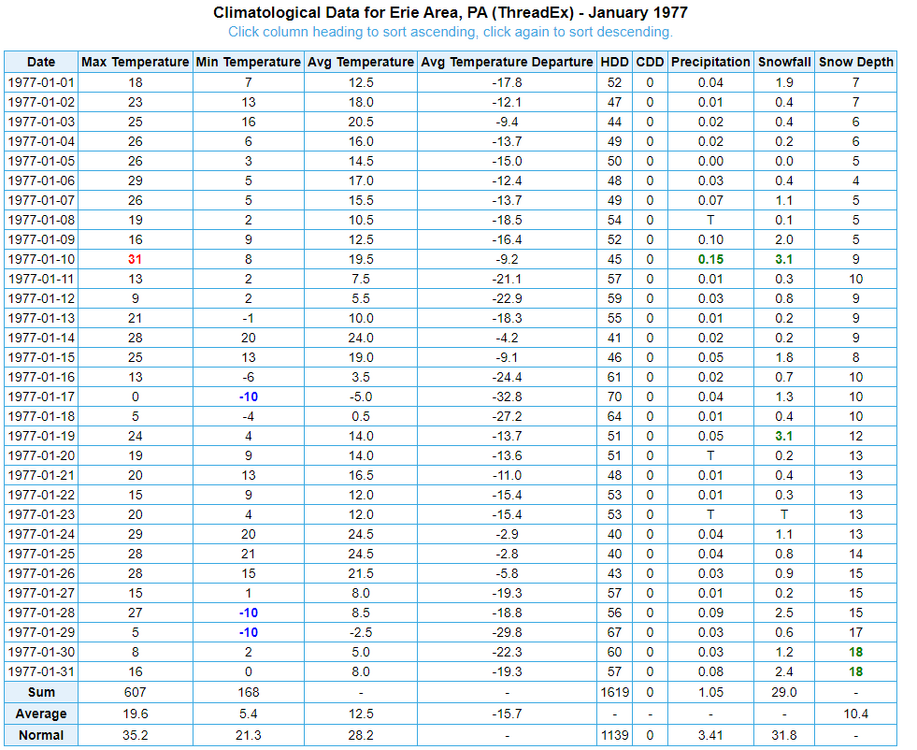
We can also see how snowfall is not the best measure of the harshness of a winter, especially with the inflated measurements of the present. Again, if we look at Erie, we see the seasonal snowfall to date ranks as 7th most. By comparison, 1977 had 85.0 inches to date, and 1945 had 80.9 inches (but with 2 dates missing - more on that later). But if we compare this month to January 1945 & January 1977, we can see those months were miles harsher than the present one. In January 1945, xMacis registers a total of 31.7 inches; however, it appears to have deleted a large snowstorm from January 1st. Nearly 1" of liquid equivalent fell on the 1st, with a high of 36 and low of 10. Snow depth was 18" on the 2nd. Snow depths that month ranged from 13 to 26 inches, with an average depth of 17.1 inches. In January 1977, 29.1 inches of snow fell, with depths ranging from 4 to 18 inches all month long, and an average depth of 10.4 inches.
-
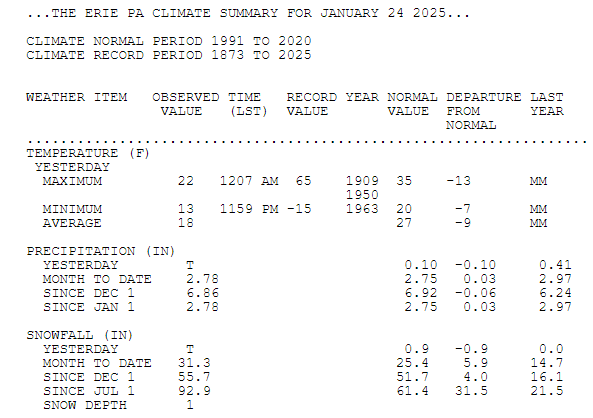
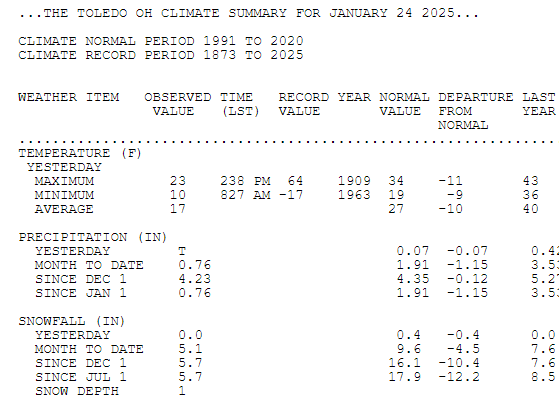
We can see a similar effect if we compare Toledo and Erie. At Erie, nearly 93 inches of snow has fallen this season, with a current depth of 1". At Toledo, 5.7" of seasonal snowfall has yielded an identical depth of 1 inch.
-
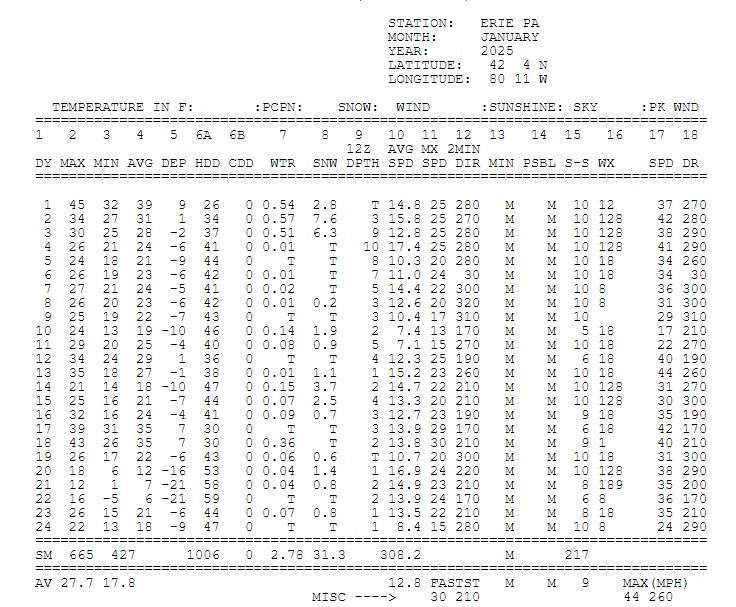
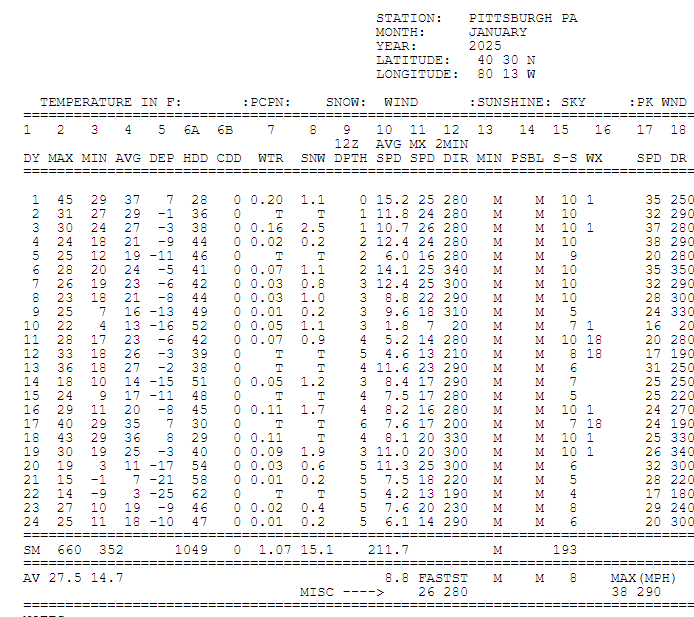
This has been a good month to see the impact of "fake" effect snow on snow depth. If we look at Erie, we see 31.3 inches of snow fell this month, with depth down to 1" despite temperatures largely staying below freezing for the month. Of note, 10" of snow cover on the 4th evaporated/sublimated down to 2" by the 10th despite temperatures remaining well below the freezing point over that entire stretch. Meanwhile, at Pittsburgh, snowfall has been less than half of that at Erie, but yesterday's snow depth was 5x larger, despite a similar temperature profile and lying more than 1.5 degrees south of Erie. Over the 4th through the 10th, while Erie's snow depth dropped 8", snow depth at Pittsburgh increased by 1 inch.
-
Winter 2024-25 Medium/Long Range Discussion
TheClimateChanger replied to michsnowfreak's topic in Lakes/Ohio Valley
This is an interesting .gif of the MRCC average annual snowfall maps for 1961-1990 and 1981-2010, which was shared at UMich's Great Lakes Integrated Sciences and Assessments program, a NOAA Climate Adaptations Program. You can see snowfall decrease pretty much universally across the south half of the Midwest in the two time frames, while generally holding steady or slightly increasing in the north. Snowfall increased markedly across many of the traditional snow belt regions. The most recent annual snowfall map from MRCC shows these snowfall bands continuing to push northward. With the area of less than 6" sprawling out from the Missouri Bootheel to encompass much of southern Missouri and southern Kentucky. Will be interesting to watch this progression continue over the coming decades. I suspect the next update will show a marked acceleration of the trends. -
Pittsburgh/Western PA Winter 2024-2025 Thread
TheClimateChanger replied to Rd9108's topic in Upstate New York/Pennsylvania
Yes, they did register a trace on Wednesday, although it's not clear when that fell from the hourly observations. Must have been brief. Wasn't sure if it would snow today, but there are flurries flying here. Nothing at PIT. But it's of no consequence since the snow showers yesterday extended past midnight, so the streak has already continued through today. -
Occasional Thoughts on Climate Change
TheClimateChanger replied to donsutherland1's topic in Climate Change
I think you mean 1783-1784, which is when Laki was erupting. I was thinking of this as well recently, with the snow in southern Louisiana. The area around Broussard, Louisiana was originally called Cote Gelee (Frozen Hill) due to the snow covered sandhills and icy bayous found by the early Acadian settlers in 1784. Ice floes were reported into the Gulf of America, formerly known as the Gulf of Mexico, from the Mississippi River. The impact of Laki on these cold temperatures is not unquestioned, however. Recent research suggests natural variation played an important role. ENSO and NAO reconstructions show a pattern similar to that which occurred in 2009-2010, so I don't think we can necessarily discount the possibility that this was natural variation superimposed on a much colder base state than the present. The anomalous winter of 1783–1784: Was the Laki eruption or an analog of the 2009–2010 winter to blame? - D'Arrigo - 2011 - Geophysical Research Letters - Wiley Online Library -
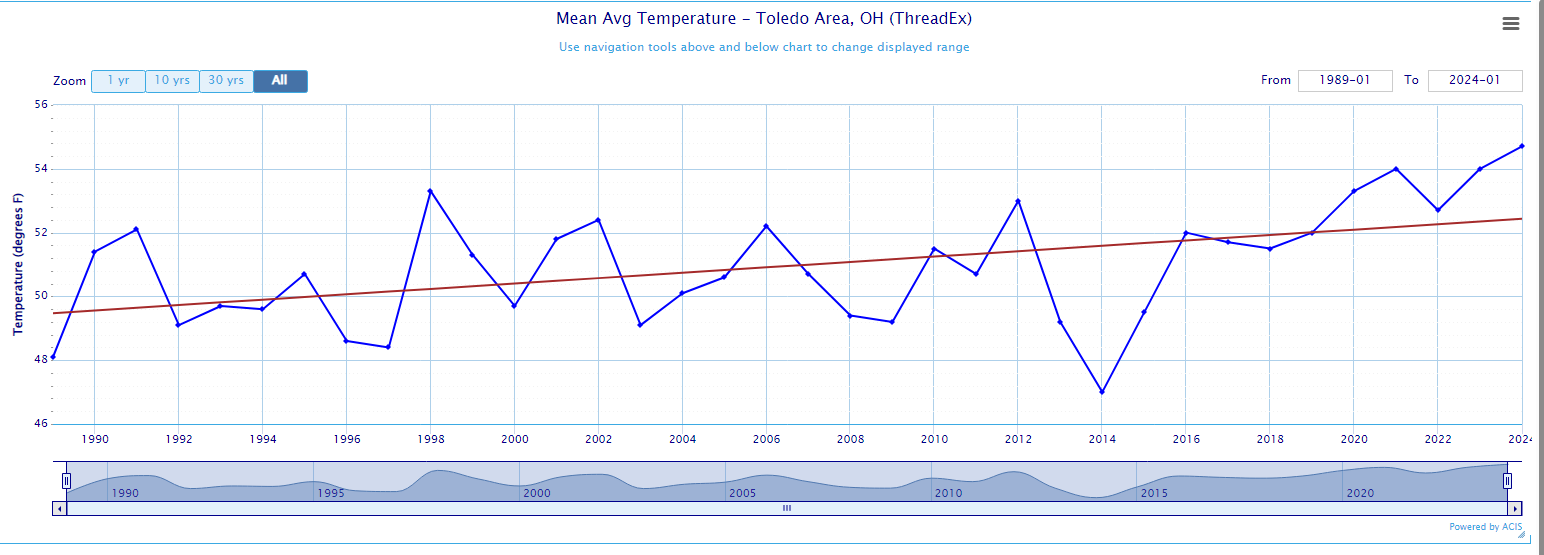
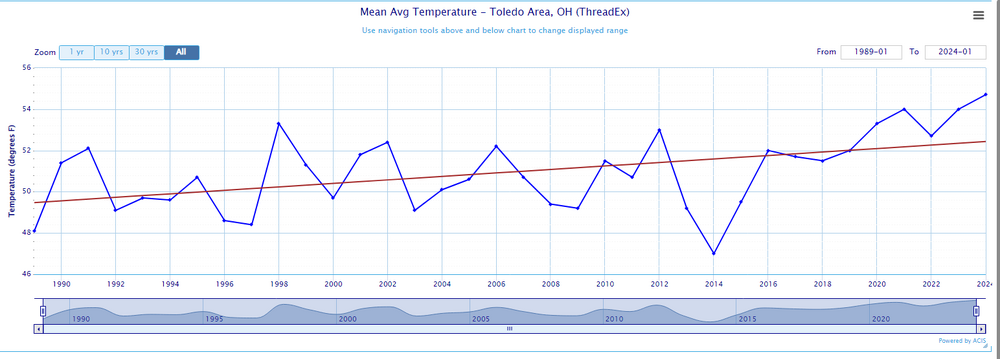
@donsutherland1 Here's another example of a denier seizing on the recent cold snap to promote their anti-warming agenda. First of all, the article mentions the Great Lakes, not the Upper Midwest. While there's a considerable overlap, much of the Great Lakes region is not in the Upper Midwest, and vice versa. Second, nowhere in the article do the predict the "Upper Midwest would become very warm by the year 2030, and millions of people would move there for the climate." There's a thought-provoking possible future headline, but it simply mentions the 21st century - which could be 2050, or 2080, or 2090. The only projection has a lot of caveats - "may cause a 4 to 9 F temperature increase in the region as early as 2030." Not really a hard and fast projection, given the "may" and "as early as" language, suggesting the rise may occur over a longer timespan that that. But the crazy thing is the lower end of that projection does not look far off. Here is the temperature trend at Toledo Airport, in Ohio, from 1989 to 2024. Now, the airport, a relatively small, regional one, is located in a mostly rural section of Lucas County, and therefore should have minimal impact from urban heating. A linear regression shows a warming of 2.9F from 1989 to 2024. A continuance of this trend over the next several years would likely bring total warming to around 3.5F by 2030. And this is fairly representative of much of the Great Lakes region. But a few comments are warranted: (1) Most recent years have been above the trendline. Should this continue, the slope of the regression line will increase. If we simply compare the first 5 years of data, we find a mean temperature of 50.1F, versus the most recent 5 years, a mean temperature of 53.7F, corresponding to a warming of 3.6F over those two periods. (2) This does not account for changes in instrument and siting. The HO-83 thermometer, which was in use from the mid 1980s to the mid 1990s, is known to have produced spuriously high readings. When the NWS switched to ASOS, with the updated sensors, a cooling of as much as 1F or more was noted. This suggests that the temperatures at the beginning of this dataset may be too high, which would have the effect of decreasing the slope of the trendline [and implied warming] for non-climatic reasons. (3) The graph starts at what was understood at the time to be a very warm period - no cherrypicking at all. The late 1980s and early 1990s were known as a very warm period with mild winters and hot summer temperatures. The Pinatubo eruption, however, did provide some temporary cooling in the 1992-1994 time period, perhaps ameliorating this factor. Regardless, the point is starting just 10 years earlier would probably produce a substantially higher warming trend. Overall, the forecast was not bad. It would appear that 4F warming from late 1980s base would likely be achieved by 2040. The higher rates of warming were probably based on projections of greenhouse gas emissions that did not come to fruition.
-
-
Pittsburgh/Western PA Winter 2024-2025 Thread
TheClimateChanger replied to Rd9108's topic in Upstate New York/Pennsylvania
Looks like the coldest of any ASOS/AWOS site was Zelienople (KPJC). A very efficient site for radiational cooling. Unlike most larger airports and airfields, this one is located in a small valley. Coldest temperature was -16.6F, or rounded to -17F, which was observed for several hours. The AWOS does not report minimum temperature, so it may have been even lower in between 15 minute observations. Link: National Weather Service Washington County Airport (KAFJ) reached -16F. Another spot for good radiational cooling. Link: National Weather Service -
Central PA Winter 2024/2025
TheClimateChanger replied to Voyager's topic in Upstate New York/Pennsylvania
I suspect the snowcover actually amplifies the diurnal range by having a larger cooling impact on low temperatures than on high temperatures, under ideal radiational cooling conditions. Also, some of those days likely saw non-diurnal temperature spreads due to reinforcing shots of arctic air, plus moderation into the overnight ahead of the reinforcing shots of arctic air. -
Fall/Winter '24 Banter and Complaints Go Here
TheClimateChanger replied to IWXwx's topic in Lakes/Ohio Valley
Would have been a good opportunity for some entrepreneurial northern snowplow operators, as well. I would reckon there aren't too many of those down there. -
Let’s talk winter!! Ohio and surrounding states!! 24'-25'
TheClimateChanger replied to buckeye's topic in Lakes/Ohio Valley
There's plenty out there. Just go out there and make some Snow Buckeyes! Florida's snow will be melted in 2 days. Ohio has fared much better than most places. -
Central PA Winter 2024/2025
TheClimateChanger replied to Voyager's topic in Upstate New York/Pennsylvania
Good post. If your fears do come to fruition, I think part of the blame belongs to the government. The Drought Monitor continues to show marked improvement statewide over the past 10 weeks, which would suggest wetter than average conditions has helped to alleviate, or reduce, the existing drought. But, in fact, most places have seen below normal precipitation over the past 10 weeks - in some cases, much below. -
Pittsburgh/Western PA Winter 2024-2025 Thread
TheClimateChanger replied to Rd9108's topic in Upstate New York/Pennsylvania
Heavy snow now. -
Pittsburgh/Western PA Winter 2024-2025 Thread
TheClimateChanger replied to Rd9108's topic in Upstate New York/Pennsylvania
Snowing here at a decent clip right now. -
Central PA Winter 2024/2025
TheClimateChanger replied to Voyager's topic in Upstate New York/Pennsylvania
Yes, I see that. Judging from the hole around the LWX radar, I suspect it's all (or mostly all) aloft. You can even some of the heavier returns southwest of the radar site, especially in the early part of this loop, suggesting the heavier virga likely extends over the radar site but the beam is too low in those areas to detect it. With that said, the hole does look to be shrinking, which would suggest some of the snowflakes are making it further down into the atmosphere. But this is only like 10, maybe 15, dbz returns. -
Central PA Winter 2024/2025
TheClimateChanger replied to Voyager's topic in Upstate New York/Pennsylvania
Doubtful, given the extremely low dewpoints and minimal intensity of what is falling to begin with [looks like little more than flurries even at the height of the radar beam]. -
Central PA Winter 2024/2025
TheClimateChanger replied to Voyager's topic in Upstate New York/Pennsylvania
That's what I figured. The proximity to the hot river waters probably elevate minimum temperatures locally compared to other locations in the warmer parts of the year. -
Central PA Winter 2024/2025
TheClimateChanger replied to Voyager's topic in Upstate New York/Pennsylvania
Interesting. What happened to the urban heat island that people always complain about at MDT? -
Pittsburgh/Western PA Winter 2024-2025 Thread
TheClimateChanger replied to Rd9108's topic in Upstate New York/Pennsylvania
Very impressive snowfall rates, with rapid accumulation. Watch out for that coating. -
Pittsburgh/Western PA Winter 2024-2025 Thread
TheClimateChanger replied to Rd9108's topic in Upstate New York/Pennsylvania
Snowing quite heavily here. Looks to be about an inch or so of new accumulation. Wasn’t expecting much this far northwest. -
Pittsburgh/Western PA Winter 2024-2025 Thread
TheClimateChanger replied to Rd9108's topic in Upstate New York/Pennsylvania
Not much of anything here. Minor coating earlier, snowing lightly again now with a new light coating. -
This solar maximum effect is looking to be little more than hocus-pocus at this point, no? This has been the coldest winter in years and, given the forecast, looks like it has a decent chance of being the coldest winter since, well, the last solar maximum. The last cycle peaked in 2014 and was bookended by some of the coldest winters in decades (2013-2014, 2014-2015). Maybe there's a small global warming attributable to solar maxima, but the link between solar maxima and warm/mild mid-latitude winters seems to be tenuous at best.