

TheClimateChanger
-
Posts
4,574 -
Joined
-
Last visited
Content Type
Profiles
Blogs
Forums
American Weather
Media Demo
Store
Gallery
Everything posted by TheClimateChanger
-
Pittsburgh/Western PA Summer 2023
TheClimateChanger replied to Ahoff's topic in Upstate New York/Pennsylvania
-
Central PA Summer 2023
TheClimateChanger replied to canderson's topic in Upstate New York/Pennsylvania
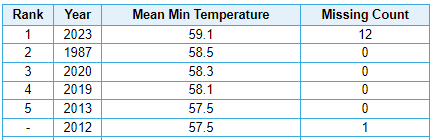
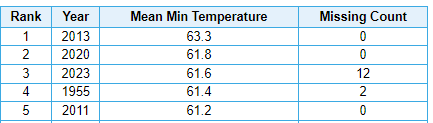
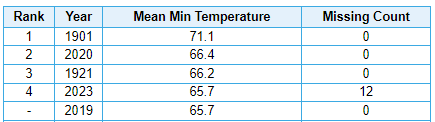
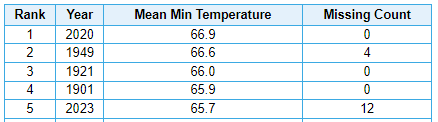
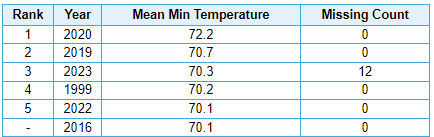
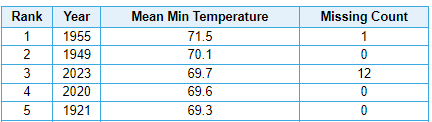
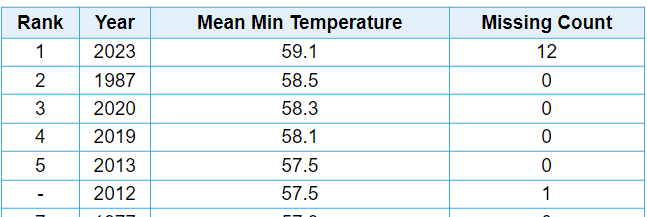
Runaway "urban heat island effect" leading to record or near record high minimum temperatures this month, even in some of the most remote places in the Commonwealth, such as Jefferson and McKean Counties. Just not sure how we are going to be able to stop all of this urban waste heat from polluting our forests, streams and oceans. DuBois Bradford Mount Pocono Williamsport Comment: I have my doubt about the validity of the 71.1 from 1901. LOL. Scranton/Wilkes-Barre Harrisburg Reading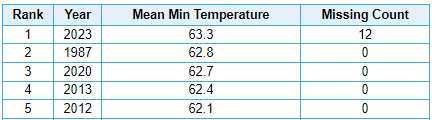
-
It's crazy to see how this urban heat island effect keeps growing and even affecting places hundreds of miles from any city, such as McKean County, Pennsylvania.
-
Pittsburgh/Western PA Summer 2023
TheClimateChanger replied to Ahoff's topic in Upstate New York/Pennsylvania
Made at a surprise run at the 50s this morning, but fell just short with a low of 60. -
If the 1936 heat wave occurred this year, Bastardi would be downplaying it by saying its not that hot on a per capita basis. Looking at the actual data, July 1936, as a whole, was actually around or slightly below current July normals in most places where people actually lived. And outside of a one week intense heat wave, downright chilly (especially at night) compared to recent Julys. Funny how it was only hot in places where no one lived. I suspect this temperature pattern would not score highly on Bastardi's population density metric. Toronto (downtown), Canada Excluding 7-days from 7/8 to 7/14: 79.6/58.6 Mean: 69.1F Boston, Massachusetts No heat wave to knock out, only a few discrete hot days scattered early-mid month. New York, New York Excluding 7-days from 7/8 to 7/14: 83.4/64.8 Mean: 74.1F Buffalo, New York Excluding 7-days from 7/8 to 7/14: 76.5/61.3 Mean: 68.9F Rochester, New York Excluding 7-days from 7/8 to 7/14: 78.9/59.0 Mean: 68.9F Hartford, Connecticut Excluding 7-days from 7/8 to 7/14: 81.0/60.4 Mean: 70.7F Harrisburg, Pennsylvania Excluding 8 days from 7/8 to 7/15: 83.8/63.9 Mean: 73.8F Philadelphia, Pennsylvania Excluding 7 days from 7/9 to 7/15: 83.4/66.9 Mean: 75.1F Scranton/Wilkes-Barre, Pennsylvania Excluding 7 days from 7/8 to 7/14: 82.7/59.0 Mean: 70.3F Williamsport, Pennsylvania Excluding 7 days from 7/8 to 7/14: 85.9/56.9 Mean: 71.4F Erie, Pennsylvania Excluding 7 days from 7/8 to 7/14: 78.8/61.8 Mean: 70.3F Washington, District of Columbia Excluding 8 days from 7/8 to 7/15: 85.3/67.3 Mean: 76.3F Hagerstown, Maryland Excluding 7-days from 7/9 to 7/15: 83.4/59.3 Mean: 71.4F Baltimore, Maryland Excluding 7-days from 7/9 to 7/15: 85.0/67.9 Mean: 76.4F Detroit, Michigan Excluding 7-days from 7/8 to 7/14: 82.6/58.9 Mean: 71.4F Lansing, Michigan Excluding 7-days from 7/8 to 7/14: 81.2/56.2 Mean: 68.7F Alpena, Michigan Excluding 7-days from 7/8 to 7/14: 80.9/48.0 Mean: 64.5F Akron, Ohio Excluding 7-days from 7/8 to 7/14: 84.0/58.0 Mean: 70.9F Toledo, Ohio Excluding 7-days from 7/8 to 7/14: 82.2/61.9 Mean: 72.1F Morgantown, West Virginia Excluding 7-days from 7/9 to 7/15: 85.9/56.5 Mean: 71.2F Elkins, West Virginia Excluding 7-days from 7/9 to 7/15: 80.7/57.3 Mean: 69.0F Clarksburg, West Virginia Excluding 7-days from 7/9 to 7/15: 84.9/59.3 Mean: 72.1F Milwaukee, Wisconsin Excluding 8-days from 7/8 to 7/15: 77.0/63.7 Mean: 70.3F Chicago, Illinois Excluding 8-days from 7/8 to 7/15: 80.9/66.2 Mean: 73.5F


-
It's kind of funny. Ryan Maue, on Twitter, was comparing low temperatures at Phoenix to those observed at Tuscon to illustrate the supposed UHI effect. However, he did not mention that Tuscon is 1500' higher in elevation. Wonder why he didn't compare the lows at Sky Harbor Airport to those at Furnace Creek? After all, nobody lives in Death Valley. Sky Harbor Airport is actually closer in elevation to Death Valley than to Tucson. Rather unsurprisingly, the low temperatures in Death Valley are significantly higher than those observed at PHX. Not because of more urbanization at the former than the latter, but rather the difference in elevation!
-
Wow - those lows! Clearly, it must be the urban heat island effect!
-
Cyclical or Natural Predictable Climate Change Forum
TheClimateChanger replied to ChescoWx's topic in Climate Change
I did a little comparison between PHX and Grand Canyon Airport (GCN) - the latter of which is quite literally in the middle of nowhere when it comes to human population density. Unfortunately, records for GCN were only available back to 1997 for GCN, but that still allowed for about a quarter century of data. From 1997-2022, I calculated a warming trend of 7.3F/century for daily maxima at GCN, 4.3F/century for daily minima, and 5.7F/century for daily mean temperature. For the same period at PHX, I calculated a warming trend of 10.0F/century for daily maxima, 7.8F/century for daily minima, and 8.8F/century for daily mean temperature. While the relatively short period of analysis makes drawing definitive conclusions a bit challenging, a couple of observations. It is warming at an alarming rate at both sites; however, PHX does show a residual warming trend of about 3.0F/century compared to GCN. This residual may be related to a growing urban heat island effect. However, Dr. Spencer's research would suggest that, at some point, the UHI effect will essentially "max out" and stop being a significant contributor to the trend. Second, maximum temperatures have climbed more than minimum temperatures at both sites over this interval. This is inconsistent with UHI effect. Mr. Maue has some graphics showing a collapse in the diurnal temperature range (DTR) at Phoenix since the mid 20th century. This data suggests that trend has reversed somewhat since the late 1990s, and DTR has increased by a small bit since that time. Lastly, I feel it is disingenuous to compare the PHX trend to the globally averaged trend and suggest all of the excess is due to UHI. It should be clear that the regional climate around PHX is warming considerably faster than the global average. -
Cyclical or Natural Predictable Climate Change Forum
TheClimateChanger replied to ChescoWx's topic in Climate Change
Ryan Maue seems to be suggesting that most of the warming in Phoenix is due to the urban heat island effect - what do you guys think? -
All I would say is that if a relatively normal, or some would say cool, July today results in mean temperatures similar to 1988 - which was front page, headline news everywhere for its heat and drought - what is going to happen when the conditions that created the drought and heat wave of that year recur in this new era? Makes me wonder if we aren't destined for some absolutely shocking summertime heat waves in the near future.
-
They've also bumped the normal temperatures up so much in the most recent release that it makes comparisons difficult. Look at Toledo, Ohio, it shows up as normal on the map; but if the month ended today, it would be the 24th warmest [out of 151 years] -- decidedly warmer than the long-term average. Prior to 2010, it would have been the 18th warmest [out of 138 years], as six of the warmer Julys have occurred in the 13 year period from 2010 to 2022. You take this same "normal" month and place it in the 1970s, 1980s, or 1990s and it would suddenly be considered a hot July.
-
Pittsburgh/Western PA Summer 2023
TheClimateChanger replied to Ahoff's topic in Upstate New York/Pennsylvania
Actually, the number of 85+ days, 90+ days, and 95+ days in the month of July all show a positive trend over that timespan - albeit rather small. On the order of 2 additional days each century for the first two categories, and 1 additional day every 1,000 years for the latter. It's very rare to reach 95+ at Pittsburgh International. No use examining the trend for 100+ days, when there have only been three such days in recorded history at the airport. Elsewhere on the forum, I got flamed for suggesting the 1988 and 1995 temperature records were somewhat inflated. But it's worth noting the hygrothermometer in place during that era (the HO-83 model) has a known warm bias, which largely led to its replacement in the ASOS units. Funny how the only 3 100+ days at PIT happened to occur in that narrow 10-ish year window while that unit was in place. Given the bias, only the 103F would probably be 100+ with the current equipment. The other two dates would have likely been 97-99F range. Source for some context: https://climateaudit.org/2007/08/22/the-ho-83-hygrothermometer/ So while I would agree that there has been no significant increase in extreme heat, I don't agree that it is necessarily getting less extreme. The actual data show the occurrence of extreme heat in July has been fairly steady since the early 1950s, but with a very small positive trend. I do think humidity and dew points are on the rise overall, though, but it's more difficult to obtain that data. Obviously, that wasn't the case for the start of this summer, but since the beginning of July it's been rather muggy. -
Cyclical or Natural Predictable Climate Change Forum
TheClimateChanger replied to ChescoWx's topic in Climate Change
I should clarify. I'm not a skeptic of the urban heat island effect per se, but rather I'm a skeptic of the theory that it is a significant driver of the global changes that have been observed. Actually, noted climate change skeptic, Dr. Roy Spencer, had an interesting analysis of the urban heat island effect back in March. His chart, which passes the eyeball test to me, suggests the effect is greatest as population increases at low density and then gradually decreases (although still positive) as population density increases. Interestingly, the chart also suggests that the effect has been decreasing over time. In other words, there was a more significant positive difference in temperature between densely populated urban areas and remote rural locations in the late 19th century than in the 21st century. Source: https://www.drroyspencer.com/2023/03/ While not framed this way by Dr. Spencer (for obvious reasons, given his skepticism), this actually gives credence and support to a negative temperature trend due to UHI for certain locations - namely those that have been super densely populated since the late 19th century (i.e., places like New York and Chicago). If the difference in temperature was greater in the 1800s in densely populated urban sites than zero population density locations, then it stands to reason that the UHI effect has actually imparted a small negative component to the trend for such sites. In other words, if the UHI effect has decreased for a given population density and those sites have not experienced an appreciable increase in population density over the period, then there must be a negative trend component attributable to the effect. This might seem to be a counterintuitive finding - and Dr. Spencer expressed surprise towards it - but several compelling theories were raised in the comments. My thinking is it's probably related to improved siting of urban stations. In the 1800s, the urban stations were almost exclusively sited in window sills (yes, you read that correctly) or on rooftops. Now they are mostly ground-based, often in an area of green space or parkland, or at an airport with more open grass than the dense urban core. But some other interested theories were offered in the comments - perhaps increased tree canopy cover, better building materials / insulation preventing loss of heat to the environment, and/or the advent of skyscrapers has led to more heat being trapped higher in the atmosphere as opposed to at the level of the thermometer. Those theories would suggest the UHI effect itself has been decreased, whereas my initial thought was simply improved temperature recording - i.e., there hasn't been a decrease in UHI, but rather some of the temperature difference which was previously ascribed to UHI was actually just a result of poor station siting and not actually UHI effect. In reality, it may be a combination of both of these factors. -
Occasional Thoughts on Climate Change
TheClimateChanger replied to donsutherland1's topic in Climate Change
-
Pittsburgh/Western PA Summer 2023
TheClimateChanger replied to Ahoff's topic in Upstate New York/Pennsylvania
It’s interesting, or, at least I found it interesting. But I was looking at the July numbers from Pittsburgh International (1953-present) and found a curious trend. From 1953-1986, only three years (out of 34) met or exceeded the current July mean of 74.1F. Those years were 1955, 1966, and 1980. Since 1987, 17 out of 36 years met or exceeded that temperature. So the current temperature went from a reading that would be reached less than once every ten years to one that’s reached or exceeded in more than 2 in 5 years. Since 2010, 7 of 13 Julys have exceeded 74.1F, or more than once every other year. I think some looking at this might chalk it up to land use changes or increase in urban heat island effect, but I’m just not sure if there’s been enough land use changes around the airport to explain this anomaly. What do you guys think? Are our Julys getting hotter? -
Central PA Summer 2023
TheClimateChanger replied to canderson's topic in Upstate New York/Pennsylvania
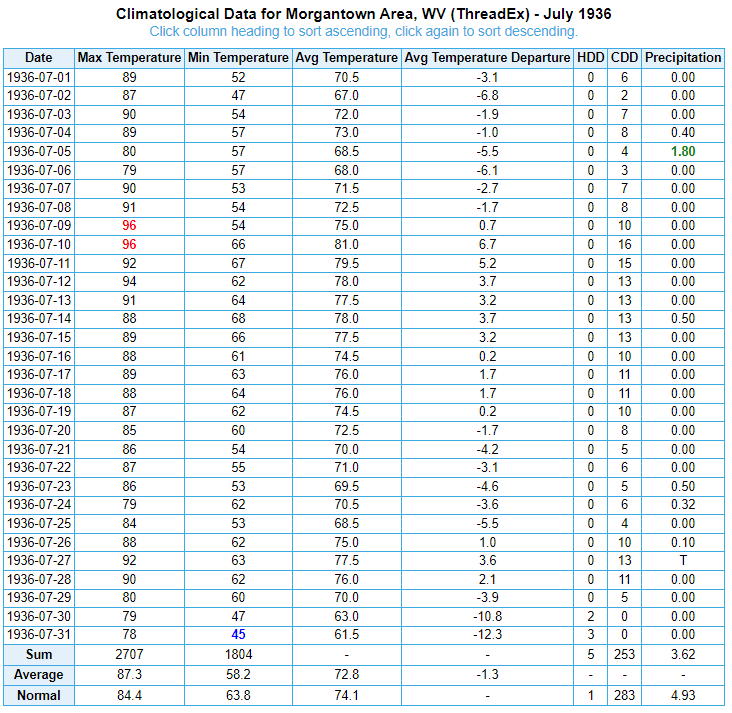
So I looked into this, and for whatever reason, the official numbers at Brookville have the high temperatures shifted forward one day versus the raw observation. So they actually reported a high of 88 and low of 44 on the 16th, and a high of 73 and low of 37 on the 30th, and so the actual observed high was exactly the same as observed at AGC on those dates. Lows were much lower, but I would argue it's the AGC low temperatures that are too high [perhaps due to the rooftop exposure in place at the time]? The lows of 37 and 39 to close the month might seem unbelievable, but I would point out that New Cumberland Lock and Dam in northern West Virginia, just west of Beaver County, Pennsylvania, had lows of 36 degrees on both of those dates. In any case, it's the official Pittsburgh numbers that are the outlier that month. I would suggest part of it is from the observations being at AGC at the time, and a big part the rooftop exposure of the equipment resulting in higher minima than would have been observed on the ground. Regardless, 75.0F at AGC is not that impressive. That's 0.4F less than the month to date there. And just since the ASOS was installed at AGC in 1998, this figure has been exceeded 10 times, excluding this year (which is still in progress). Assuming it stays above 75F this month, that will be 11 times in 25 years. New Castle 1N - a GHCN station - had a mean of 71.2F, 1.9F below the 1991-2020 average. Like the Brookville data, this data also has been time-shifted from the observations, so there are weird diurnal range discrepancies. Morgantown, W. Va. was 72.8F, 1.3F below the 1991-2020 average. The mean minimum temperature of 58.2F is fourth lowest out of 140 years of records.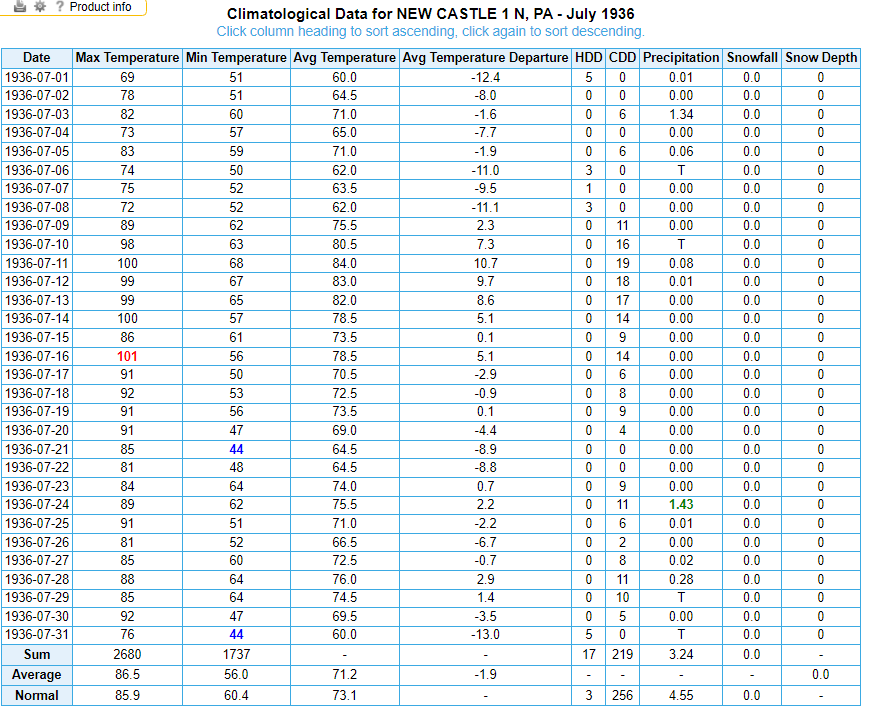
-
Central PA Summer 2023
TheClimateChanger replied to canderson's topic in Upstate New York/Pennsylvania
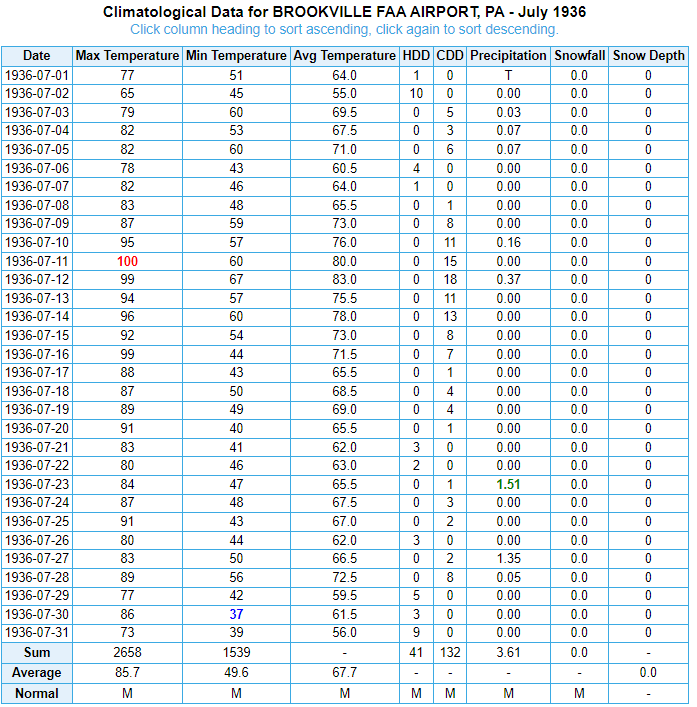
I have been seeing a lot of discussion about July 1936 on Twitter, and the incredible heat of that month. Looking at the data from Pennsylvania, it appears to have been a very pleasant month by modern standards. Outside of a fairly extreme 8-day heat wave, it was quite cool away from the cities and their inflated temperature readings. This is one heck of a way to run the allegedly hottest month on record. Looking at MPO, we see a mean temperature of 66.0F, roughly 5 degrees cooler than 2023. Looking at the Brookville FAA Airport site in Jefferson County, Pennsylvania - which is not threaded with the current Jefferson County Airport [KDUJ], but would be the best source of comparison -- we find a mean temperature of 67.7F, is nearly 5 degrees cooler than 2023 to date at DUJ. Also an unbelievably, refreshing mean monthly low of 49.6F - something never seen today in Pennsylvania at low elevations (maybe even high?).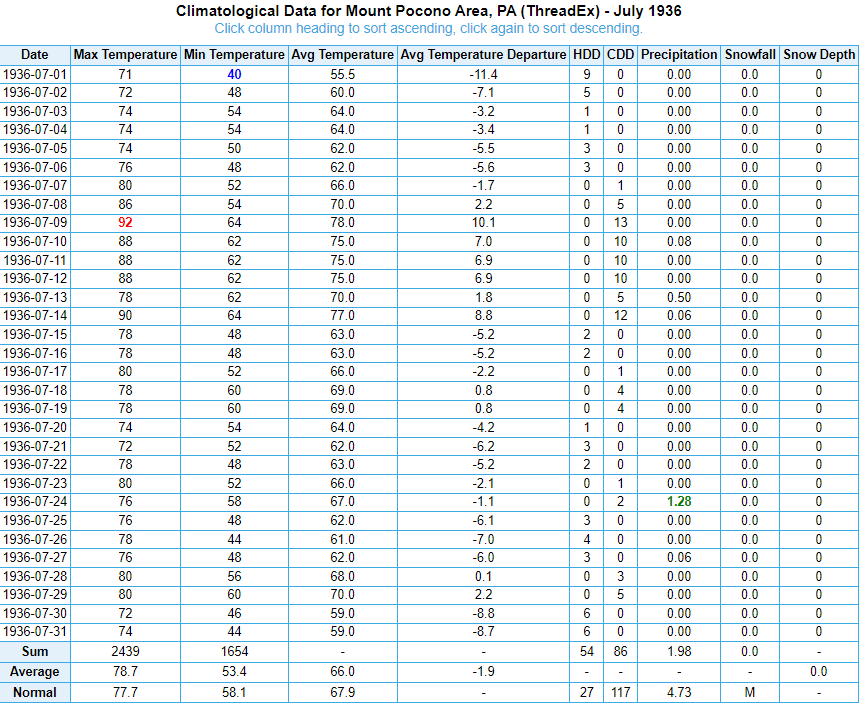
-
Central PA Summer 2023
TheClimateChanger replied to canderson's topic in Upstate New York/Pennsylvania
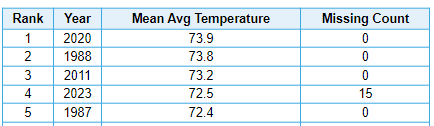
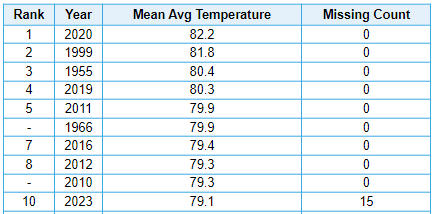
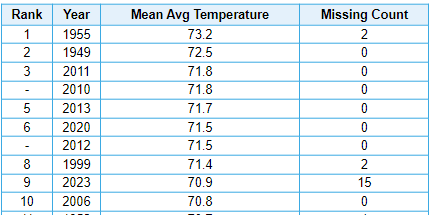
Will be interesting to see how the last two weeks of the month play out. Very warm start to July. The current mean of 70.3F at Bradford would be good for second place (out of 66 years), behind only the incredibly scorching July of 2020. The current mean of 72.5F at DuBois would be good for 4th place (out of 59 years): NOTE: The late 1980s data is probably unreliable, since it was likely measured with an HO-83 thermometer, which has been shown to produce a warming bias of greater than 1 degree Celsius, especially in the summertime. So, in reality, all of the warmest months are probably from the 2010s and 2020s. Looking at some locations with longer "threaded" histories. Some of the earlier figures are probably too warm due to issues with equipment, exposure, and siting. But a similar story emerges. Due to the recent trends, I've included the corresponding ranking excluding post-2010 years, which I feel provides a better historical context for the heat. 10th warmest on record at Harrisburg, PA (out of 136 years) [prior to 2010, this would be ranked 4th warmest]: 9th warmest on record at Mount Pocono, PA (out of 114 years) [prior to 2010, this would be ranked 4th warmest]: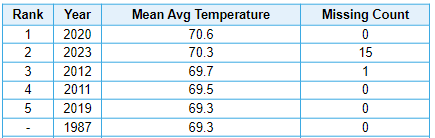
-
Cyclical or Natural Predictable Climate Change Forum
TheClimateChanger replied to ChescoWx's topic in Climate Change
I've noticed this trend too. A lot of blame for warming placed on UHI, but then when you run the numbers, it's the rural, secluded sites surrounding by montane forests that have the most warming. I think the greenhouse warming effect may be more significant in places that used to radiate amazingly well, and it could be impacting mountainous, high elevation sites moreso than lower elevation sites through an increase in the conditions that lead to temperature inversions. That, or the urban sites changed locations and exposures a lot - from window sills, to rooftops, to modern ground-based measurements at suburban airport locations. I think there's little, if any, evidence of any significant urban heat bias in the temperature records. I would even go further and argue that the urban heat island effect itself is exaggerated, and to some degree, the result of substandard siting and exposure of equipment, coupled with the fact that the dense urban cores tend to be located at lower elevations than the surrounding suburbs - a natural result of cities popping up around bodies of water, whether it be the coastal Plain or a broad valley at the confluence of multiple rivers. Obviously, the city resting hundreds of feet below the outlying areas will be hotter. When I ran the numbers last year based on airport records, I found little dependence on population of the surrounding county. Instead, almost all of the variance could be attributed to elevation and latitude. Airports, in particular, tend to be at higher elevations than the cities they service (for obvious reasons), or, alternatively, immediately adjacent to large bodies of water that have a cooling effect relative to locations even a few blocks inland. I'm certainly a skeptic of the claim that most of the warming is due to urban heat and land use changes. Remarkable claims require remarkable evidence, and I don't see any evidence for that claim. I do see a lot of evidence of greenhouse gas warming, though. -
Central PA Summer 2023
TheClimateChanger replied to canderson's topic in Upstate New York/Pennsylvania
This piqued my curiosity, so I decided to take a look at the numbers for DCA and it's the same exact story as Pennsylvania. 15th warmest (out of 152 years), so that is 90th percentile temperature. We live in a world where 90th percentile heat at the hottest time of the year is considered to be a major victory, because we are so used to it being 95-99th percentile each year. It's just the nature of the world we are living in. DCA is easily beating years like 1988 & 1995, from my youth, that were considered to be unbelievably hot. Even just a tiny fraction of a degree below 1999 to date. -
Central PA Summer 2023
TheClimateChanger replied to canderson's topic in Upstate New York/Pennsylvania
It certainly has been anything but cool. July is already the hottest month of the year, and the records show many areas are running close to the 90th percentile for the first two weeks of the month [i.e., warmer than 9 out of 10 years]. Even at PIT, where the thermometer has oddly been running a bit cooler than most surrounding sites, it's 20th warmest out of 78 years at the airport site, so roughly 75th percentile. 75-90th percentile for heat at the hottest time of the year is certainly not cool, by any stretch of the imagination. No matter how it's distorted. I like to look at actual data, not conjecture about lack of "extreme heat" - whatever that means. That's a subjective thing. It's been very hot. There were 17 heat-related hospitalizations at the Ed Sheeran concert this past weekend in Pittsburgh, even though the air temperature was only lower 80s. -
Central PA Summer 2023
TheClimateChanger replied to canderson's topic in Upstate New York/Pennsylvania
All I know is I've had to run the air conditioning since late June. There was a cool spell in late June, but it was marred by dense smoke and so I had to keep the windows shut due to air quality. Since then, it's mostly been low/mid 80s and humidity, with lows in the low/mid 60s. We used to get occasional crisp days in the 70s, where you would go to an outdoor concert or event and it would be in the low/mid 60s and you'd actually be chilly without a jacket or long sleeves. We don't get that anymore. -
Yes, I have a lot of confidence in those readings. It's measuring air temperature, not rocket science. They used sheltered mercury thermometers that were properly calibrated, and carefully observed the temperature three times daily. These aren't records from a random Joe, but War Department records from the Signal Service Corps generally taken by army surgeons. The tri-daily mean actually produces a warming bias compared to the average of maximum and minimum, so if anything it was cooler than reported. In any case, it's a LOT easier to produce spuriously high temperatures than low temperatures. The readings also line up with each other, as well as our understanding of climate change and impacts of land use changes and urbanization over time. And they are in line with the earliest Weather Bureau readings which show a lot of cool temperatures, especially in 1875.
-
Central PA Summer 2023
TheClimateChanger replied to canderson's topic in Upstate New York/Pennsylvania
The 8-14 day outlook valid for this past week from the beginning of them month was cold and wet. While there may have been more rainfall, temperatures have verified warmer than normal. The week 3 & 4 outlook also had cold and wet, and it looks like continued normal to warmer than normal weather for the next week. The 8-14 day again wants to bring cooler temperatures the following week, but I have my doubts. -
Pittsburgh/Western PA Summer 2023
TheClimateChanger replied to Ahoff's topic in Upstate New York/Pennsylvania
Looks like we'll notch our first official 90 of July tomorrow. I realize some parts of the area have already seen 2 or 3 days of 90+, but none at PIT yet.


