

TheClimateChanger
-
Posts
4,574 -
Joined
-
Last visited
Content Type
Profiles
Blogs
Forums
American Weather
Media Demo
Store
Gallery
Everything posted by TheClimateChanger
-
Report: Another Year of Record Heat for the Oceans
TheClimateChanger replied to donsutherland1's topic in Climate Change
17 years at Caribou (since records began in 1939) have had monthly mean temperatures less than or equal to the current monthly minimum average for 2023. -
Report: Another Year of Record Heat for the Oceans
TheClimateChanger replied to donsutherland1's topic in Climate Change
Clearly, the Caribou lows are being elevated by the runaway urban heat island effect and non-existent jet traffic there. -
Pittsburgh/Western PA Summer 2023
TheClimateChanger replied to Ahoff's topic in Upstate New York/Pennsylvania
Fairbanks, Alaska has had as many 90-degree days as us this summer: National Weather Service : Observed Weather for past 3 Days : Fairbanks, Fairbanks International Airport -
-
Occasional Thoughts on Climate Change
TheClimateChanger replied to donsutherland1's topic in Climate Change
https://www.cnn.com/videos/world/2023/07/25/exp-climate-crisis-disaster-eliot-jacobson-vause-intv-07251aseg1-cnni-world.cnn -
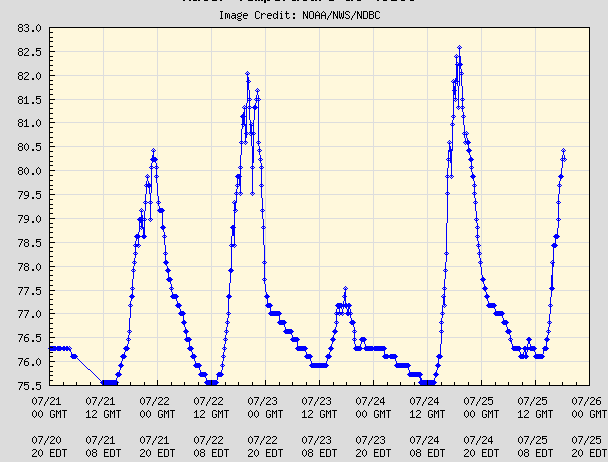
Wonder if we'll see some 90+ degree buoy readings on Lake Erie with the upcoming heat wave? Doesn't look like we'll be seeing those 101 degree SSTs they had off Key Largo, Florida, but 90 degrees is certainly a distinct possibility. 1 m water temperature up to 80 at the Toledo Crib. Reached 83 yesterday afternoon. Probably a decent chance of reaching into the 90s there in the coming days. Source: NDBC - Station 45165 Recent Data (noaa.gov)
-
Occasional Thoughts on Climate Change
TheClimateChanger replied to donsutherland1's topic in Climate Change
-
Occasional Thoughts on Climate Change
TheClimateChanger replied to donsutherland1's topic in Climate Change
Fortunately, it is mostly a myth that Europe is warmed by the Gulf Stream. In fact, the relative winter warmth is driven principally by stationary waves in the atmospheric flow driven by the Rocky Mountains in North America, and the atmospheric transport of heat released by the oceans that had been stored in the summertime. Actual oceanic heat transfer is only a minor contributor. Warming from rising greenhouse gases would probably exceed any cooling from an AMOC collapse. You have to be skeptical of a paper that predicts a colder future for Europe, when it contradicts our existing knowledge. See: The Gulf Stream Myth (columbia.edu) The Gulf Stream and future climate change A slowdown of the Gulf Stream and ocean circulation in the future, induced by freshening of the waters caused by anthropogenic climate change (via melting glaciers and increased water vapor transport into high latitudes) or simply by warming, would thus introduce a modest cooling tendency. This would leave the temperature contrast across the Atlantic unchanged and not plunge Europe back into the ice age or anything like it. In fact the cooling tendency would probably be overwhelmed by the direct radiatively-driven warming by rising greenhouse gases. -
Pittsburgh/Western PA Summer 2023
TheClimateChanger replied to Ahoff's topic in Upstate New York/Pennsylvania
Looking more closely at the data, there are 69 days of 95+ in 71 years, which is an average of just under 1 per year. However, those 69 days were spread across only 21 years, meaning the actual incidence of a 95 or better reading is only roughly 2 out of each 7 years. It is much more common not to reach 95 than it is to reach that value. Using historical averages, approximately 5 out of every 7 years would be expected to reach no more than 94 degrees. In years in which it reaches at least 95 degrees, it is much more likely than not to reach that value multiple times. Of the 21 years in which 95 or better was reached, 13 of them reached that figure on multiple occasions. Further, 8 years failed to even reach 90 - meaning it is 4x more likely that the temperature will not exceed 89 than it is to reach 100. Historically, about 1 in every 9 years at PIT fails to reach 90. There were no years between 1953 and 1975, inclusive, in which it failed to reach at least 90. The longest stretch since 1975 with no years topping out at 89 or below is 9 years, set three times - 1983 to 1991; 2005 to 2013; and 2015 to 2023. If it reaches 90 or better next year, we will be in the longest consecutive stretch with no years topping out below 90 since 1976. -
Pittsburgh/Western PA Summer 2023
TheClimateChanger replied to Ahoff's topic in Upstate New York/Pennsylvania
That's because extreme heat is exceptionally rare. There have only been 21 years since records began at Pittsburgh International Airport in September 1952, in which the mercury reached 95 or better. There have only been 2 years since records began there, in which the mercury reached or exceeded 100 degrees. Honestly, the 95+ readings in the late 1980s through mid 1990s were very likely inflated by the use of the HO-83 hygrothermometer in that era, which has a known, significant warm bias - particularly on sunny days with light winds in the warm season. So it's not suprising to find 30 of the 69 days of 95+ occurred between 1988 and 1995, in a period of about a decade or so in which that hygrothermometer model was in use. All 3 100+ readings at PIT also occurred in that era. From 1956 through 1987, a period of 32 years, there were 16 days in which the temperature reached or exceeded 95 degrees, spread across 8 years.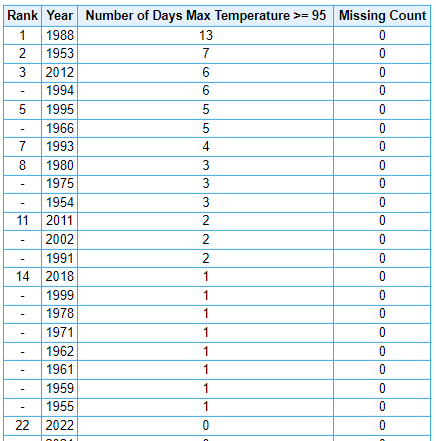
-
Cyclical or Natural Predictable Climate Change Forum
TheClimateChanger replied to ChescoWx's topic in Climate Change
Fake news. -
No reason to expect this to continue for the rest of this century or beyond. I would expect to eventually reach a level of warming where it is no longer feasible to grow most crops in that region, which would lead to crop failures and extremely rapid warming. In such a scenario, the cooling effect would not only be reversed, but replaced by an articifial warming effect of a desert-like landscape devoid of crops. If this were to occur, parts of the midwest could see temperatures approach or exceed the all-time world record. Temperatures of 120+ have already been observed in the Dakotas, including at CO2 levels not much above 300 ppm. I don't think it's out of the question to see 130+, maybe even 140 degrees, were that same weather pattern to recur at CO2 levels of say 450-500 ppm. Even if high temperatures stay in the 110s to around 120, low temperatures may struggle to drop below 95 or 100 in the high CO2 environment. This type of warmth would dessicate and destroy all plant life in the region, leading to flash desertification. I don't know if this is an effect the models produce. But this is just thinking logically and using past weather as a guide to project what could happen in a worst-case scenario. Unfortunately, most people seem unwilling to even consider the possibility of a worst-case scenario. And instead point to the 1934 and 1936 drought and heat wave as evidence of past periods of climate tumult and assume (incorrectly) that our improved farming and soil conservation techniques will prevent that from recurring. However, it is certainly possible that the weather, in the near future, could become so harsh that there is a season where widespread crop failures occur despite our agricultural advances. If this were to occur, then you could see a recurrence of Dust Bowl conditions in a high CO2, enhanced greenhouse effect environment.
-
Report: Another Year of Record Heat for the Oceans
TheClimateChanger replied to donsutherland1's topic in Climate Change
-
Central PA Summer 2023
TheClimateChanger replied to canderson's topic in Upstate New York/Pennsylvania
One of only two years (out of 136) at Harrisburg, where the minimum temperature has not dropped below 65F.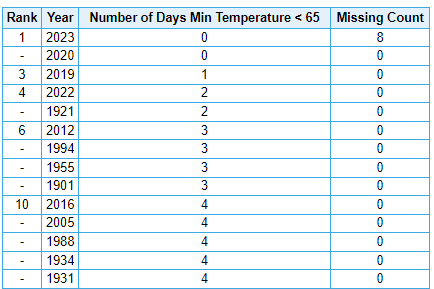
-
Central PA Summer 2023
TheClimateChanger replied to canderson's topic in Upstate New York/Pennsylvania
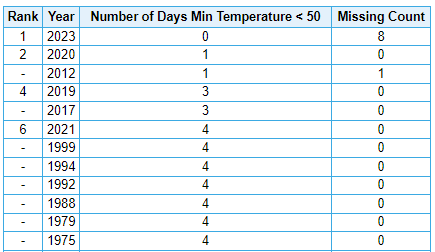
Appears to be a good chance that this month will be the first to not have at least one low temperature below 55 at DuBois-Jefferson County Airport (dating to 1963), and one low temperature below 50 at Bradford Regional Airport (dating to 1957). While it hasn't been a super hot month, it has been consistently warm - particularly at night - leading to elevated minima. DuBois [days with minimum <55F] Bradford [days with minimum <50F]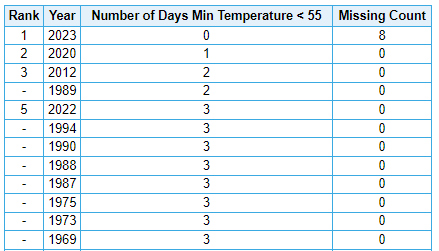
-
Central PA Summer 2023
TheClimateChanger replied to canderson's topic in Upstate New York/Pennsylvania
I am working, so I didn't have time to respond. 1) I did not intend to cherrypick a date. I ran the analysis after seeing well-known Alaskan climatologist Brian Brettschneider's map earlier today on Twitter. I wasn't even aware there was a negative trend in snowfall. 2) Brian's map ran from 1973 - a period of 50 years. I selected 1950 to integrate more data, and specifically chose that date because (1) that's around the time most observations moved to airports from city centers; and (2) observations prior to that timeframe include a lot of missing data and generally seem less reliable to me. I did not realize the 1960s were an unusually snowy period in eastern Pennsylvania. It was one of the least snowy decades at Pittsburgh. 3) Yes, the linear trend line is not a good fit. But that is, indeed, the best fit linear trend line calculated by Excel for each of those datasets. The r-squared value is very low, because the data is so noisy. You are not going to generate a strong fit with such noisy data. -
Central PA Summer 2023
TheClimateChanger replied to canderson's topic in Upstate New York/Pennsylvania
The trend at Williamsport is even worse. A loss of about 26" per century. Wow - I had no idea the situation was so bleak on that side of the state.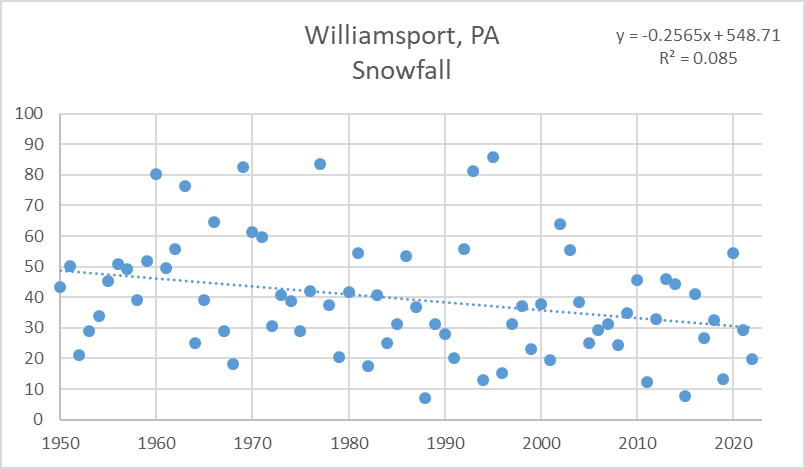
-
Central PA Summer 2023
TheClimateChanger replied to canderson's topic in Upstate New York/Pennsylvania
Wow! I redid this trend for Harrisburg, PA, and snowfall has plummeted at a rate of 20" per century since 1950 for Harrisburg. That is wild.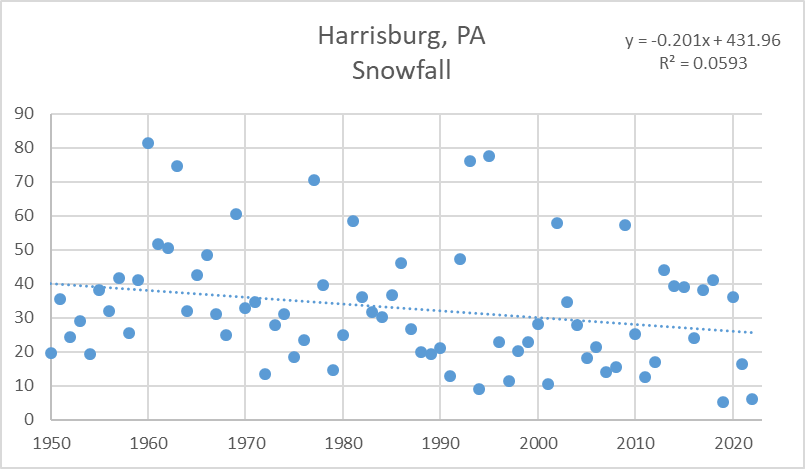
-
Pittsburgh/Western PA Summer 2023
TheClimateChanger replied to Ahoff's topic in Upstate New York/Pennsylvania
For context, here is the graph for Pittsburgh since 1950. The first few years are from AGC, the rest at PIT. I used 1950, as I feel that's the start of reasonably reliable snowfall records. Not to mention, the early years were all downtown.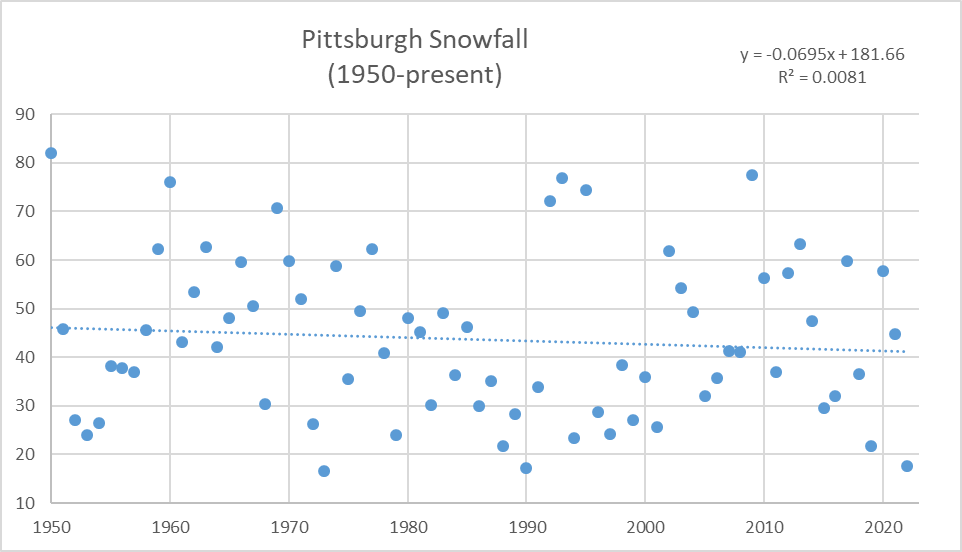
-
Pittsburgh/Western PA Summer 2023
TheClimateChanger replied to Ahoff's topic in Upstate New York/Pennsylvania
So far, we have been fairly lucky, although snowfall has trended downwards over the past several decades. Since 1950, I calculate the trend as a loss of 7" per century, so a fairly slow decline. But looking at the map posted by Brian Brettschneider, it looks like the oranges and reds aren't looming too far to our south. Do you guys think we will eventually reach a level of warming where snowfall in Pittsburgh plummets on the order of 25 or 50 percent? -
Central PA Summer 2023
TheClimateChanger replied to canderson's topic in Upstate New York/Pennsylvania
I had responded earlier, noting the daily high shift from the actual observations. This site reported a 7 am observation time - which was pretty rare in the 1930s. Most sites observed temperatures between 5 and 8 pm, which resulted in "double counting" of high temperatures, relative to a midnight-to-midnight day. Also missed the occasional midnight daily lows that occur. What appears to happen is the algorithm used to clean these records up assumed the high temperature was being assigned to the day on which it was measured, and so it shifted them all back since the high actually would have occurred the prior day. However, it appears that this observer was already making that shift, ascribing the max temperature at 7 am to the prior day and the low to the day on which it was observed. So the algorithmic shift incorrectly bumped all the highs to the day prior to when they occurred. -
Central PA Summer 2023
TheClimateChanger replied to canderson's topic in Upstate New York/Pennsylvania
The next few days will likely drop those figures a bit, but modeling shows hotter weather moving in by middle of next month and perhaps through the end of the month. Therefore, I felt pretty comfortable that the final figures should be fairly similar to the current ones (and possibly, a bit higher depending on how the heat performs later this month). The fact that upper 40s in northern Pennsylvania is a big deal now just shows how these changes have been normalized. There have been years where the mean minimum at Bradford for the entire month of July was in the 40s, including as low as 47.3 in 1971. -
Has the NWS shared the 2022-2023 snowfall map yet?
-
Central PA Summer 2023
TheClimateChanger replied to canderson's topic in Upstate New York/Pennsylvania
Records are from Jefferson County Airport. -


