

TheClimateChanger
-
Posts
4,051 -
Joined
-
Last visited
Content Type
Profiles
Blogs
Forums
American Weather
Media Demo
Store
Gallery
Everything posted by TheClimateChanger
-
Pittsburgh, Pa Winter 2023-24 Thread.
TheClimateChanger replied to meatwad's topic in Upstate New York/Pennsylvania
At least they've got some good college football up there now. -
Yes, sorry. April 26th.
-
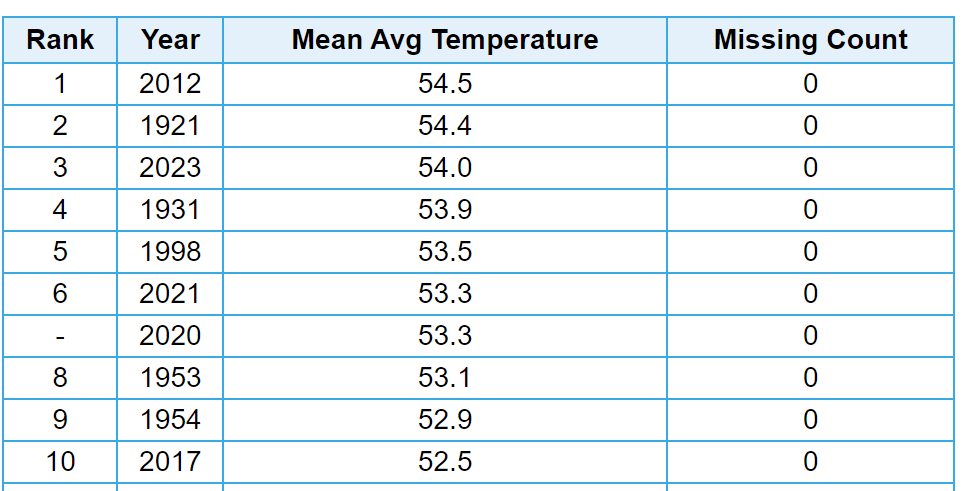
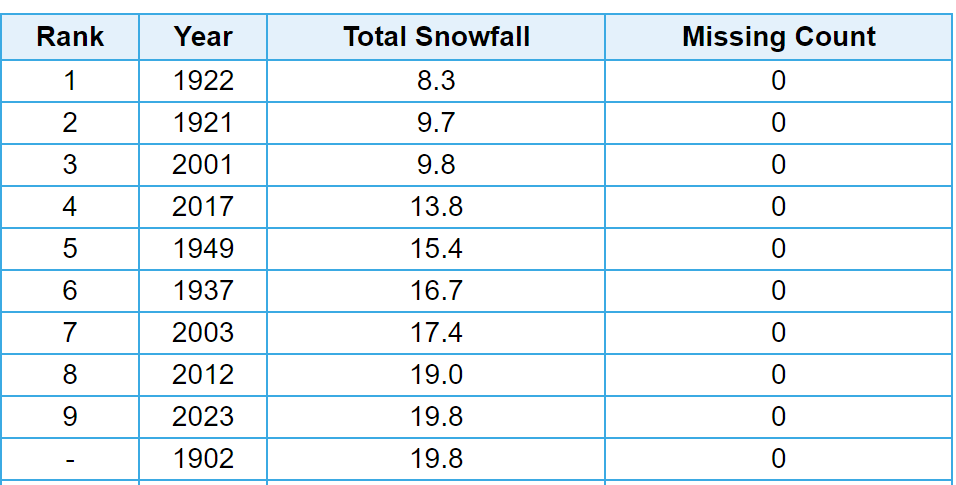
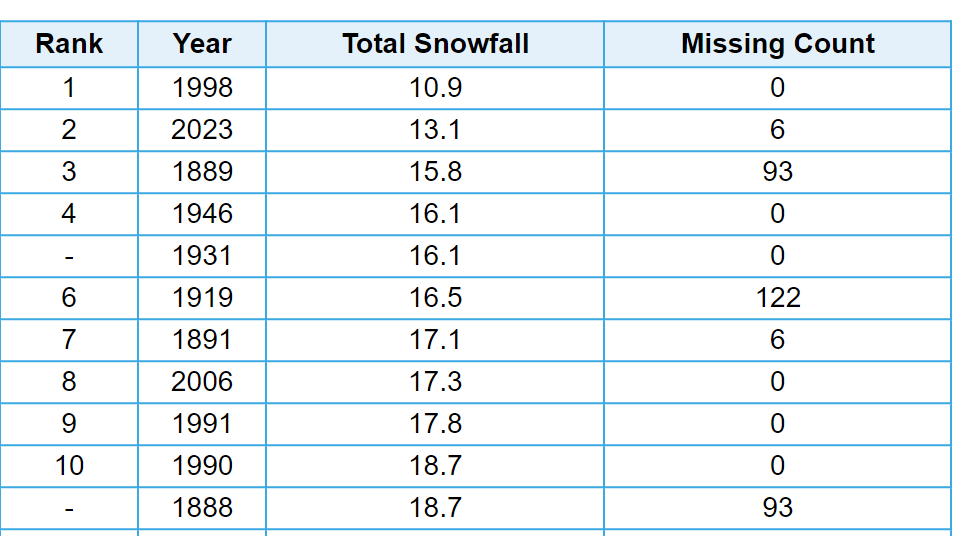
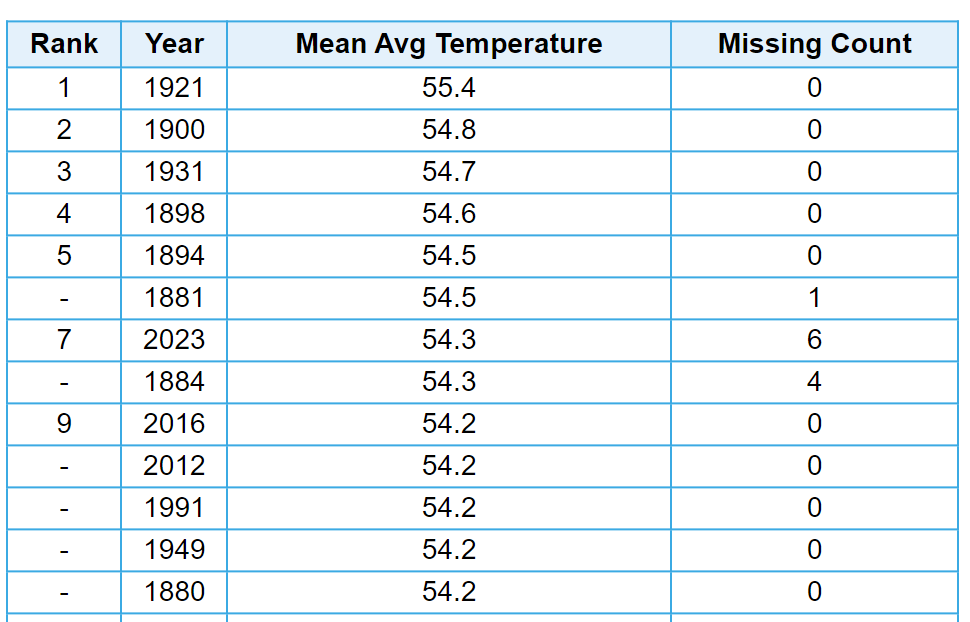
Happy New Year all! 2023 was certainly an historic year on the weather front. Here are some characteristic statistics from Chicago for the year. The annual mean temperature of 54.0F, was the third highest in the threaded records, behind 2012 and 1921. Not shown, but the mean maximum temperature of 62.4F was second warmest on record behind 2012, and the mean minimum temperature of 45.7F was third warmest on record behind 1921 and 1931. Precipitation totaled 33.73 inches, just a bit drier than the median [71st driest of 153 years]. Snowfall for the calendar year totaled 19.8 inches, tying 1902 for the 9th least snowfall in a calendar year. Of note, 6 of the 11 least snowy calendar years have occurred within the past 23 years (2006, is 11th). Notable daily observations: Highest Maximum temperatures [records in bold] 83F, on 4/13 - Highest 83F on 4/14 - Second highest 87F on 5/7 - Highest (tied) 91F on 5/30 - Third highest (tied) 98F on 8/23 - Highest 100F on 8/24 - Highest (tied) 87F on 10/1 - Second highest 87F on 10/3 - Third highest (tied) 83F on 10/24 - Highest (tied) 59F on 12/25 - Second highest Lowest Maximum temperatures [records in bold] None in top three. Lowest Minimum temperatures [records in bold] 31F on 4/26 - Third lowest (tied) Highest Minimum temperatures [records in bold] 39F on 1/3 - Second highest (tied) 38F on 1/11 - Third highest 40F on 1/16 - Third highest 36F on 1/18 - Third highest (tied) 36F on 2/9 - Third highest (tied) 64F on 4/15 - Second highest (tied) 77F on 8/23 - Highest 75F on 8/24 - Second highest (tied) 68F on 10/4 - Third highest (tied) 62F on 10/24 - Third highest 61F on 10/25 - Second highest 65F on 10/26 - Highest 46F on 12/8 - Second highest 41F on 12/16 - Third highest (tied) 48F on 12/24 - Third highest 50F on 12/25 - Highest
-
Still managed 4 of the top ten in the last 27 years. Considering there’s 155 years of records, that’s a fair amount for that time frame.
-
Pittsburgh, Pa Winter 2023-24 Thread.
TheClimateChanger replied to meatwad's topic in Upstate New York/Pennsylvania
Nice surprise here. A little less than an inch. Very picturesque with the snow clinging to all surfaces, except paved surfaces which are just wet. -
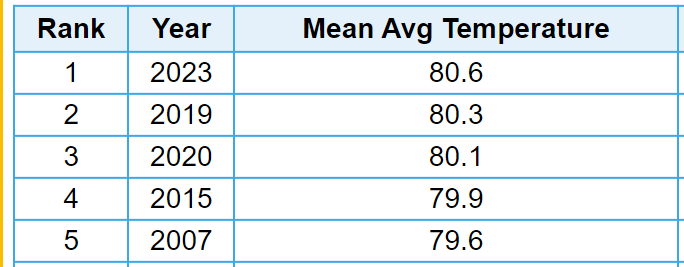
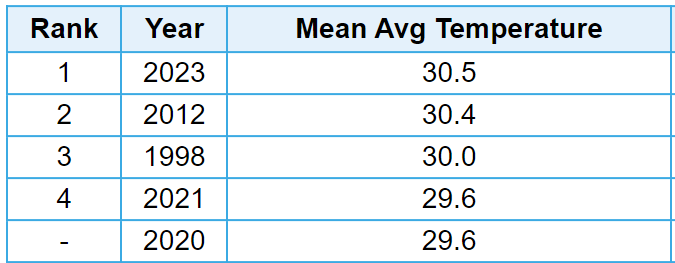
Just an absolutely historic year with record breaking heat from Key West to the top of Mount Washington. Unreal. Nice symmetry there too. One of only three years with a mean average temperature greater than 80F at Key West (2023, 2020, 2019), and one of only three years with a mean average temperature greater than 30F at Mount Washington (2023, 2012, 1998).
-
El Nino 2023-2024
TheClimateChanger replied to George001's topic in Weather Forecasting and Discussion
Yeah, this is what I’ve seen discussed recently on Reddit too. Mold and fungus everywhere. Also, weird bugs replacing the native insect populations. https://www.reddit.com/r/Homesteading/s/tcUBi9rZtS -
Pittsburgh, Pa Winter 2023-24 Thread.
TheClimateChanger replied to meatwad's topic in Upstate New York/Pennsylvania
Look at this cope. 804-hour ensemble mean and control run. I'm old enough to remember when every 384 hour run in the wintertime had more snow than this. For Pittsburgh (and much of the region, for that matter), the ensemble mean looks below average to me. A foot over 35 days in the heart of winter? The control run looks about average, maybe a bit above (16-18 inches around Pittsburgh). Sure this would be a godsend compared to the last couple of years, but it certainly isn't anything unusual outside of the NYC to New England region [which probably won't happen because this is an 804 hour model run]. I love how he focuses on the control run showing 30 inches in NYC - how about it showing an inch in Minneapolis, and only a foot in the UP of Michigan? More snow in west Texas than Marquette? -
Maybe 2024 will be better.
-
Pittsburgh, Pa Winter 2023-24 Thread.
TheClimateChanger replied to meatwad's topic in Upstate New York/Pennsylvania
Looks like it. This is averaged by month. Given today's observed weather and the forecast for the remainder of the week, I can't see the December monthly mean falling enough to change the annual mean. PIT Airport Pittsburgh threaded record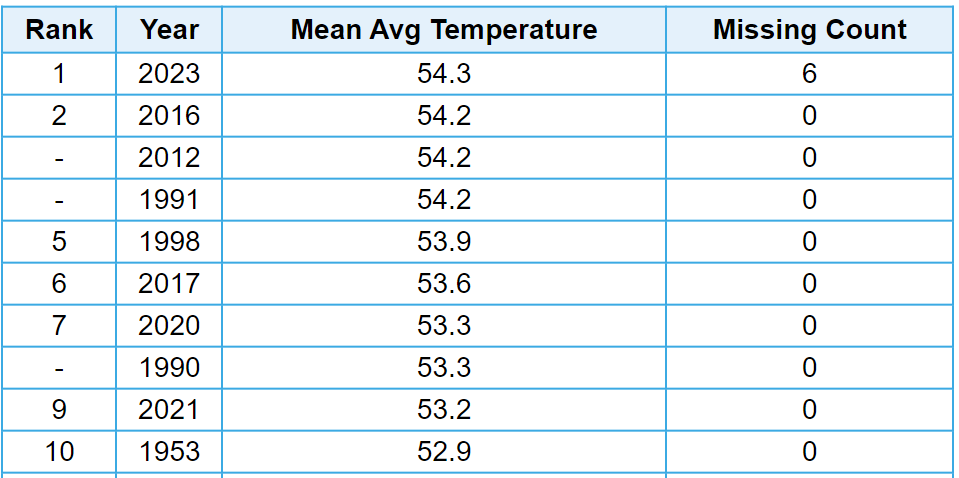
-
Winter '23-'24 Piss and Moan/Banter Thread
TheClimateChanger replied to IWXwx's topic in Lakes/Ohio Valley
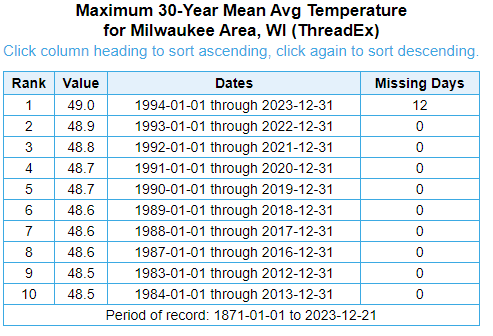
Also of note, this is shaping up to be the warmest running 30-year average in the Chicago threaded weather record. Prior to the current 30-year period, all of the other top ten warmest were from the warmer Midway site [with, in a handful of cases, some years from the downtown city station]. Now that ORD has crossed the proverbial "Rubicon" in a sense, with the current running 30-year mean leapfrogging all of the older Midway records, I suspect from here on out, it will resemble the MKE and DTW trends, with each and every year, slowly but inexorably climbing higher until the end of meaningful time.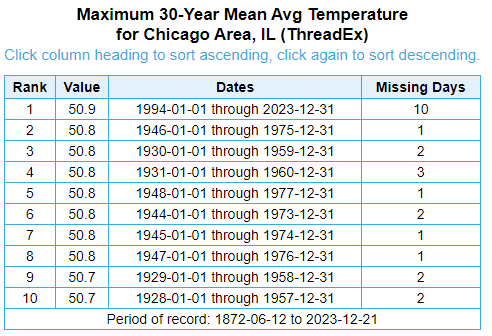
-
Winter '23-'24 Piss and Moan/Banter Thread
TheClimateChanger replied to IWXwx's topic in Lakes/Ohio Valley
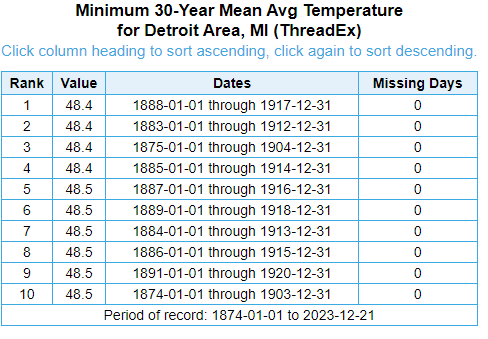
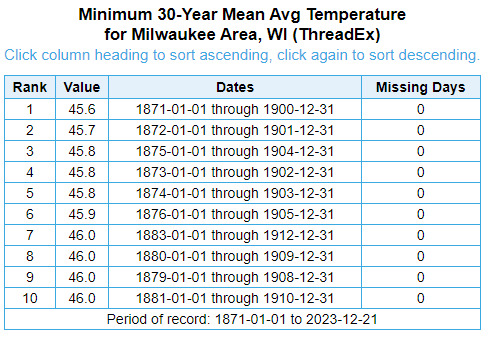
Just relentless warming on the running 30-year mean at this point - every year inexorably climbing higher and higher. The only thing that caused a brief pause was a chilly 2014. By comparison, here are the record low 30-year means: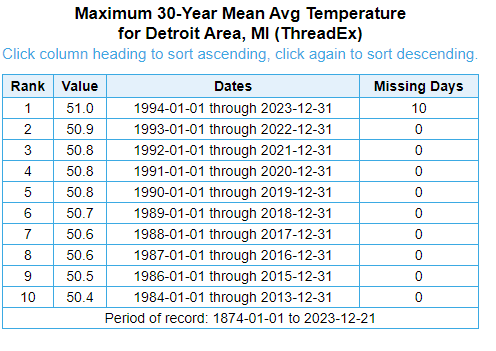
-
Central PA Winter 23/24
TheClimateChanger replied to Voyager's topic in Upstate New York/Pennsylvania
For informational purposes, here are the top 20 5-year snowfalls at MDT: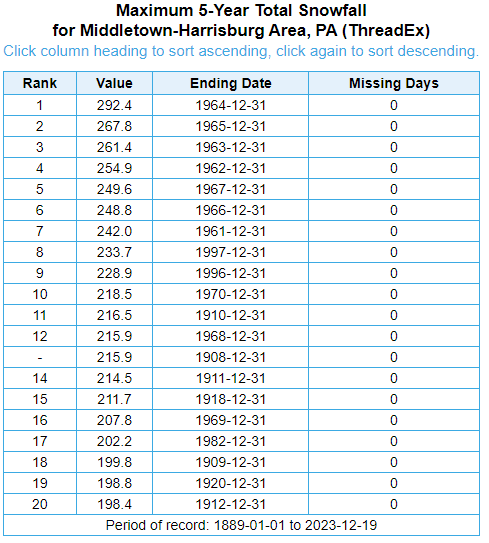
-
Central PA Winter 23/24
TheClimateChanger replied to Voyager's topic in Upstate New York/Pennsylvania
Assuming less than 3.5 inches falls between now and the end of the month, this is the third lowest 5-year snowfall on record at MDT - behind only the 5-year periods ending on 12/31/1934 & 12/31/1992.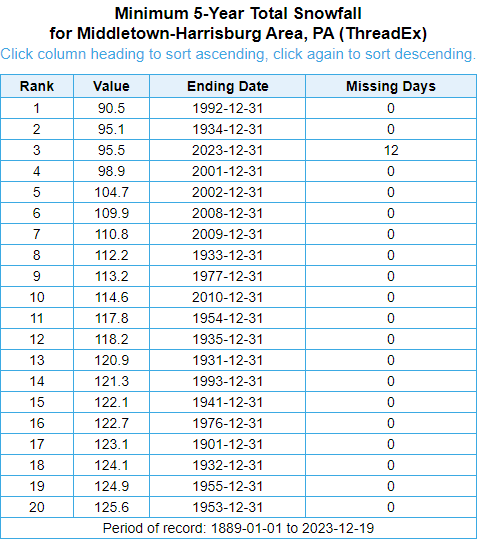
-
Pittsburgh, Pa Winter 2023-24 Thread.
TheClimateChanger replied to meatwad's topic in Upstate New York/Pennsylvania
Picked up around an inch in my backyard. -
Pittsburgh, Pa Winter 2023-24 Thread.
TheClimateChanger replied to meatwad's topic in Upstate New York/Pennsylvania
Finally starting to accumulate a bit here. Temp is down to 31.8F. -
Pittsburgh, Pa Winter 2023-24 Thread.
TheClimateChanger replied to meatwad's topic in Upstate New York/Pennsylvania
Plenty of these still hanging around too. -
Pittsburgh, Pa Winter 2023-24 Thread.
TheClimateChanger replied to meatwad's topic in Upstate New York/Pennsylvania
It looks like snow, but I think it’s ice from the skating rink. -
Central PA Winter 23/24
TheClimateChanger replied to Voyager's topic in Upstate New York/Pennsylvania
Maybe it's just me, but I'm not overly enthused by little more than a half inch of snowfall modeled over a 10-day period, when the current average single day snowfall is 0.3" and rising. -
December 2023 General Discussion
TheClimateChanger replied to michsnowfreak's topic in Lakes/Ohio Valley
Up to at least 54 at Milwaukee, which would be good for 3rd warmest (tied) on today's date. Yesterday was also tied for 3rd warmest for that date. Another degree would move today into second place. But look at #1, wow! Crazy two-day torch two years ago.
-
Pittsburgh, Pa Winter 2023-24 Thread.
TheClimateChanger replied to meatwad's topic in Upstate New York/Pennsylvania
Meteor shower tonight. I’ve seen two in the last 15 minutes. -
Central PA Winter 23/24
TheClimateChanger replied to Voyager's topic in Upstate New York/Pennsylvania
I shared this in the Pittsburgh area thread, but figured it would be relevant here as well since there are frequent complaints about the airport readings. I have been seeing a lot of complaints about airport readings everywhere. -
Pittsburgh, Pa Winter 2023-24 Thread.
TheClimateChanger replied to meatwad's topic in Upstate New York/Pennsylvania
-
Interesting. Has snowfall increased or decreased over that time?
-
Winter '23-'24 Piss and Moan/Banter Thread
TheClimateChanger replied to IWXwx's topic in Lakes/Ohio Valley
- 848 replies
-
- 11
-


