All Activity
- Past hour
-
I don't, either. My mind has been made up for months, but as in mathamtics, time to show the work.
-

2025-2026 ENSO
40/70 Benchmark replied to 40/70 Benchmark's topic in Weather Forecasting and Discussion
I have no issue with that...totally reasonable take. -
31 and frosty this morning!
-
I agree with probably 95% of your thoughts on this winter…however, I do part ways on the PNA. I think it’s going to be significantly more negative than you are thinking….no, not 2022-23 negative obviously, but yea
-
2025-2026 ENSO
40/70 Benchmark replied to 40/70 Benchmark's topic in Weather Forecasting and Discussion
I have already asked Santa for some pro winter posts from @snowman19for Christmas....he has his work cut out for him. -
2025-2026 ENSO
40/70 Benchmark replied to 40/70 Benchmark's topic in Weather Forecasting and Discussion
Yea, I think most would sign for wintry holiday period, regardless of what was in the fine print of the deal with the devil. -
2025-2026 ENSO
40/70 Benchmark replied to 40/70 Benchmark's topic in Weather Forecasting and Discussion
There is definitely some warmer risk mid season...no doubt. -
Lets just worry about that in January if that happens.
-
Well, I am going to Florida 12/13 - 12/20. So something big is nearly assured in that time frame.
-
The BOM model takes it weakly into phase 7 before it dies out
-

November 2025 general discussions and probable topic derailings ...
CoastalWx replied to Typhoon Tip's topic in New England
Classic October November tornado season on the south coast lol -
Central PA Fall Discussions and Obs
pawatch replied to ChescoWx's topic in Upstate New York/Pennsylvania
Low of 30 degrees this morning. Heavy frost again. Temperatures around me is varying this morning. Montourville 42 degrees, Williamsport 36 degrees. -
November 2025 general discussions and probable topic derailings ...
CoastalWx replied to Typhoon Tip's topic in New England
HRR definitely had that look, but I don’t think nobody really care. -
I guess some people just looked at the -AO/-NAO part of Eric’s post and looked no further. He has some real ugly analog years in there….1988, 1999, 2011…. See:
-

November 2025 general discussions and probable topic derailings ...
dendrite replied to Typhoon Tip's topic in New England
Snowing up at First Lake. 33F at the COOP. -

November 2025 general discussions and probable topic derailings ...
512high replied to Typhoon Tip's topic in New England
.11" from the front last night, 46F, highest gust so far 21mph....meh -
 Lactose issues?
 -
The interesting thing is that JB's analogs show a warm December and a cold last 1/3 of winter. The CFSv2, which changes daily, shows the same thing this morning and has waffled between a cold Dec and Feb since I posted the above. I lean towards a cold start to December, but how long that cold lasts in December is up for grabs. The Euro weeklies, if they can be trusted during shoulder season, show a retrograding PNA/EPO ridge which (by the end of the run) is trying to get into the Aleutians. Looks like we have a window of about 1-2 weeks to start winter, and then TBD.
-

November 2025 general discussions and probable topic derailings ...
WinterWolf replied to Typhoon Tip's topic in New England
Good for those that got some action…just a little light rain here last night, but I’m fine with that…all drying up now, and can keep the truck clean for a while longer. -

Central PA Fall Discussions and Obs
Mount Joy Snowman replied to ChescoWx's topic in Upstate New York/Pennsylvania
Low of 46. Solid days ahead. -
 Yeah no one had or mentioned chances of thunder, hail, win damage or Tors. No one no model
 -
Fox are there as well. Deer have been spotted on the North Shore Tower golf course.
-

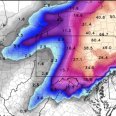
Fall/Winter Banter - Football, Basketball, Snowball?
John1122 replied to John1122's topic in Tennessee Valley
Clown map season is beginning. Hopefully all our winter regulars are able to come out again this year. @Holston_River_Rambler @PowellVolz @Stovepipe @Reb @TellicoWx @Silas Lang @tnweathernut @bearman @bearman @BlunderStorm @AMZ8990 @BNAwx @Coach B @fountainguy97 @Greyhound @kvskelton @Knoxtron @Kentucky @Uncle Nasty @Vol Man @Wurbus @Wintersnow888 @8283 El Nino Baby @BuCoVaWx @Chattownsnow @Scottie16 @Shocker0 @McMinnWx @WinterWonderland @Kasper I'm sure I missed some of you, and some not mentioned are around already. -
From 2019 to 2025 with the lack of benchmark storm tracks ISP has only averaged 1.9” more than NYC with record 7 year lows for both sites with 16.8”and 14.9”. Since neither site does well with Great Lakes cutters, I-78 huggers, and suppressed Southern Stream storm tracks. During 2010 to 2019 ISP averaged 8.5” more than NYC since it was closer to all the benchmark storm tracks. It was the only 9 year period that ISP averaged near 50” a season. It was the golden age for benchmark KU storm tracks. From 1994 to 2009 ISP and NYC were also more evenly balanced around 28.0” a year since it was colder and we still had a good amount of benchmark storm tracks in the mix. During the colder era from 1964 to 1993, ISP averaged 25.8” a year vs 23.0” in NYC. So both ISP and NYC could average over 20” a year without having to exclusively rely on benchmark KU tracks. It was cold enough for hugger tracks to drop more on the front end before mixing or changeover. Plus we got more clippers dropping south of the area which have been lacking since then. Since 1993-1994 both ISP and NYC haven’t had over 20” without at least one benchmark KU snowstorm. Prior to 1993-1994 in the much colder climate we could get closer to average without a KU. Monthly Total Snowfall for ISLIP-LI MACARTHUR AP, NY Click column heading to sort ascending, click again to sort descending. Mean T 0.6 2.1 6.0 7.1 1.0 T 16.8 2024-2025 0.0 0.0 2.1 2.7 6.9 0.0 0.0 11.7 2023-2024 0.0 T T 3.1 7.8 0.0 0.0 10.9 2022-2023 0.0 0.0 0.4 T 3.0 1.6 0.0 5.0 2021-2022 0.0 T 0.3 31.8 3.3 1.6 0.0 37.0 2020-2021 T 0.0 7.5 1.1 24.9 T T 33.5 2019-2020 0.0 0.1 4.2 2.5 0.0 T T 6.8 2018-2019 0.0 4.3 T 0.9 3.5 4.1 T 12.8 Monthly Total Snowfall for NY CITY CENTRAL PARK, NY Click column heading to sort ascending, click again to sort descending. Mean 0.0 0.9 2.3 3.7 6.4 1.6 T 14.9 2024-2025 0.0 0.0 2.8 3.0 7.1 0.0 0.0 12.9 2023-2024 0.0 T T 2.3 5.2 T 0.0 7.5 2022-2023 0.0 0.0 T T 2.2 0.1 0.0 2.3 2021-2022 0.0 T 0.2 15.3 2.0 0.4 0.0 17.9 2020-2021 0.0 0.0 10.5 2.1 26.0 T 0.0 38.6 2019-2020 0.0 0.0 2.5 2.3 T T T 4.8 2018-2019 0.0 6.4 T 1.1 2.6 10.4 0.0 20.5 Monthly Total Snowfall for ISLIP-LI MACARTHUR AP, NY Click column heading to sort ascending, click again to sort descending. Mean 0.0 0.5 6.5 18.2 13.9 8.6 0.6 48.3 2017-2018 0.0 T 6.0 22.0 1.4 31.9 4.6 65.9 2016-2017 T T 3.2 14.0 14.7 7.4 T 39.3 2015-2016 0.0 0.0 T 24.8 13.2 3.2 0.2 41.4 2014-2015 0.0 T 0.4 30.2 13.4 19.7 0.0 63.7 2013-2014 0.0 0.3 8.1 25.2 24.5 5.4 0.2 63.7 2012-2013 0.0 4.2 0.6 3.3 31.4 7.4 0.0 46.9 2011-2012 0.3 0.0 T 3.8 0.6 T 0.0 4.7 2010-2011 0.0 T 14.9 34.4 3.9 2.1 T 55.3 2009-2010 0.0 0.0 25.3 6.4 21.7 0.4 0.0 53.8 Monthly Total Snowfall for NY CITY CENTRAL PARK, NY Click column heading to sort ascending, click again to sort descending. Mean 0.3 0.5 5.9 14.2 12.8 5.5 0.6 39.8 2017-2018 0.0 T 7.7 11.2 4.9 11.6 5.5 40.9 2016-2017 0.0 T 3.2 7.9 9.4 9.7 0.0 30.2 2015-2016 0.0 0.0 T 27.9 4.0 0.9 T 32.8 2014-2015 0.0 0.2 1.0 16.9 13.6 18.6 0.0 50.3 2013-2014 0.0 T 8.6 19.7 29.0 0.1 T 57.4 2012-2013 0.0 4.7 0.4 1.5 12.2 7.3 0.0 26.1 2011-2012 2.9 0.0 0.0 4.3 0.2 0.0 0.0 7.4 2010-2011 0.0 T 20.1 36.0 4.8 1.0 T 61.9 2009-2010 0.0 0.0 12.4 2.1 36.9 T 0.0 51.4 Monthly Total Snowfall for ISLIP-LI MACARTHUR AP, NY Click column heading to sort ascending, click again to sort descending. Mean T 0.3 5.8 7.1 8.7 5.3 1.0 28.3 2008-2009 0.0 T 10.4 8.9 3.3 13.6 T 36.2 2007-2008 0.0 0.0 2.6 0.8 7.3 T 0.0 10.7 2006-2007 0.0 T 0.0 1.0 4.2 3.8 T 9.0 2005-2006 0.0 0.5 7.6 4.7 19.9 3.2 0.1 36.0 2004-2005 0.0 T 7.0 21.5 17.0 13.3 0.0 58.8 2003-2004 0.0 0.0 15.5 19.1 1.1 5.7 0.0 41.4 2002-2003 0.0 1.0 16.0 2.6 26.3 3.7 5.0 54.6 2001-2002 0.0 0.0 0.0 3.7 T T 0.0 3.7 2000-2001 T 0.0 10.8 9.2 8.6 10.3 T 38.9 1999-2000 0.0 T 0.4 5.8 2.6 0.2 T 9.0 1998-1999 0.0 0.0 3.0 4.5 2.8 9.1 T 19.4 1997-1998 0.0 T 1.0 T T 1.6 T 2.6 1996-1997 0.0 T 1.2 3.3 2.2 3.7 2.0 12.4 1995-1996 0.0 3.0 13.3 20.2 19.0 12.0 9.6 77.1 1994-1995 0.0 T T T 5.1 T 0.0 5.1 1993-1994 0.0 T 3.3 8.8 20.0 5.0 0.0 37.1 Monthly Total Snowfall for NY CITY CENTRAL PARK, NY Click column heading to sort ascending, click again to sort descending. Mean T 0.2 5.4 7.5 10.4 4.2 0.4 28.0 2008-2009 0.0 T 6.0 9.0 4.3 8.3 T 27.6 2007-2008 0.0 T 2.9 T 9.0 T 0.0 11.9 2006-2007 0.0 0.0 0.0 2.6 3.8 6.0 T 12.4 2005-2006 0.0 T 9.7 2.0 26.9 1.3 0.1 40.0 2004-2005 0.0 T 3.0 15.3 15.8 6.9 0.0 41.0 2003-2004 0.0 0.0 19.8 17.3 0.7 4.8 0.0 42.6 2002-2003 T T 11.0 4.7 26.1 3.5 4.0 49.3 2001-2002 0.0 0.0 T 3.5 T T T 3.5 2000-2001 T 0.0 13.4 8.3 9.5 3.8 0.0 35.0 1999-2000 0.0 0.0 T 9.5 5.2 0.4 1.2 16.3 1998-1999 0.0 0.0 2.0 4.5 1.7 4.5 0.0 12.7 1997-1998 0.0 T T 0.5 0.0 5.0 0.0 5.5 1996-1997 0.0 0.1 T 4.4 3.8 1.7 T 10.0 1995-1996 0.0 2.9 11.5 26.1 21.2 13.2 0.7 75.6 1994-1995 0.0 T T 0.2 11.6 T T 11.8 1993-1994 0.0 T 6.9 12.0 26.4 8.1 0.0 53.4
-
 Had some rumbles last night.