All Activity
- Past hour
-

E PA/NJ/DE Summer 2026 Obs/Discussion
Eskimo Joe replied to PhiEaglesfan712's topic in Philadelphia Region
-
True but I'll take the florida climo over the dry death ridge
-
Several mesonet site creeping into the upper 90s my money is on Goldsboro and Federalsburg going gangbusters on the eastern shore.
-
93° with a heat index of 110° according to my tempest. Today feels like the day I finally crack 100°...hit 99.9° a bunch yesterday but never got over the hump. Also just saw that Leesburg canceled the 4th of July parade tomorrow because of the heat. We go every year, so it's a real bummer, but I get it.
-
94/70. Crazy how a 70 degree dew point can feel so dry.
-
 you’re concerned about fireworks smoke? lololol
 -

E PA/NJ/DE Summer 2026 Obs/Discussion
LVblizzard replied to PhiEaglesfan712's topic in Philadelphia Region
Looks like a much more comfortable pattern setting up for next week and beyond. I could see us hitting 90 again next Thursday (with maybe a decent severe wx chance) but every other day for the next week or two should stay near or below normal. Most guidance is adamant that the ridge will shift towards the plains/Rockies after this week and not really budge for awhile. -
HI of 108 at bwi at 1055. Woof.
-

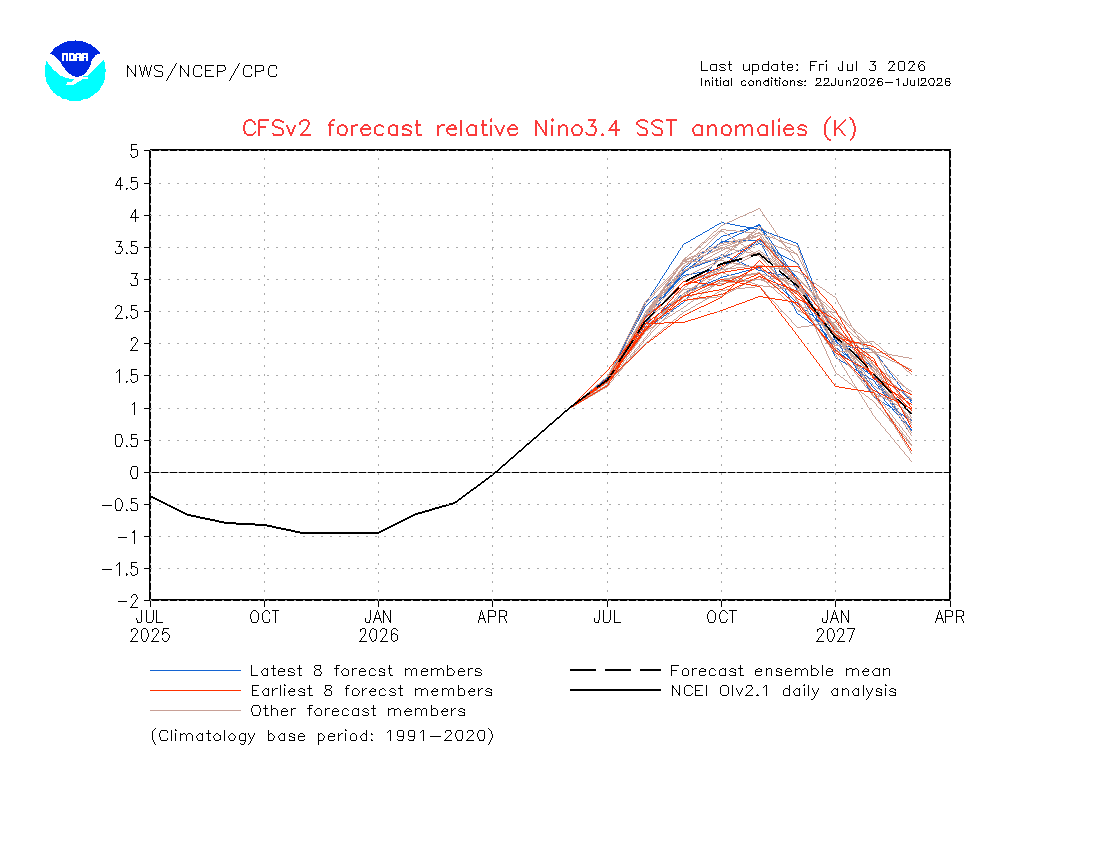
2026-2027 Super El Nino
GaWx replied to Stormchaserchuck1's topic in Weather Forecasting and Discussion
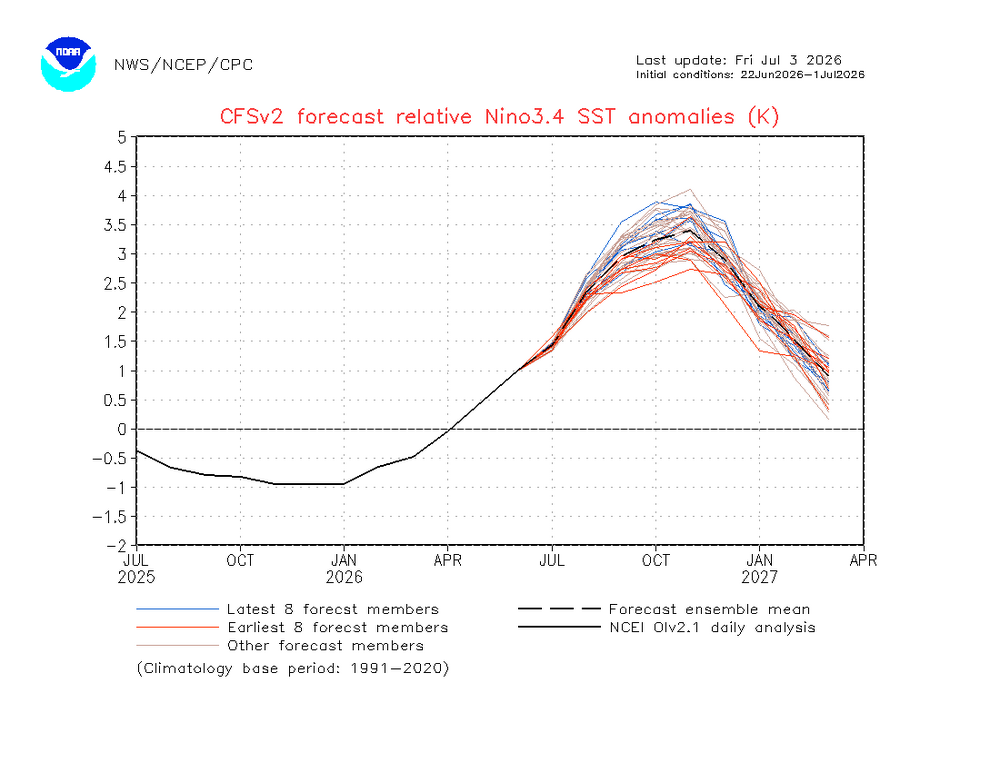
CFS 10 day mean relative prog is at a new record high prog for its Nov peak in 3.4: SON/OND peak +3.2 vs +3.1 earlier vs +2.5 record (1982): N peak +3.4 vs +3.3 earlier vs +2.7 record (1982):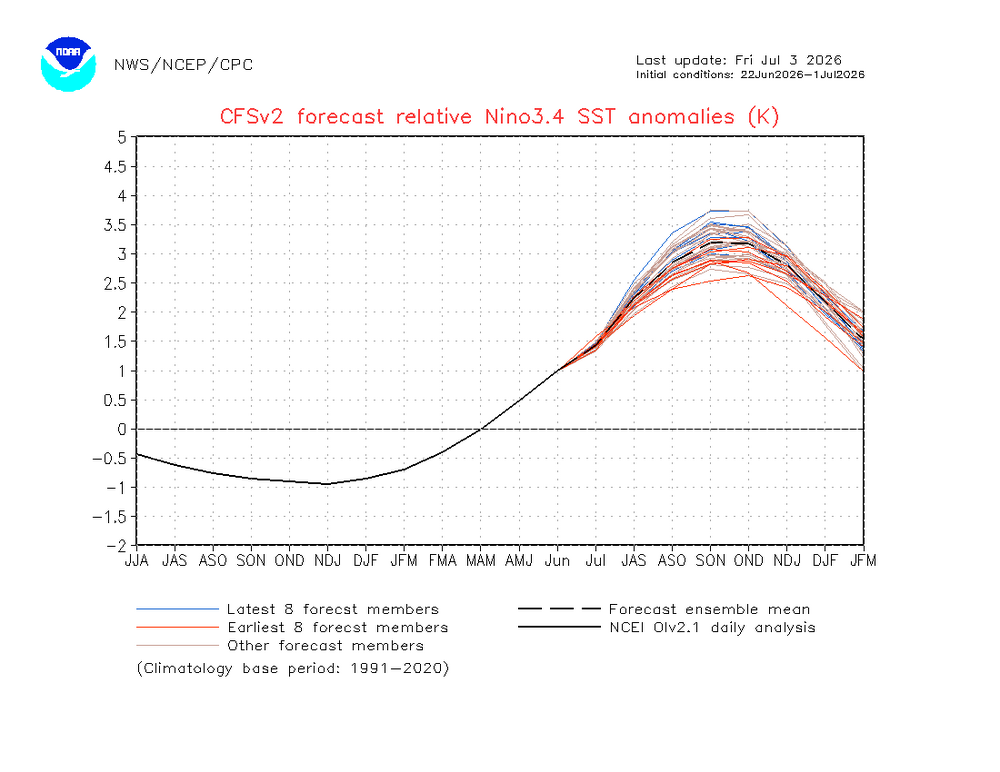
-
Wilmington, DE is 97/75 as of 11 am.
-
 If that 87 is EWR it's their new record. 7/22/2011 was 108/86. (A Phoenix day, but with humidity.) Storms slid to my south, 3-for-3 the past 3 nights. Didn't even see any "heat lightning" (a term I've used since the 1950s for flashes from too far away to be heard. Sorry, LR). The SFD from GYX talked about storms/rain/troughs but their forecast for 04955 doesn't include a single drop thru next Thursday.
 -
 MHT 92/64 and NW 20G27mph Definitely better mixing today
 -
Ok, I had enough of this. 97 at 11 AM Current conditions at Wilmington Airport (KILG) Lat: 39.67°NLon: 75.61°WElev: 72ft. Fair 97°F 36°C Humidity 49% Wind Speed NA Barometer 30.02 in (1016.5 mb) Dewpoint 75°F (24°C) Visibility 10.00 mi Heat Index 109°F (43°C) Last update 3 Jul 10:51 am EDT
-

Central PA Summer 2026 Discussion/Obs Thread
Blizzard of 93 replied to Voyager's topic in Upstate New York/Pennsylvania
There is a slight occasional breeze, which is helping a small bit in partially shaded areas. -
Was 85 when I left the house @5:00 this morning for work
-
96/77 HI 112
-
Despite the higher air temps, it feels significantly nicer today compared to yesterday. Can really tell it's less humid.
-
 92
92 -
PSA: DO NOT GO OUTSIDE.
-
Feels like a severe thunderstorm day.
-

Central PA Summer 2026 Discussion/Obs Thread
canderson replied to Voyager's topic in Upstate New York/Pennsylvania
95 at 10:50 a.m. My humidity sensor is broken but it feels dangerous out. -
We need rain.
-

Central PA Summer 2026 Discussion/Obs Thread
CarlislePaWx replied to Voyager's topic in Upstate New York/Pennsylvania
Yesterday afternoon around 2:30 I was driving up 81 to 83 to Union Deposit for a doctor appointment. On the way up my car thermo was fluctuating between 103 and 104. As if that weren't stunning enough, about an hour later heading back to Carlisle via the same route, the thermo had reached 106 degrees! It read that when I got in the car to leave and then fluctuated between 105 and 106 until just before the MIddlesex exit when it read 104 for almost the remainder of my trip home When I arrived back home around 4:00pm my backyard temp read 100.6 and then proceeded to peak at 102.0 degrees. This reading is the highest reading I've recorded in the Carlisle area since moving here in 2000 (almost 26 years ago next month). My high on Thursday was 100.4 degrees. Currently, at 10:51am the temperature is 94.5 degrees with a dew point of 79.0 and a heat index of 112.0. This is a higher dew point than recorded yesterday. I'm wondering if I'll break 102 and or a heat index of 120? Peak heat index Wednesday was 119.5. My low this morning was 76.1 while yesterday morning's low was 73.6 degrees. -
E PA/NJ/DE Summer 2026 Obs/Discussion
GaWx replied to PhiEaglesfan712's topic in Philadelphia Region
As of 10AM, Philly is 4F warmer than 24 hours ago (94 vs 90)! -
97 in Crofton. 100 by noon?


.thumb.jpeg.f5c6ba9d911ec96b3b124f8606aee58e.jpeg)