All Activity
- Past hour
-
Damp with in and off showers and clouds. A banner day indeed, as some wanted us to believe
-
but that doesn't explain that huge spike during the 30s, 40s and 50s and then we dipped during the 60s, 70s and 80s when the equipment was still properly sited.
-
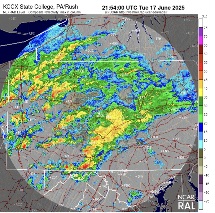
Tornado warning just across MD line in Beford County PA
-
The volcano eruption will save us
-
Waste of a day here
-
If NWS is correct for Monday and Tuesday, we’d be flirting with record highs both days. They’re forecasting 94 both days, records are 95 and 96.
-
Made up for lost time .
-
So do you think we've permanently lost the 1996/2003/2016 level storms?
-
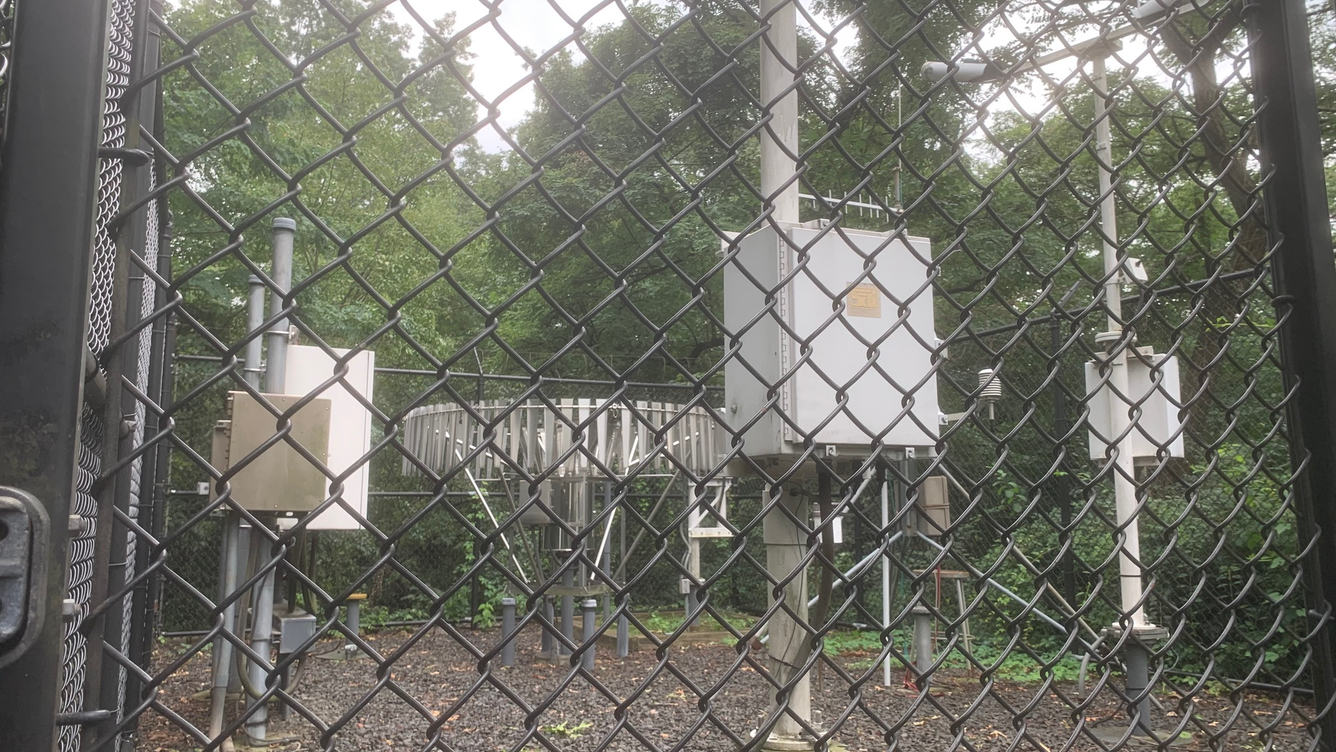
The leaves make a big difference, once full leaf-out occurs, Central Park diverges from the other area stations. Yes we're more moist, average dewpoints have been steadily rising. But the overgrowth at the park shows its effects every late spring when the canopy is fully out and complete.
-
The good The Bad And the to be continued.
-
It also left out the huge spike during the 1930s-1950s period
-
Ok Strange. Dont get to down on yourself . Your feelings about the weather are justifiable.
-
that is not an intellectually correct argument. The air became more moist in the 2010s…significantly so. That is the reason why we’ve had a significant decline in triple digit heat, but our overnight lows are much warmer. You are an intelligent person. You do yourself a disservice when you’re trying to push a narrative all the time. It’s getting warmer and we know that, but it’s also getting more moist hence the decline in the daytime highs and the significantly warmer nighttime lows. A few leaves in CPK doesnt mean much.
-
0.7" from this morning (though that's probably inflated by the hail), but just some drips since then. Both rounds of afternoon storms missed me.
-
What kind of work did you used to do?
-
Yes this is why our summer heat hasn't been as extreme as it was during the 1930s-1950s and during the 1990s either.
-
I know but the number of 100 degree days from the 1930s through the 1950s and the number of years with 100 degree days is far in excess of anything we had before or since so that is probably cyclical, I wonder when we will see a return to that kind of heat again?
-
The decline of NYC 100° temperatures since the ASOS was installed under the trees in 1995 is all about the incorrect sitting and not about cycles. 2021 1921

-
They should have done a tally by decade, so I'll try to do that myself. Number of 100+ days per decade / number of years with 100+ days per decade 1880s : 1 / 1 1890s : 1 / 1 1900s : 2 / 1 1910s : 3 / 3 1920s : 2 / 2 1930s : 8 / 5 1940s : 8 / 3 1950s : 12 / 5 1960s : 4 / 1 1970s : 3 / 1 1980s : 2 / 1 1990s : 8 / 4 2000s : 1 / 1 2010s : 5 / 3 Doing this tally I'm a little shocked how many 100 degree days had between the 1930s and the 1950s and despite the enormous exception of 1966 which had 4 of them (the only 4 of that entire decade!) a big downturn in 100+ degree days began during the 1960s which only spiked again in the 1990s before resuming the downward trend. The early 2010s were an exception of course. There is obviously something cyclical going on here. No other way to explain what happened during the 1930s-1950s period. And how quiet it was both before and after that. And look at how both the 1930s and the 1950s had half of their years (5) hitting 100+ -- that has never been matched either!
-
eh to be fair Chris, 50% more is somewhat more than slight (9 to 6) 1993 had slightly more than 1949 did though (9 to 8)
-
and 1949 somehow had 8 in EWR and 5 99+ days at NYC, wow
-
For totals on 100° days 1993 had a slight edge on 2022. Data for January 1, 1993 through December 31, 1993 days reaching 100° Click column heading to sort ascending, click again to sort descending. NEWARK LIBERTY INTL AP WBAN 9 Newark Area ThreadEx 9 WAYNE COOP 5 LODI COOP 4 BELLEPLAIN STA FOREST COOP 3 TUCKERTON 2 NE COOP 3 WOODSTOWN PITTSGROV 4E COOP 3 INDIAN MILLS 2 W COOP 3 TOMS RIVER COOP 3 EWING 3 WNW COOP 3 TETERBORO AIRPORT WBAN 3 Trenton Area ThreadEx 3 Data for January 1, 2022 through December 31, 2022 days reaching 100° Click column heading to sort ascending, click again to sort descending. NEWARK LIBERTY INTL AP WBAN 6 Newark Area ThreadEx 6 FREEHOLD-MARLBORO COOP 5 SOMERSET AIRPORT WBAN 5 CANOE BROOK COOP 4 HARRISON COOP 4 SOUTH JERSEY REGIONAL AIRPORT WBAN 3
-
Warmer air will move into the region for tomorrow. The temperature will apporach or reach 80° in New York City. This week's warmth will peak on Thursday with temperatures reaching the upper 80s across the region. A few areas could reach or exceed 90°. The arrival of this warmth will mark the start of a sustained period of above normal temperatures. No exceptional heat appears likely through the first three weeks of June. However, that will likely change shortly afterward. Excessive heat is possible starting early next week. The magnitude of the heat remains to be resolved among the guidance. The ENSO Region 1+2 anomaly was +0.5°C and the Region 3.4 anomaly was 0.0°C for the week centered around June 11. For the past six weeks, the ENSO Region 1+2 anomaly has averaged +0.30°C and the ENSO Region 3.4 anomaly has averaged -0.05°C. Neutral ENSO conditions will likely continue through at least late summer. The SOI was -7.94 yesterday. The preliminary Arctic Oscillation (AO) was +1.216 today. Based on sensitivity analysis applied to the latest guidance, there is an implied 77% probability that New York City will have a warmer than normal June (1991-2020 normal). June will likely finish with a mean temperature near 73.7° (1.7° above normal).
- Today
-
Don't expect it.
-
Meso guidance all has been suggesting any rain or storms we get is after 0z. Marine wedge hangs tougher in June than it does in freaking February…


.thumb.jpg.6a4895b2a43f87359e4e7d04a6fa0d14.jpg)