All Activity
- Past hour
-
Last cold pisser for a while
-

Central PA Spring 2026 Discussion/Obs Thread
Jns2183 replied to Voyager's topic in Upstate New York/Pennsylvania
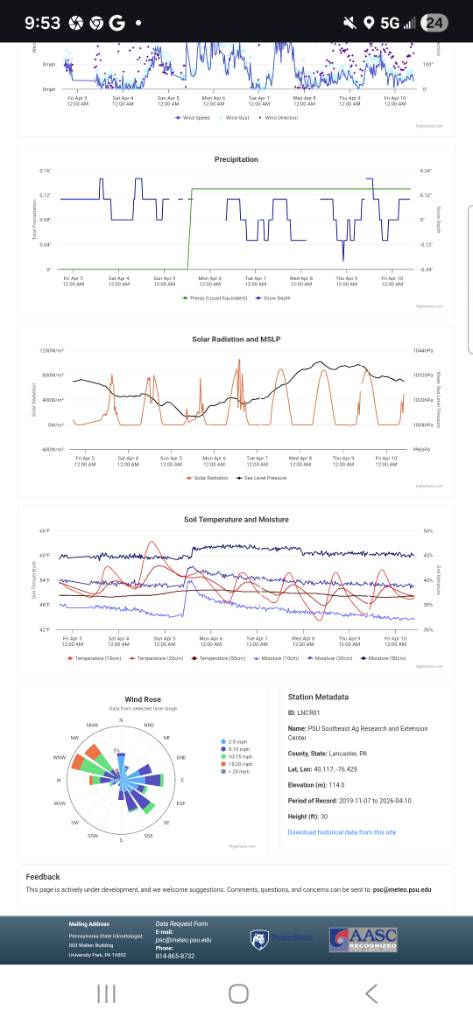
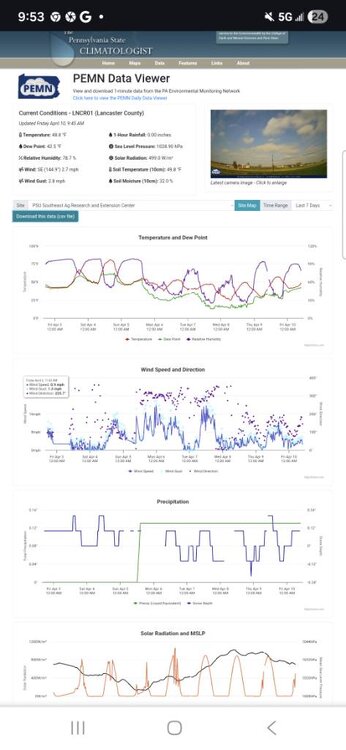
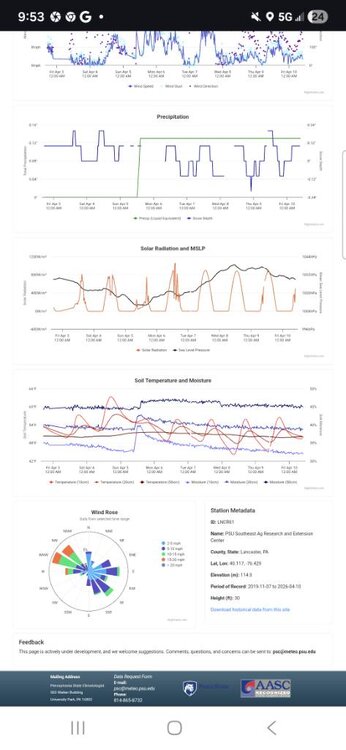
Those stations I posted about from PEMN have soil moisture and temperature at 3 depths Plant Available Water. 10\text{cm}: Moisture for your Lawn. (Currently in a deficit/drying phase). 20\text{cm}: Moisture for your Shrubs and Garden. (Currently stable, near baseline). 50\text{cm}: Moisture for your Trees. (Currently very healthy and high). Watch moisture after it rains and during dry spells. They signal everything The rain past Sunday never even with dent on the deeper sensors. The upper sensor we already are below where we were on Sunday. Sent from my SM-S731U using Tapatalk -
hehhhhh I would encourage using larger hemispheric basis for determining back door potential in this case. I realize the modeling consensus - for now - is putting a Euro like solution as an outlier, but I really argue that a Euro like solution has a ton of support from both that larger synoptic perspective, but also in in the season trend. We've been dealing with a PV anomaly of varying strength.... averaging near 100 or 90 W by 60 N, for months. In all models, Euro combined, that still there out to 300+ hrs. That has been at times mirrored across the conterminous by warm heights S of ~40N. Larger gradient results. The flow between physically/necessarily faster than normal at mid and upper levels. Moving a stream of air faster than normal from Lake Superior -ish to the Maritime of Canada, is a very BD prone mean. That why we've seen a buck shot of BD's ... so it seems. I can't say this for sure, but it "seems" to me that we are above normal incidences therein, relative to date. I don't know if there is any climatology for numbers of BD, per date. So this is largely conjecture on my part. Be whatever that may be, I just base it on anecdotal accounting having suffered the vicissitudes of New England springs for that past 45 years of my life jesus. Anyway, being a bit flowering with rhetoric here but I think there's enough precedence both in spring climo, seasonal trend in play, and synoptic observable construct at large scales, not to be overly confident next week.
-

2026-2027 El Nino
40/70 Benchmark replied to Stormchaserchuck1's topic in Weather Forecasting and Discussion
This is a warmer version of the 1950s and 1980s, though hemispherically speaking, it's more akin to the 1950s...so instead of 19.9" or 19.7, NYC has averaged 18.2 this decade. o -
Looks like the rivers along the shore are going to be roaring next week. Gooseberry Falls should be a cool site to visit.

-
April 10 1977: A record high of 86 is set at Redwood Falls. For Friday, April 10, 2026 1894 - A heavy late season snow blanketed parts of the northeastern U.S. Heavier snowfall totals included 31.5 inches at Salem Corners PA, 30 inches at LeRoy NY, 26 inches at York PA, 14 inches at Waterbury CT, and 9 inches at Providence RI. (The Weather Channel) 1935 - Severe dust storms across Iowa and Kansas closed schools and highways. Dodge City KS experienced its worst dust storm of record, with dense dust reported from the morning of the 9th until after sunset on the 11th. The sky was almost as dark as night at times during the daylight hours. The thick dust suspended traffic on highways and railroads, and also suspended most business in town. (The Weather Channel) 1979 - A massive tornado smashed into Wichita Falls, TX, killing 43 persons and causing 300 million dollars damage. Another tornado struck Vernon TX killing eleven persons. (David Ludlum) (Storm Data) 1987 - Blustery northwest winds prevailed across the Northern Plains Region. Winds in Wyoming gusted to 65 mph. Temperatures in North Dakota were only in the 20s and 30s, following afternoon highs in the 70s the previous day. (The National Weather Summary) 1988 - Unseasonably warm weather prevailed in the western U.S. Eleven cities reported new record high temperatures for the date, including Bakersfield CA with a reading of 95 degrees, their warmest for so early in the season. Pocatello ID warmed from a record low of 19 above to an afternoon high of 63 degrees. (The National Weather Summary) 1989 - Strong northerly winds, gusting to 53 mph at Albuquerque, NM, ushered cold arctic air into the south central U.S. The temperature at Albuquerque plunged from 82 degrees to 29 degrees overnight. Thirty-three cities in the central U.S. reported record low temperatures for the date, including Goodland KS with a reading of 4 degrees above zero. (The National Weather Summary) 1990 - Thunderstorms produced severe weather from the Central Gulf Coast Region to western sections of the Carolinas during the afternoon and evening. Evening thunderstorms over western South Carolina produced wind gusts to 98 mph which injured four persons at Holly Springs, and wind gusts to 100 mph which injured one person and caused half a million dollars damage north of Dacusville. (The National Weather Summary) (Storm Data) 2005 - Heavy snow affected the Colorado Rockies during April 10-11, as up to 30 inches of snow affected the mountains around Denver. In the Denver metro area, 10-15 inches of snow accumulated.
-
2026-2027 El Nino
40/70 Benchmark replied to Stormchaserchuck1's topic in Weather Forecasting and Discussion
I was, but appreciated his thoughtful response, anyway. -
People making calls for this winter this early is ridiculous. Look how winter forecasts from months in advance have turned out in recent years.
-
Central PA Spring 2026 Discussion/Obs Thread
Jns2183 replied to Voyager's topic in Upstate New York/Pennsylvania
If people are not aware I wanted to let them know about the PEMN Network Penn state's putting a lot of places that are rural. We're talking about many thousands of dollar professional stations that put out excellent one minute data that can be seen in real time. If you go to the Pennsylvania climate website and look for PEMN viewer Sent from my SM-S731U using Tapatalk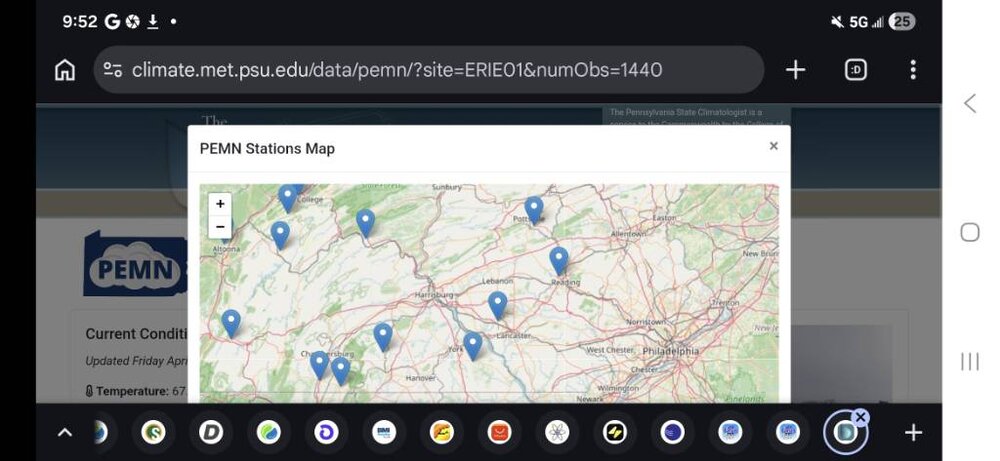
-

2026-2027 El Nino
michsnowfreak replied to Stormchaserchuck1's topic in Weather Forecasting and Discussion
I read it. It just seems like a weird way to word it. "as things stand right now worst case...". Thats like saying day 14 on the GFS looks stormy so as things stand right now, best case we get showers, worst case it floods. And then when day 14 becomes day 0 and its dry, cant say you misspoke, but it wasnt anything close the expected scenarios 2 weeks earlier. -
Very weak signals outside of Maine and the cape.
-
2026-2027 El Nino
michsnowfreak replied to Stormchaserchuck1's topic in Weather Forecasting and Discussion
The desert SW is obviously the fastest warming region and we see it year in and year out. Its going to continue to warm the conus mean no matter what happens elsewhere. A cold winter in the east (in fact, DCs coldest winter in 30 years) and all we hear on an east-heavy forum is "conus conus conus". Well, the conus mean temp rising really doesnt mean a damn to people who live in the north and get frozen or buried in the winter. Many northern cities temp rise from 1896-2026 is 0F to +3F, yet the desert SW, Tuscon is +4.9F and Phoenix is +6.5F. What a marvelous idea to urbanize a desert. -
Maybe I'm being dense and he was being sarcastic... but I'd think you'd want to see a longer period of record to compare to. But if 1950 onward are random dates and then change it to a not random 1995-2025, maybe I'm just missing something. I always thought we liked long period of records on here.
-

2026-2027 El Nino
Great Snow 1717 replied to Stormchaserchuck1's topic in Weather Forecasting and Discussion
Did you miss or simply ignore the .."as things stand right now"....part of my post?, Keep in mind the weather records that are available are a mere blip on the radar screen..there is no way of knowing how many super Ninos have actually occurred because weather records arent available beyond a certain point. -
LOL @ Jeff,you know i was thinking the same thing a couple days ago,that damn MS River,but its the SER like you said,convection into our parts stops west of the River,im still kinda surprised a good chunk of ARK is worse off than we are in TN with the drought Nothing eye popping the next week,some parts should flirt with record temps upcoming the next few days. But there is light at the end of the tunnel,a pattern change is upcoming seemingly ATM The MJO should strenghten into the WH as it looks like Rossby/Kelvin waves interact with each other to strenghten the MJO signal sorta speaking as it heads into Africa
-
I don't think there is anything wrong with using a shorter period or using a longer period, but like I stated the user and readers just need to be aware and any conclusions being drawn need to factor this in. Quite a bit of information can be gained using both. Comparing to a shorter period and a longer period, you are more likely to see areas of higher anomalous values and when compared to the longer mean, you can get a sense of where "change" may be occurring more rapidly.
-
It wouldn't
-
https://abc11.com/post/drought-places-strain-central-north-carolina-farmers-rural-communities/18862407/ This video was taken from the farm adjoining ours in Franklin county and that is our farmer in the video.
-
(002).thumb.png.6e3d9d46bca5fe41aab7a74871dd8af8.png) So show us the exactly which "other stations" you are referencing that were used for the calculation? You say Coatesville 1SW results/raw vs the NCEI adjusted figures above for Coatesville 1SW don't provide evidence about the adjustments. Agreed that is what I am looking for evidence and the underlying calculation based on the "other stations" you reference so we can tie down those annual adjustments from the raw to the adjusted/altered figures. Those adjustments above are unique to the Coatesville 1SW station so show us the reference stations used to make the call to adjust lower than Morgantown and in many cases lower than any reporting station at all in Chester County. You never show any of that data...you simply keep saying just believe that NCEI "could be right"
So show us the exactly which "other stations" you are referencing that were used for the calculation? You say Coatesville 1SW results/raw vs the NCEI adjusted figures above for Coatesville 1SW don't provide evidence about the adjustments. Agreed that is what I am looking for evidence and the underlying calculation based on the "other stations" you reference so we can tie down those annual adjustments from the raw to the adjusted/altered figures. Those adjustments above are unique to the Coatesville 1SW station so show us the reference stations used to make the call to adjust lower than Morgantown and in many cases lower than any reporting station at all in Chester County. You never show any of that data...you simply keep saying just believe that NCEI "could be right" -
Why would that be better than going from 1950 onward like Tip’s original post?
-
Point click has 92-93 here midweek
-
Growing up in NNJ I saw exactly one tick, probably in 1971, definitely a dog tick. Began seeing dog ticks in Maine mid-1990s; one western Maine excursion (Lovell, Denmark) in June 1996 I picked 24 off my clothes/skin and brushed a dozen-plus from the pants - 100% dog ticks. Deer ticks began appearing about 10 years later, and my personal "best" is 26 on a state lot near Merrymeeting Bay in Topsham, late October 2019, 100% deer ticks. I was flipping ticks out the window onto I-295 going back to AUG, found the final 3 (tiny nymphs) at home that evening. Haven't seen any yet this year but will likely bag a couple the next time I walk thru our woodlot. I pick them up mostly May-June and Oct-Nov. For reasons unknown to me, the horrible little beasts seem to disappear in late summer here. In mid-August of 2019, our annual two-day peer-review field trip had 40+ attendees visiting Newcastle, Swan Island (huge deer herd there), Hebron and Skowhegan. Not a single tick was reported.
-
I don't think he was using anything incorrectly but you do do bring up a good point about data use. (The rest of this statement is speaking in generalized terms, not directed towards anyone here). Data use can be extremely fickle and sensitive, particularly when using reanalysis data. It's always important that 1) The user has a strong understanding of the strengths/weaknesses of the dataset and 2) If the user is presenting writing a paper, the user clearly state these strengths/weaknesses. There was a paper I was reading late last fall which was looking at the different versions of the ERSST dataset and I think comparing v6 versus v5 and a few previous versions and certain areas of the globe where there were noticeable discrepancies. And these discrepancies also had an impact on OLR anomalies and so forth. So its always important to understand strengths, weaknesses, limitations, etc. when dealing with datasets. I've really learned this the hard way doing so much with datasets and reanalysis from years as far back as 1900
-
2007-2016?