All Activity
- Past hour
-

2025-2026 ENSO
Stormchaserchuck1 replied to 40/70 Benchmark's topic in Weather Forecasting and Discussion
Looking hot in the Northeast for the hottest 2 weeks of the year, on average. 12z EPS -

July 2025 Obs/Disco ... possible historic month for heat
psv88 replied to Typhoon Tip's topic in New England
Headed to Newport (Goat Island) for a few days this month. My family loves Rhode Island. -

July 2025 Obs/Disco ... possible historic month for heat
ineedsnow replied to Typhoon Tip's topic in New England
-
July 2025 Obs/Disco ... possible historic month for heat
ineedsnow replied to Typhoon Tip's topic in New England
its beautiful out.. top 5 for July 4th.. Memorable -
July 2025 Discussion-OBS - seasonable summer variability
psv88 replied to wdrag's topic in New York City Metro
Perfect evening. Stunning -
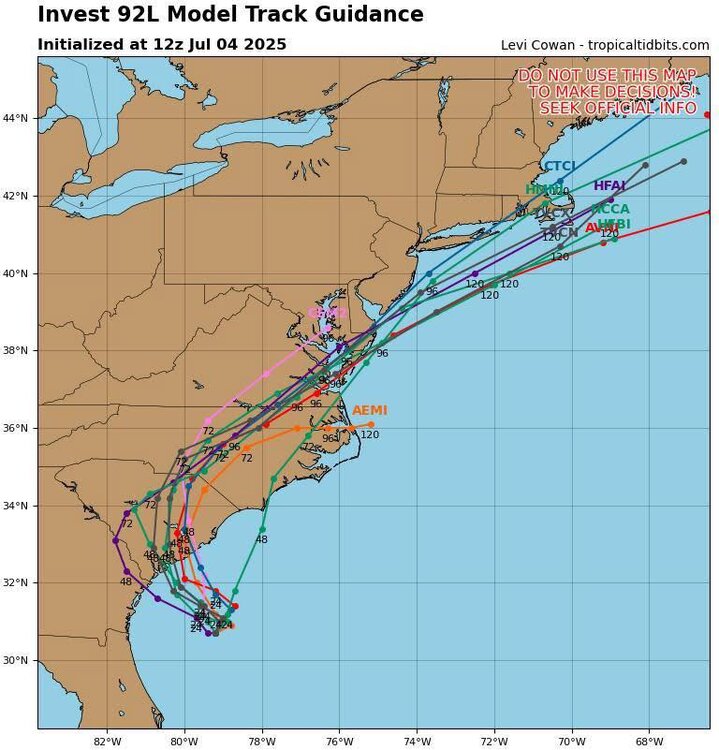
The NHC is close to the CMC........................................
-

July 2025 Obs/Disco ... possible historic month for heat
powderfreak replied to Typhoon Tip's topic in New England
Honestly not a bad thing when you aren’t getting eaten alive by bugs while trying to wait for fireworks outside. -

July 2025 Obs/Disco ... possible historic month for heat
dendrite replied to Typhoon Tip's topic in New England
102/70 is a nice comfy 36% RH too. -

July 2025 Obs/Disco ... possible historic month for heat
metagraphica replied to Typhoon Tip's topic in New England
Tomorrow and Sunday will be better. Doo do doo dew! -
Despite some including Grok AI insisting there’d need to be WAY more ocean floor vents than have been discovered for underwater seismic activity to significantly affect SSTs, the AGW denying JB today seems to ignore that per the the attached. He says he’s not aware of any possible explanation for the sharp cooling over the last year in much of the Atlantic other than a sharp reduction in mid ocean seismic activity: You Can't Explain this kind of Drop with Man Made forcing Wow. Look at the MDR drop off in Feb. Co2 does not explain that This might tho
-

July 2025 Obs/Disco ... possible historic month for heat
Damage In Tolland replied to Typhoon Tip's topic in New England
Sounds summery - Today
-
-

July 2025 Obs/Disco ... possible historic month for heat
Snowedin replied to Typhoon Tip's topic in New England
As much as I love the chill vibe that high dews and heat brings this time of year, I don’t mind a day like this. It’s very pleasant without a doubt, great for grilling and taking long walks on the beach. I think the heavy downpours yesterday really wrung out much of the moisture in the atmosphere. When it returns though and it will, our collective tooshies (and manbuns) shall be ready! -

July 2025 Discussion-OBS - seasonable summer variability
Roger Smith replied to wdrag's topic in New York City Metro
If there was no calendar and every 31-day interval was equally valid, these would be the top 50 warmest "months" for NYC ... just counting the warmest instance in any given year unless in theory two non-overlapping 31 day intervals qualified, 1988 and 2002 were the only examples (otherwise, they do not quite make list, the second instance in 1931 ranks 51st) ... a number of secondary peaks more than halfway through these qualifying spells do not count for ranking separately, there needs to be total separation of the intervals for ranking ... you could rank more if you accepted two sets that don't include the actual peak ... it's pretty similar to the list of warmest calendar months but the averages are generally higher and it's interesting that no annual peak happens to coincide with a calendar month. I list them by mean maximum to reduce the interference of the growing heat island, mean daily would be skewed more to recent examples. Rank Year __ Interval (31d) _________ Mean max (F) 1. 1966 June 20 to July 20 ___________91.97 2. 1993 July 5 to Aug 4 ______________91.61 3. 1999 July 3 or 4 to Aug 2 or 3 ____ 90.94 4. 1955 July 8 to Aug 7 ______________ 90.90 5. 1944 July 22 to Aug 21 ___________ 90.84 6. 1980 July 14 to Aug 13 ____________ 90.71 t7. 1988A July 16 to Aug 15 ___________ 90.29 t7. 2010 June 27 to July 27 __________ 90.29 (or July 3 to Aug 2 was also 90.29) 9. 2005 July 15 to Aug 14 ___________ 89.87 10. 2011 July 4 to Aug 3 _____________ 89.84 11. 1983 July 11 to Aug 10 ____________ 89.71 12. 1952 June 24 to July 24 _________ 89.35 t13. 1977 July 13 to Aug 12 ___________ 89.29 t13. 1995 July 13 to Aug 12 ___________ 89.29 t15. 1876 June 23 to July 23 __________ 89.26 t15. 1991 June 24 to July 24 __________ 89.26 t15. 2006 July 11 to Aug 10 ____________89.26 18. 1949 July 13 to Aug 12 ____________ 89.13 __ a non-overlapping 31d interval June 11 to July 11 was 86.74 19. 1953 June 20 to July 20 __________ 88.90 __ non-overlapping 31d intervals Aug 8 (or 10) to Sep 7 (or 9) 87.00 20. 2002 Jul 20 or 22 to Aug 19 or 21_ 88.87 __ non-overlapping 31d interval June 20 or 21 to July 20 or 21 was 87.10 21. 2022 July 12 to Aug 11 ____________ 88.77 (also 87.19 Aug 2 to Sep 1, partial overlap, secondary peak) 22. 1943 July 11 to Aug 10 ____________ 88.42 23. 2012 Jun 27 or 28 to Jul 27 or 28_ 88.32 24. 2024 June 18 to July 18 __________ 88.23 (also 88.19 July 4 to Aug 3, partial overlap, secondary peak) t25. 1979 July 11 to Aug 10_____________88.19 t25. 2015 July 19 to Aug 18____________88.19 (also 87.87 Aug 10 to Sep 9, partial overlap, secondary peak) 27. 1994 June 14 to July 14 ___________ 88.16 (also 87.94 July 5 to Aug 4, partial overlap, secondary peak) 28. 1957 July 4 to Aug 3 ______________ 88.10 29. 2016 July 16 to Aug 15 ____________ 88.06 30. 2013 June 23 to July 23 __________ 87.97 31. 1959 Aug 10 to Sep 9 _____________ 87.87 t32. 1938 July 25 to Aug 24 ___________87.74 t32. 1939 July 24 to Aug 23 __________ 87.74 34. 2020 July 2 to Aug 1 _____________ 87.68 t35. 1901 June 24 to July 24 __________ 87.61 t35. 1981 July 7 to Aug 6 ______________ 87.61 t35. 1987 July 9 to Aug 8 _____________ 87.61 38. 1872 June 18 to July 18 ___________ 87.55 t39. 1936 July 5 to Aug 4 ______________87.52 t39. 1988 B June 12 to July 12 _________87.52 t41. 1954 July 9 to Aug 8 _____________ 87.29 t41. 1970 July 23 to Aug 22 __________ 87.29 t41. 1982 July 6 to Aug 5 _____________ 87.29 44. 1968 July 12 to Aug 11 ___________ 87.23 45. 1930 July 11 to Aug 10 ____________ 87.19 t46. 1931 July 11 to Aug 10 _____________87.16 t46. 2019 July 2 to Aug 1 ______________ 87.16 t48. 2002 B Jun 20or21 to Jul 20or21 __87.10 t48. 2008 July 8 to Aug 7 _____________ 87.10 50. 1940 July 15 to Aug 14 ____________ 87.06 51. 1931 B Aug 8 to Sep 7 _____________ 87.00 52. 1937 July 10 to Aug 9 _____________ 86.97 t53. 1870. July 11 to Aug 10 ____________86.90 t53. 1934. June 21, 22 to July 21, 22___86.90 t55. 1900 June 25 to July 25 ___________86.84 t55. 1961 Aug 7 to Sep 6 _______________86.84 t55. 1973 Aug 5 to Sep 4 ______________ 86.84 58. (1949) June 11 to July 11 ___________ 86.74 59. 1918 July 15 to Aug 14 _____________ 86.71 t60. 1885 July 6 to Aug 5 ______________ 86.68 t60. 1971 June 16 to July 15 ____________ 86.68 (62. 1887 June 30 to July 30 _________ 86.65) (63. 1997 June 19 to July 19 ___________ 86.61) (64. 2001 July 31 to Aug 30 ___________ 86.58) (65. 1974 July 2 to Aug 1 ______________ 86.55) (66. 1896 July 15 to Aug 14 ___________ 86.48) (67. 1932 July 10 to Aug 9 ____________ 86.48) (68. 1990 July 18 to Aug 17 ___________ 86.42) (t69. 1911 July 2 to Aug 1 _______________86.39) (t69. 1917 July 13 or 16 to Aug 12, 15) __ 86.39) (t69. 1969 Aug 3 to Sep 2 _____________ 86.39) (t69. 2023 June 29 to July 29 ________ 86.39) (73. 1963 July 13 to Aug 12 ___________ 86.35) (t74. 1878 June 26 to July 26 __________86.32) (t74. 1908 June 20 to July 20 _________ 86.32) (76. 1941 July 10 to Aug 9 _____________86.29) (77. 1972 July 10 to Aug 9 ____________ 86.23) (78. 1935 July 5 to Aug 4 _____________ 86.19) (79. 1933 July 6 to Aug 5 _____________ 86.10) (80. 1921 July 2 to Aug 1 ______________ 86.03) _________________________ As 1953, 1988, 2002 have two qualifying separate intervals, 63 are ranked for 60 leading years. All near misses, some that had well known heat waves, are added in the 86-87 range. This is basically the top half of the years, the worst three for lack of heat are 1869 (peak 79.29), 1889 (81.61) and 2000 (81.71), 4th was 1871 (81.81). -
Here come the redneck fireworks. So annoying.
-
Could bring some moisture and humidity to the NYC area this week. I’ll keep an eye out.
-
July 2025 Obs/Disco ... possible historic month for heat
metagraphica replied to Typhoon Tip's topic in New England
80/55 CoC. Gonna need a sweatshirt to watch the fireworks tonight. Cool and dry. -
the dryness of the air reminds one of autumn, of the shortening days, the return to school. it’s independence day but might as well be 6:30 pm on football sunday. soon the ticking of the 60 Minutes clock will end my weekend, and there’s still so much homework i have been ignoring
-

July 2025 Discussion-OBS - seasonable summer variability
Brian5671 replied to wdrag's topic in New York City Metro
storm hit north of me-missed us by 3-4 miles-tree damage is intense (Trumbull, CT) -
A Tropical Storm Watch has been issued from Edisto Beach, South Carolina to Little River Inlet, South Carolina. Tropical Depression Three Discussion Number 1 NWS National Hurricane Center Miami FL AL032025 500 PM EDT Fri Jul 04 2025 The wind circulation associated with the low pressure area east of the coast of north Florida has become stronger, with aircraft and scatterometer data indicating a well-defined circulation with maximum winds near 30 kt and a radius of maximum wind of about 80-90 n mi. The system has also developed persistent convection east and southeast of the center. Based on these developments, advisories are being started on Tropical Depression Three. The cyclone is currently being affected by 20-25 kt of southwesterly shear caused by a mid- to upper-level trough not far to the west. The initial motion is uncertain due to some reformation of the center, with the best estimate of 360/2 kt. During the next 24 h, the cyclone should move slowly north-northwestward on the northeast side of a developing mid- to upper-level low over the northeastern Gulf. After that time, the system should be steered northward with a gradual increase in forward speed. This motion should bring the center near or over the coast of South Carolina Sunday morning. A generally northward motion should then continue until the system dissipates over land. While the guidance generally agrees with this scenario, there is considerable spread in both the forecast direction and speed, with the HWRF being a notable right outlier. The forecast track is in best agreement with the GFS and the HCCA corrected consensus model. The current shear is expected to diminish on Saturday as the upper-level trough moves westward away from the cyclone and the upper-level winds become southerly. However, the upper-level winds are forecast to become convergent, which may limit the amount of convection the system produces. Most of the guidance shows some development as the system approaches the coast, so the intensity forecast calls for modest strengthening to a tropical storm before the cyclone makes landfall. This forecast is a little below the intensity consensus.

-

July 2025 Obs/Disco ... possible historic month for heat
kdxken replied to Typhoon Tip's topic in New England
-
couldn't even be a tropical depression LOL
-
someone change the thread title NHC will initiate advisories on Tropical Depression Three, located in the Atlantic Ocean offshore of the southeastern United States, at 500 PM EDT (2100 UTC).
-

July 2025 Discussion-OBS - seasonable summer variability
donsutherland1 replied to wdrag's topic in New York City Metro
Tomorrow will be warm with highs reaching the middle 80s across the New York City area. It will turn hotter on Sunday and the heat could persist through Tuesday. Highs will top out in the upper 80s to around 90° in New York City. New Jersey's hot spots will likely reach the lower and perhaps middle 90s. The ENSO Region 1+2 anomaly was +1.0°C and the Region 3.4 anomaly was 0.2°C for the week centered around June 18. For the past six weeks, the ENSO Region 1+2 anomaly has averaged +0.47°C and the ENSO Region 3.4 anomaly has averaged -0.03°C. Neutral ENSO conditions will likely continue through at least late summer. The SOI was +3.57 yesterday. The preliminary Arctic Oscillation (AO) was +1.175 today. -
460 WTNT33 KNHC 042034 TCPAT3 BULLETIN Tropical Depression Three Advisory Number 1 NWS National Hurricane Center Miami FL AL032025 500 PM EDT Fri Jul 04 2025 ...TROPICAL DEPRESSION FORMS OFF OF THE SOUTHEAST U.S. COAST... ...TROPICAL STORM WATCH ISSUED FOR PORTIONS OF SOUTH CAROLINA... SUMMARY OF 500 PM EDT...2100 UTC...INFORMATION ---------------------------------------------- LOCATION...30.8N 79.0W ABOUT 150 MI...240 KM SSE OF CHARLESTON SOUTH CAROLINA ABOUT 245 MI...395 KM SSW OF WILMINGTON NORTH CAROLINA MAXIMUM SUSTAINED WINDS...35 MPH...55 KM/H PRESENT MOVEMENT...N OR 360 DEGREES AT 2 MPH...4 KM/H MINIMUM CENTRAL PRESSURE...1012 MB...29.89 INCHES WATCHES AND WARNINGS -------------------- CHANGES WITH THIS ADVISORY: A Tropical Storm Watch has been issued from Edisto Beach, South Carolina to Little River Inlet, South Carolina. SUMMARY OF WATCHES AND WARNINGS IN EFFECT: A Tropical Storm Watch is in effect for... * Edisto Beach to Little River Inlet A Tropical Storm Watch means that tropical storm conditions are possible within the watch area, generally within 48 hours. Interests elsewhere along the southeast coast of the United States should monitor the progress of this system. Additional warnings and watches will likely be required for portions of this area later tonight and Saturday. For storm information specific to your area, including possible inland watches and warnings, please monitor products issued by your local National Weather Service forecast office. DISCUSSION AND OUTLOOK ---------------------- At 500 PM EDT (2100 UTC), the center of Tropical Depression Three was located near latitude 30.8 North, longitude 79.0 West. The depression is moving toward the north near 2 mph (4 km/h). A slow motion toward the north-northwest is expected through Saturday, followed by a motion toward the north Saturday night and Sunday. On the forecast track, the center of the depression is expected to move near or over the coast of South Carolina Sunday morning. Reports from an Air Force Reserve Hurricane Hunter data indicate that maximum sustained winds are near 35 mph (55 km/h) with higher gusts. Gradual strengthening is expected, and the system is forecast to become a tropical storm on Saturday. The minimum central pressure estimated from Air Force Reserve Hurricane Hunter aircraft data is 1012 mb (29.89 inches). HAZARDS AFFECTING LAND ---------------------- Key messages for Tropical Depression Three can be found in the Tropical Cyclone Discussion under AWIPS header MIATCDAT3 and WMO header WTNT43 KNHC. WIND: Tropical storm conditions are possible in the watch area beginning late Saturday or early Sunday. RAINFALL: Tropical Depression Three is expected to produce heavy rainfall across portions of the coastal plain of the Carolinas Saturday through Monday. Storm total rainfall of 2 to 4 inches, with local amounts to 6 inches, is expected. This would result in an elevated risk for flash flooding. For a complete depiction of forecast rainfall and flash flooding associated with Tropical Depression Three, please see the National Weather Service Storm Total Rainfall Graphic, available at hurricanes.gov/graphics_at3.shtml?rainqpf STORM SURGE: A storm surge of 1 to 2 ft above ground level could occur along the coast in the tropical storm watch area in areas of onshore flow. SURF: The depression is expected to bring rough surf and rip currents to much of the Carolina coastline during the next couple of days. NEXT ADVISORY ------------- Next intermediate advisory at 800 PM EDT. Next complete advisory at 1100 PM EDT. $$ Forecaster Beven