All Activity
- Past hour
-
Thanks! 1. Based on the graph, June WCS PDO calculated to be ~-1.8. Based on recent relationships between WCS and NOAA, I had said that that likely meant the June NOAA PDO was likely down to the -2.5 to -2.9 range. So, the -2.51 jibes with my expectations. 2. The unrounded AMJ ONI is -0.11. That means RONI minus ONI, -0.38, has narrowed even more. It was -0.43 in MAM, -0.49 in FMA, -0.51 in JFM, and -0.53 in DJF.
-

July 2025 Obs/Disco ... possible historic month for heat
Modfan2 replied to Typhoon Tip's topic in New England
Have a lone cell approaching from IJD, wondering if this hinders later development? -

July 2025 Obs/Disco ... possible historic month for heat
ineedsnow replied to Typhoon Tip's topic in New England
81/60 storm potential looks meh around here -
It can work both ways like we saw last summer. The record subtropical warmth and stable conditions lead to the lull in activity from late August into early September. But then it became very active later in the season.
-

July 2025 Discussion-OBS - seasonable summer variability
donsutherland1 replied to wdrag's topic in New York City Metro
JFK: 3; LGA and NYC: 4; EWR: 6. -

July 2025 Obs/Disco ... possible historic month for heat
powderfreak replied to Typhoon Tip's topic in New England
Down to 63F here, dews 55F. Got chilly in a hurry. -
We had a nice morning for some lawn work here. And I got all the bird poop off the mailbox. It's amazing how much they poop on that thing. Anyway, @HillsdaleMIWeathermight cash in on a rogue storm soon.
-
Spectacular day in ocean city today
-

July 2025 Obs/Disco ... possible historic month for heat
BrianW replied to Typhoon Tip's topic in New England
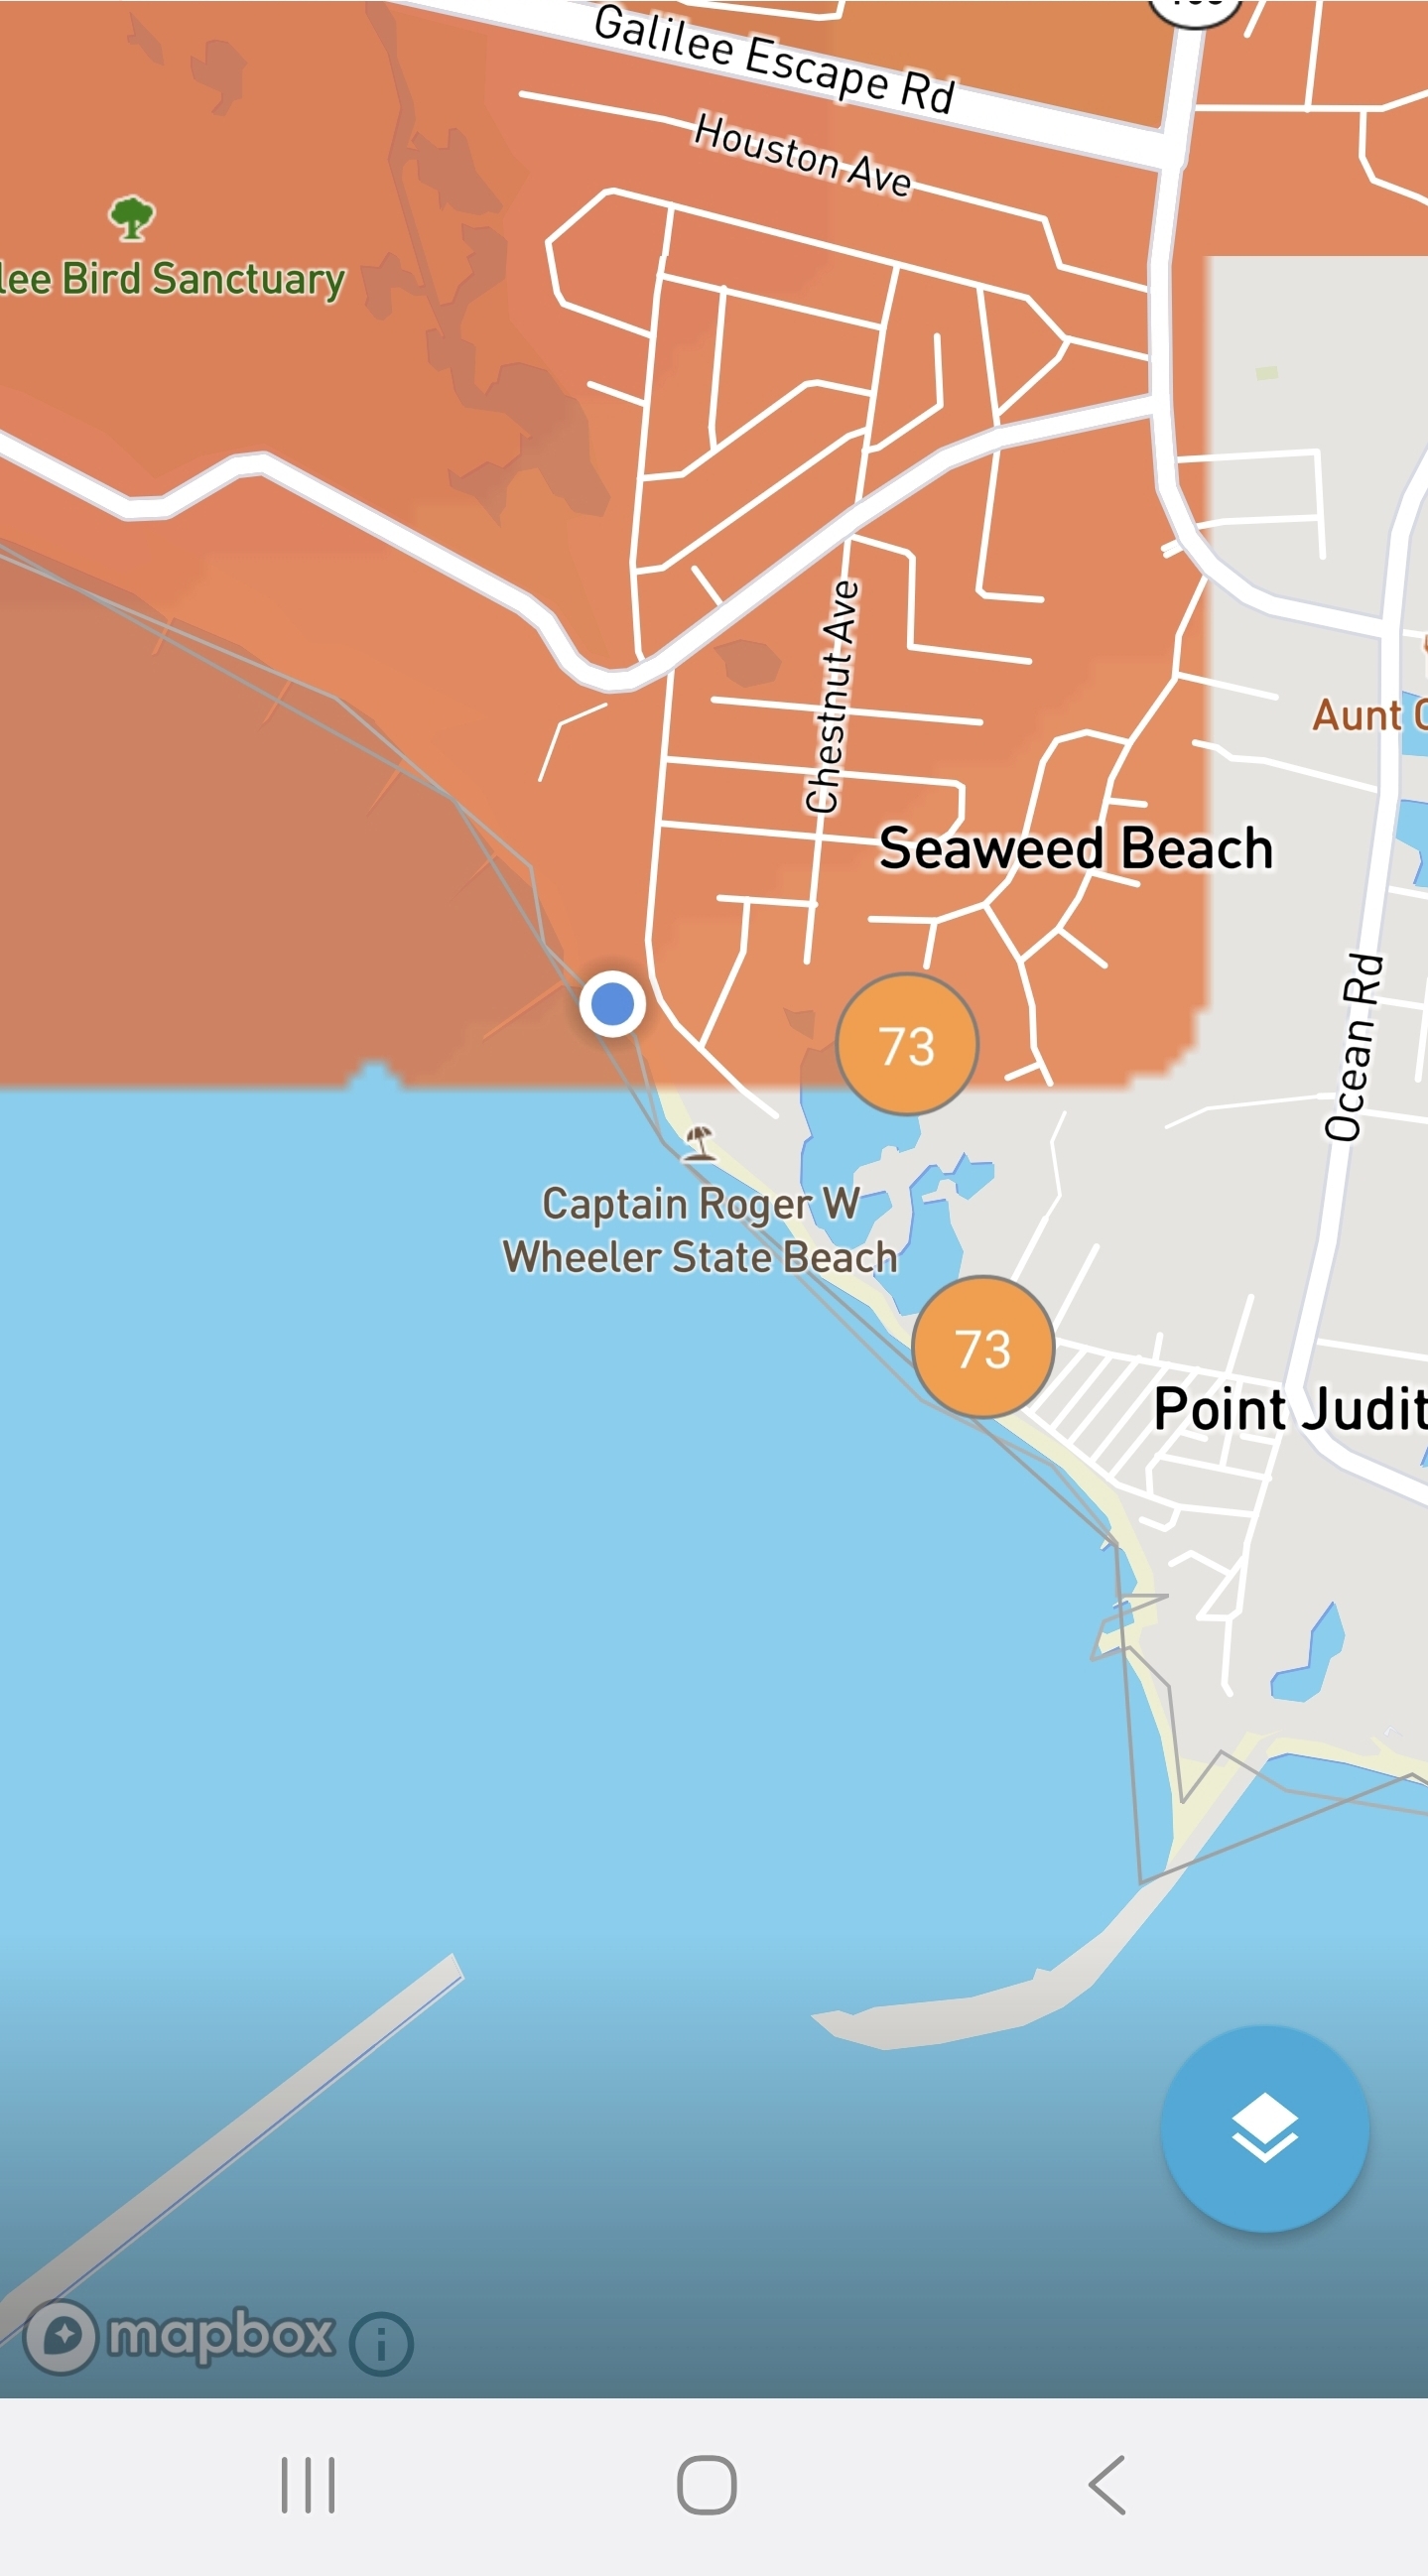
This is the spot for the ACATT crew. Been 73-75 here most of the day at Roger Wheeler Beach/ Pt Judith in RI.
-

July 2025 Discussion-OBS - seasonable summer variability
bluewave replied to wdrag's topic in New York City Metro
The summer of 1966 heatwave was very short compared to our summers these days. The major heat only lasted for around 3 weeks. The summer before and after that period wasn’t very warm by today’s standards. Data for NEWARK LIBERTY INTL AP, NJ Click column heading to sort ascending, click again to sort descending. 1966-06-23 93 61 1966-06-24 97 73 1966-06-25 85 63 1966-06-26 78 62 1966-06-27 101 68 1966-06-28 90 74 1966-06-29 90 71 1966-06-30 94 72 1966-07-01 87 71 1966-07-02 102 70 1966-07-03 105 75 1966-07-04 100 78 1966-07-05 87 74 1966-07-06 87 73 1966-07-07 93 76 1966-07-08 91 70 1966-07-09 89 67 1966-07-10 93 70 1966-07-11 96 72 1966-07-12 98 72 1966-07-13 100 77 -
90 yesterday, 90 again today so far. Kids love the heat.
-

2025-2026 ENSO
PhiEaglesfan712 replied to 40/70 Benchmark's topic in Weather Forecasting and Discussion
AMJ ENSO (ONI): -0.1C AMJ RONI: -0.49C June PDO: -2.51 -
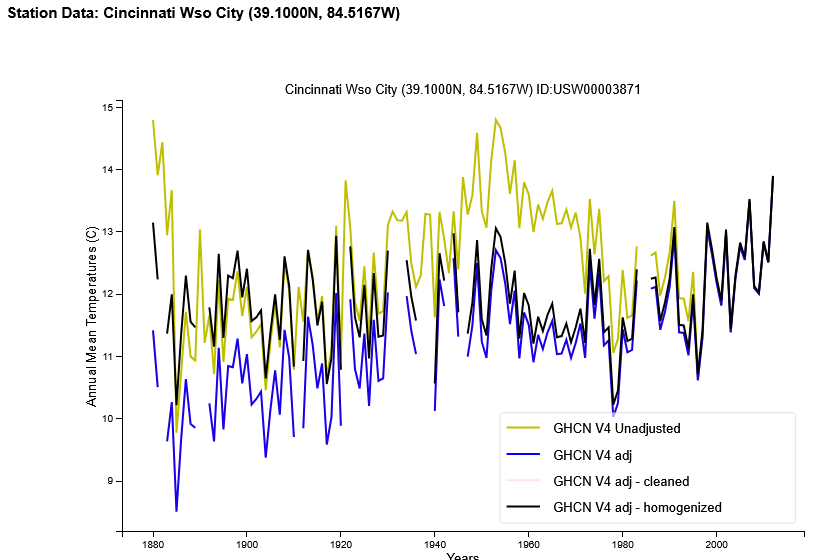
The Queen City in Ohio joins the altered past climate group.....there really is a pattern here!
-

July 2025 Obs/Disco ... possible historic month for heat
Lava Rock replied to Typhoon Tip's topic in New England
0.44". Is that it for storms? Sent from my SM-S921U using Tapatalk -

July 2025 Discussion-OBS - seasonable summer variability
winterwarlock replied to wdrag's topic in New York City Metro
90 my high so far -
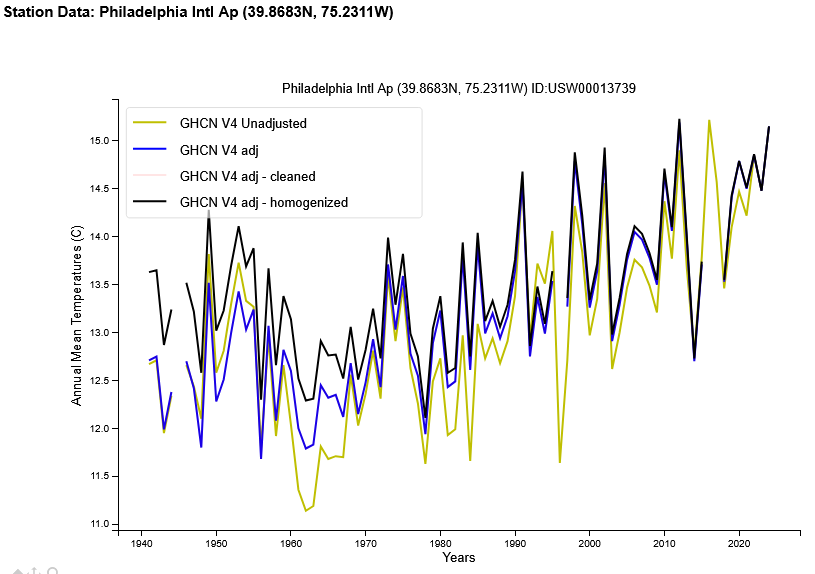
Where's the chilling for the recent years ongoing UHI problems at PHL???
-
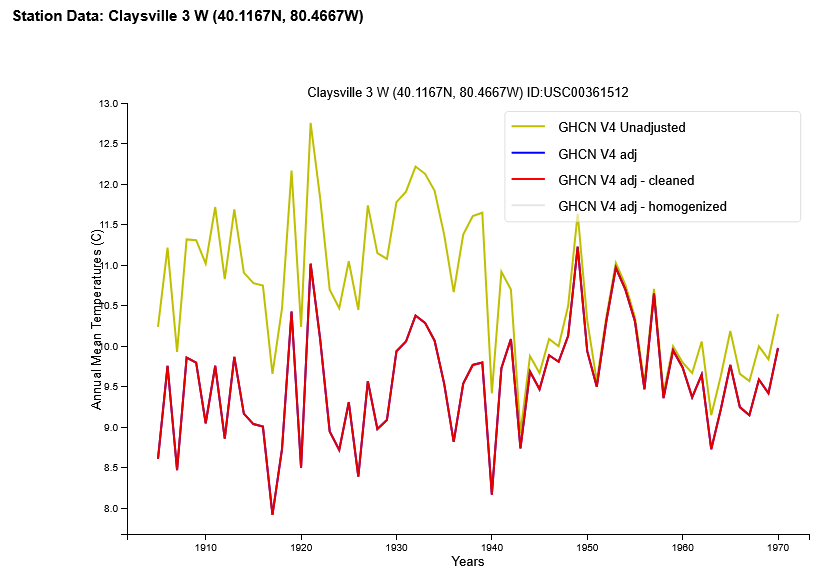
Who can spot that same chilling of the past data in the SE Pittsburgh Burbs?? Do we see a pattern chill the past!!
-
July 2025 Obs/Disco ... possible historic month for heat
Modfan2 replied to Typhoon Tip's topic in New England
Could hit Costco in East Lyme and catch something on the way back in Hebron/Glastonbury area -

Occasional Thoughts on Climate Change
TheClimateChanger replied to donsutherland1's topic in Climate Change
It looks like they did adjust the trend down. Rather than chill recent years, early years appear to be adjusted upwards, no? Pretty substantially in the 1960s and 70s, in fact. What am I missing here? The unadjusted data pretty clearly shows a steeper warming trend than the adjusted data. -
Nice little storm following the west bank of the Susky across from HBG. Good thunder from it.
-
There is actually a good one rolling southeast from Pottsville to Hamburg, and again up in WB/Scranton. I'm splitting the goal posts....again. Guess that's going to be the storm pattern for the summer.
-
Who can spot the UHI chilling adjustments done to the PHL Airport data?? Hmmm I guess there is no UHI amidst the runways and jet exhaust....
-
Occasional Thoughts on Climate Change
donsutherland1 replied to donsutherland1's topic in Climate Change
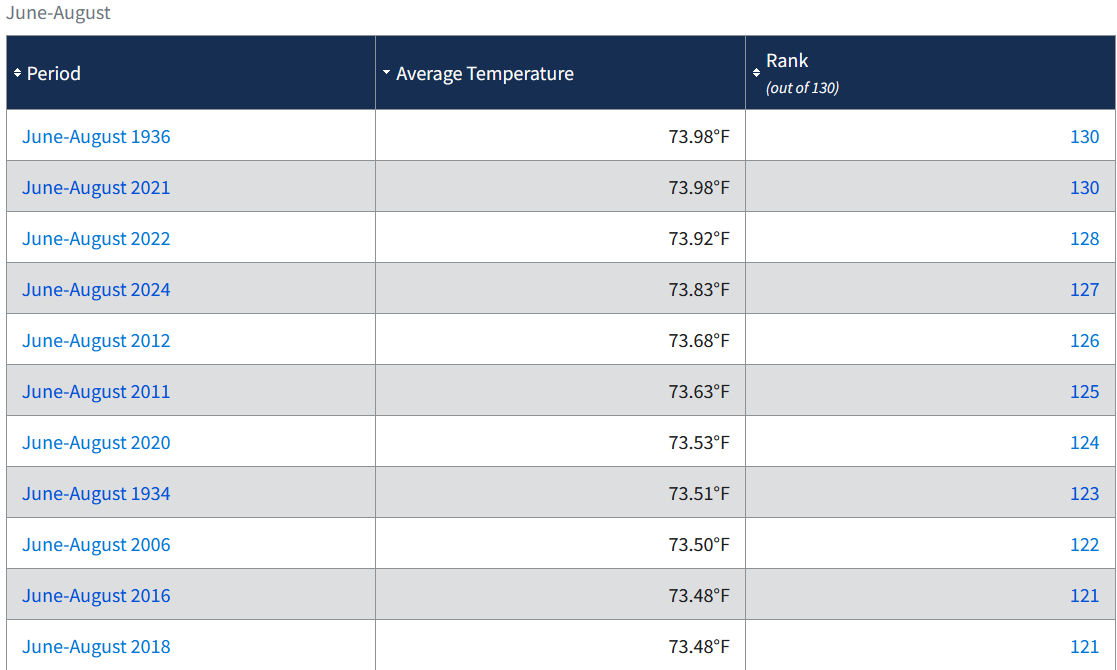
Setting aside extreme maximum temperatures in the area most affected by the Dust Bowl, on a nationwide basis, such summers have already been matched or exceeded. Only 136 retains the top spot (in a tie).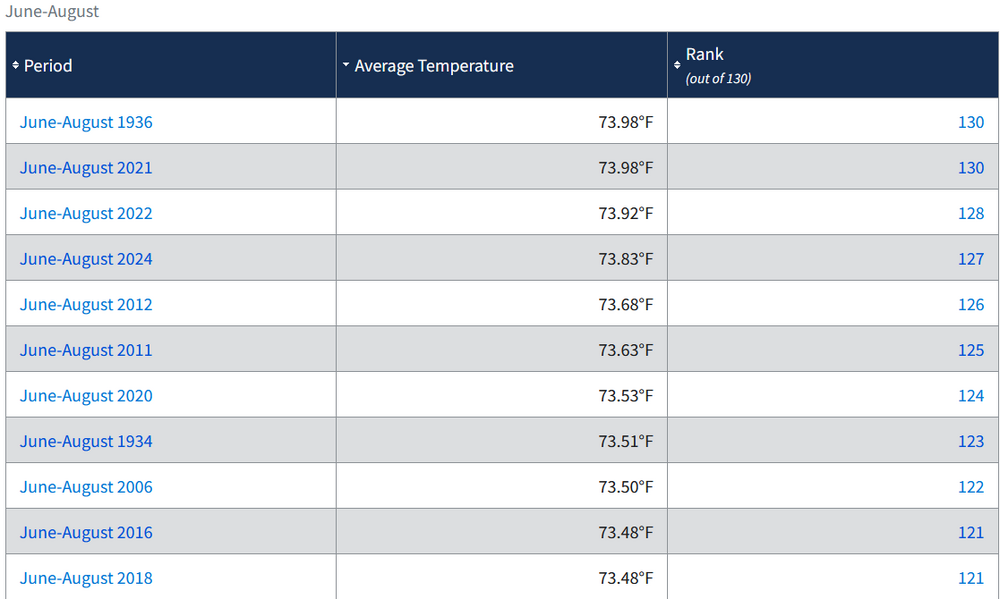
-
Occasional Thoughts on Climate Change
TheClimateChanger replied to donsutherland1's topic in Climate Change
Lol. There was no "Greater Pittsburgh Air Force Base" with data back to 1880. What a clown. This appears to be a mix & match of different stations threaded together. In fact, it looks to be the official station thread. Funny it cuts off in 2020. Even the airport [400+ feet higher in elevation] beat any year in history by 1F just last year. -
Occasional Thoughts on Climate Change
donsutherland1 replied to donsutherland1's topic in Climate Change
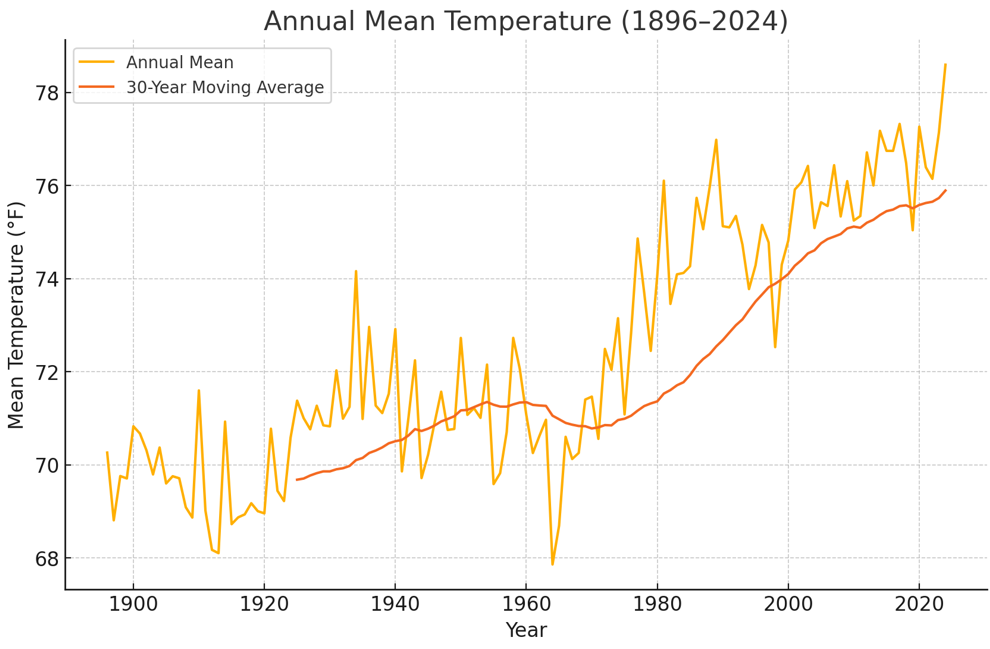
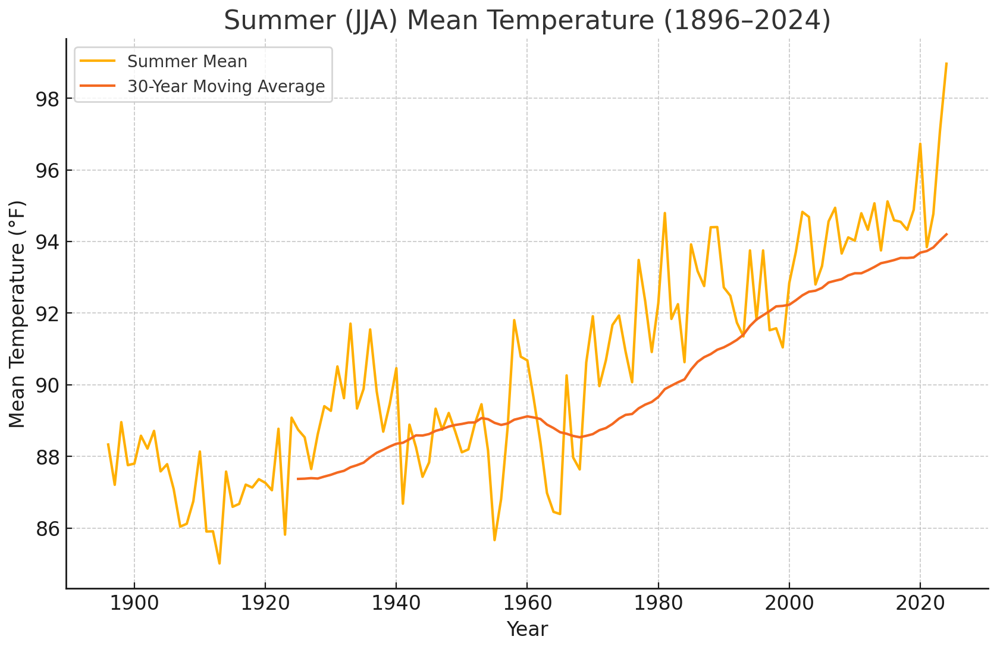
At best, there is a hint of an uncertain weak cyclical effect. However, changes in aerosols may well have driven most of the cooling seen in the 1960s. In any case, strong and persistent warming from UHI + anthropogenic climate change have overwhelmed any periodicity that might exist in Phoenix. The warmest summer during the 1930s was 1933 with a mean of 91.7° and the warmest year during the 1930s was 1934 with a mean of 74.2°. Every summer and every year since 2000 has exceeded those figures. The last cooler summer was 1999 and the last cooler year was 1998.