All Activity
- Past hour
-

January 30th- Feb 1st ULL and coastal storm obs
Regan replied to JoshM's topic in Southeastern States
That’s good because that helps Raleigh.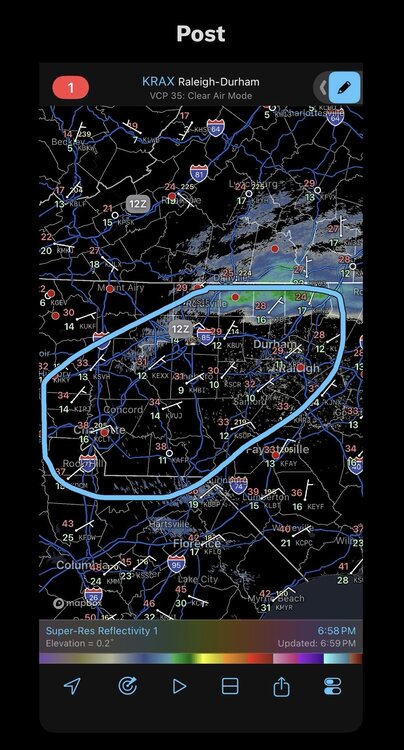
-
La Nina is just about dead. Headed in to an El Nino, if predictions hold true.
-

January 30th- Feb 1st ULL and coastal storm obs
Grayman replied to JoshM's topic in Southeastern States
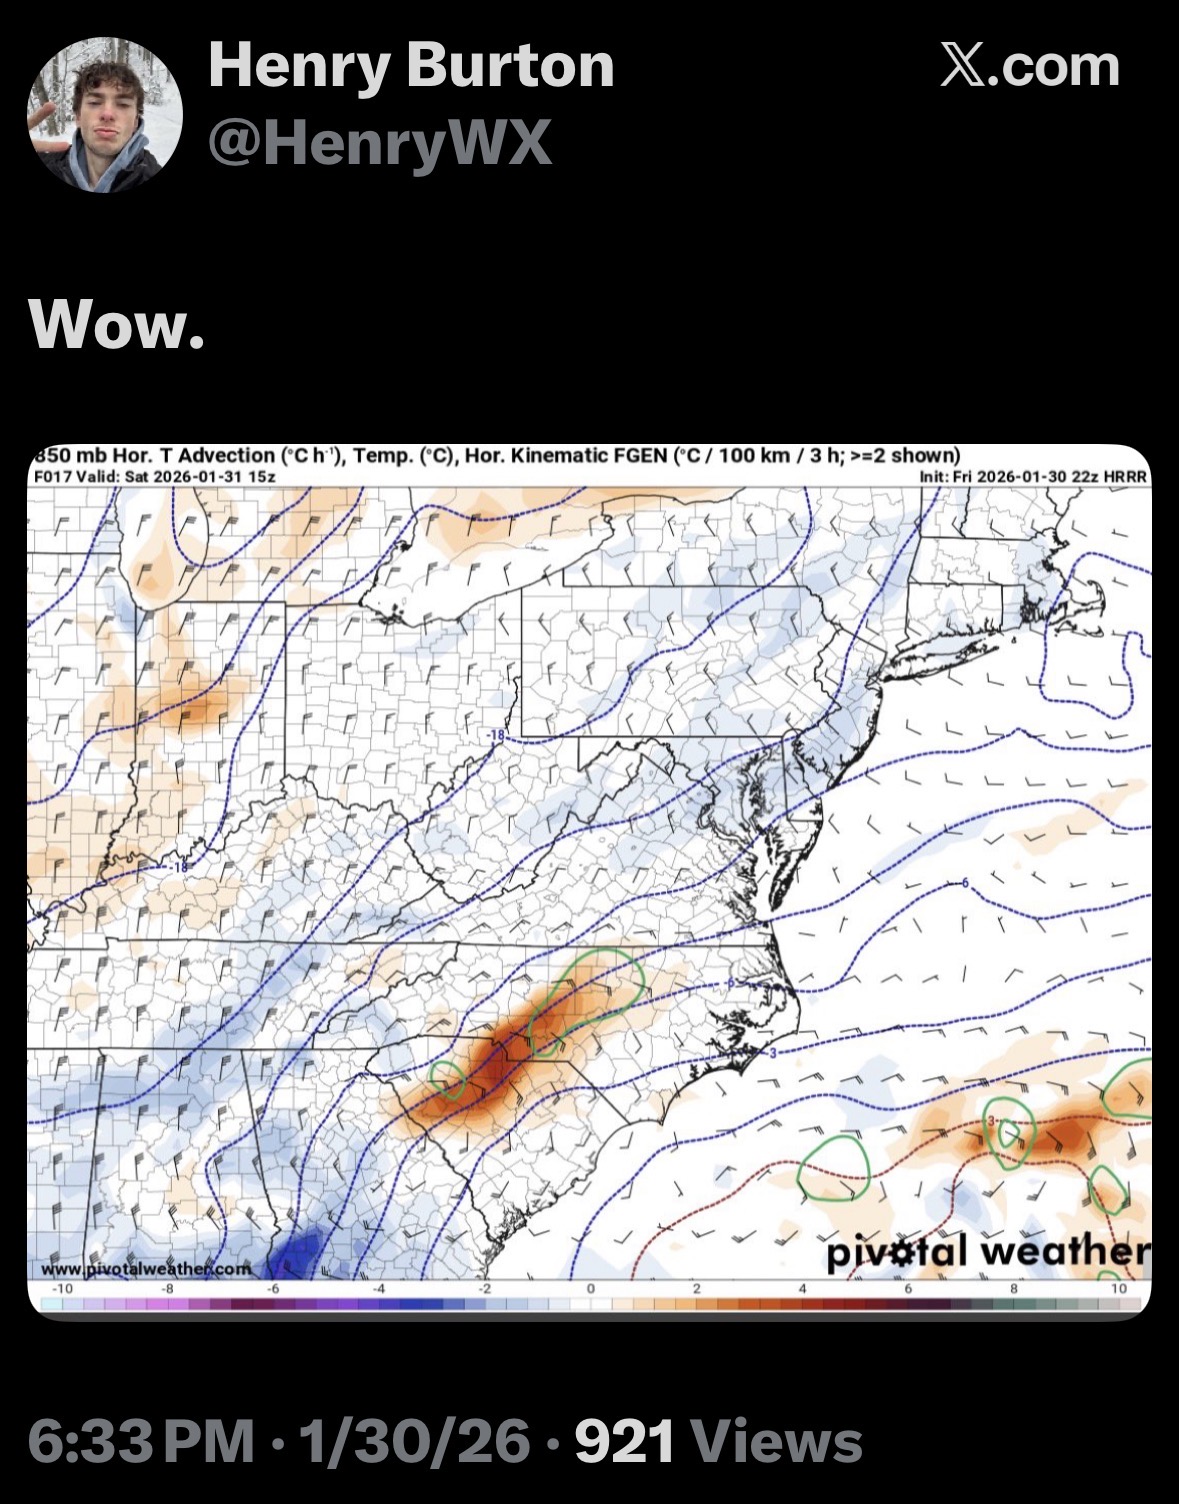
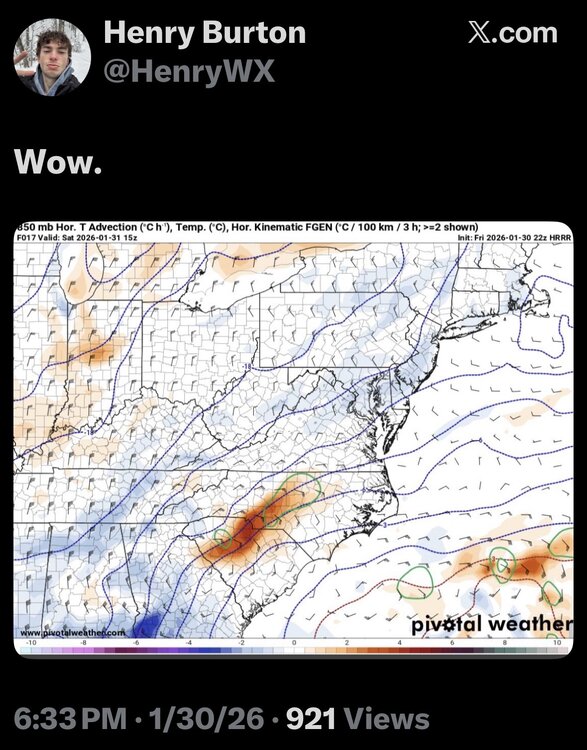
I’m no pro. But Eric Webber pointed out that it’s some kind of warm font that can really create a huge axis of snow. He made a post on ex about it, but I don’t know how to link it. -

January 30th- Feb 1st ULL and coastal storm obs
TriadTom_wxm replied to JoshM's topic in Southeastern States
I would be very shocked, in a good way! Best of luck sir, and to everyone, may the odds be ever in your favor -
The “I bring the mojo” Jan 30-Feb 1 potential winter storm
Regan replied to lilj4425's topic in Southeastern States
-

Jan 30th-February 1st 2026 Arctic Blast/ULL Snow OBS Thread.
John1122 replied to John1122's topic in Tennessee Valley
I convert them to gifs and do it. -
The “I bring the mojo” Jan 30-Feb 1 potential winter storm
Aleksey replied to lilj4425's topic in Southeastern States
Disregard. I got it. Should be updated now. . -

2025-2026 ENSO
Stormchaserchuck1 replied to 40/70 Benchmark's topic in Weather Forecasting and Discussion
Yeah, the Rockies and NW are much warmer. Mid Atlantic and Northeast much colder. Larry has gone back to their outlooks of the last 15 years I think and has found that the average seasonal grade is C+/B-. -

January 30th- Feb 1st ULL and coastal storm obs
Snowncanes replied to JoshM's topic in Southeastern States
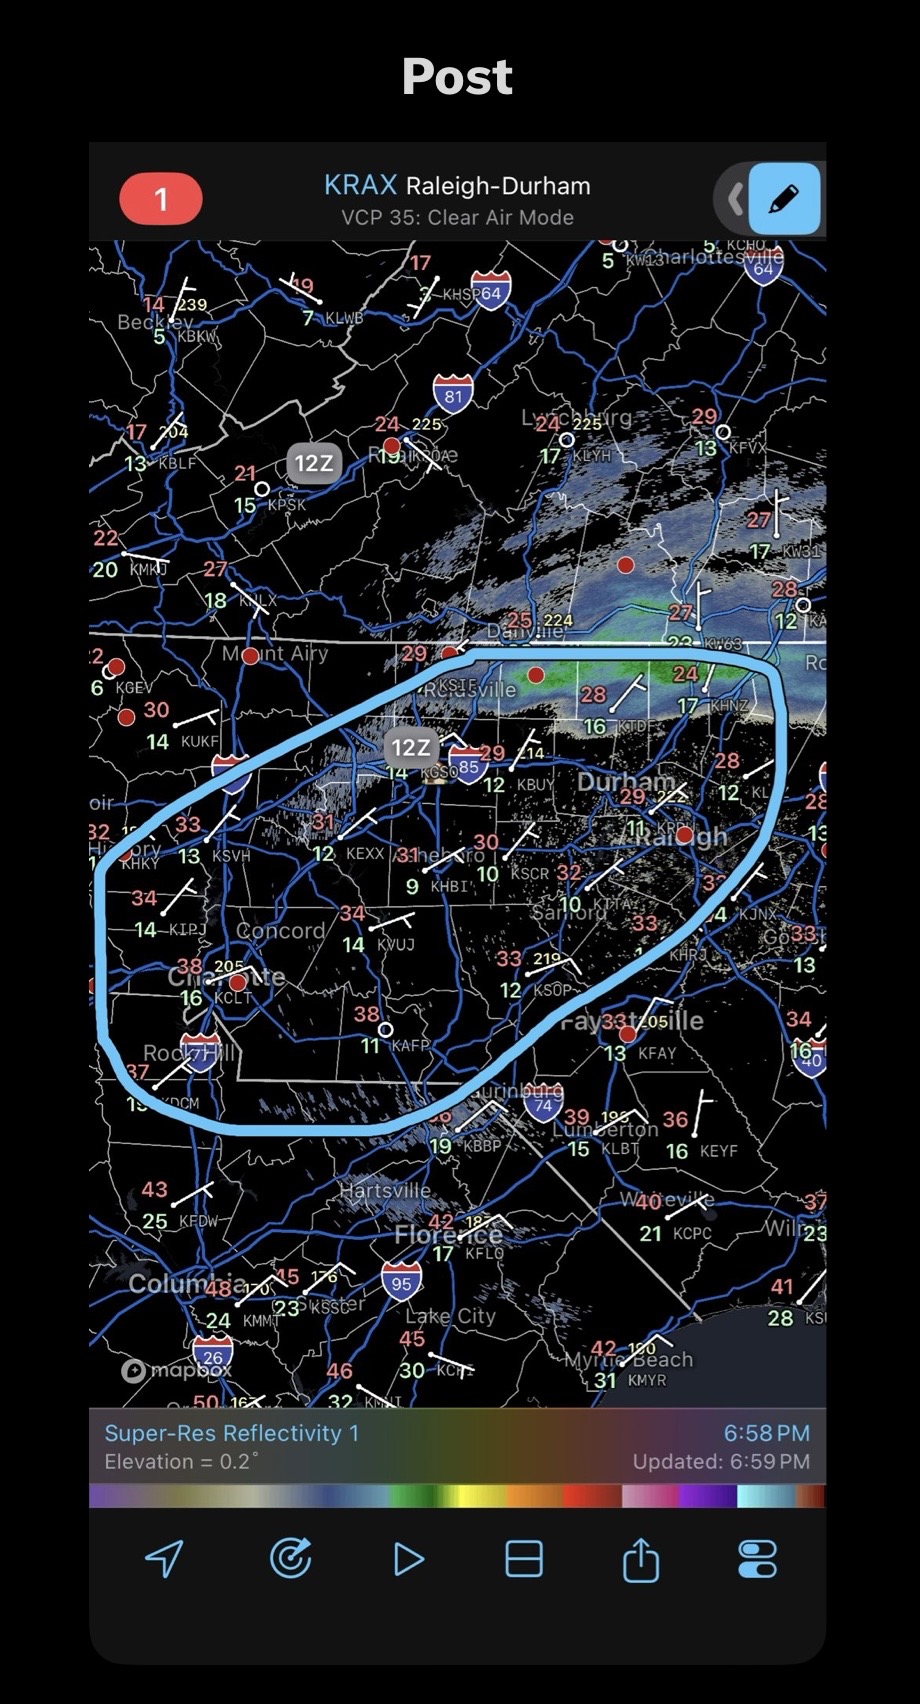
If you look at the HRRR you can already tell it’s too dry. The NAM is closer. Not really surprising, the HRRR has been initializing dry all afternoon. That’s an elevated warm front. Aka frontogenesis. That’s where theres the most lift and the banding will set up on that model. -

The “I bring the mojo” Jan 30-Feb 1 potential winter storm
USCG RS replied to lilj4425's topic in Southeastern States
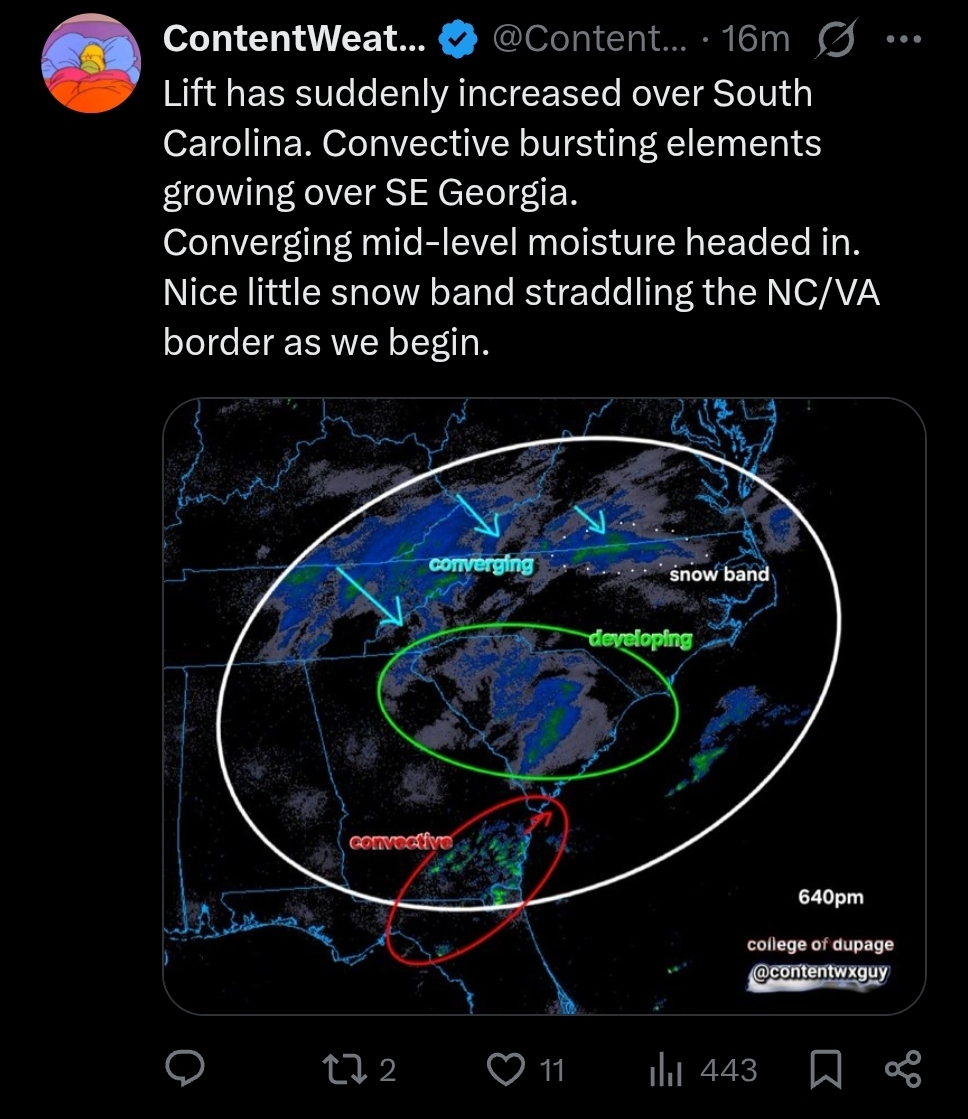
https://x.com/ContentWxGuy/status/2017383442699190326?s=20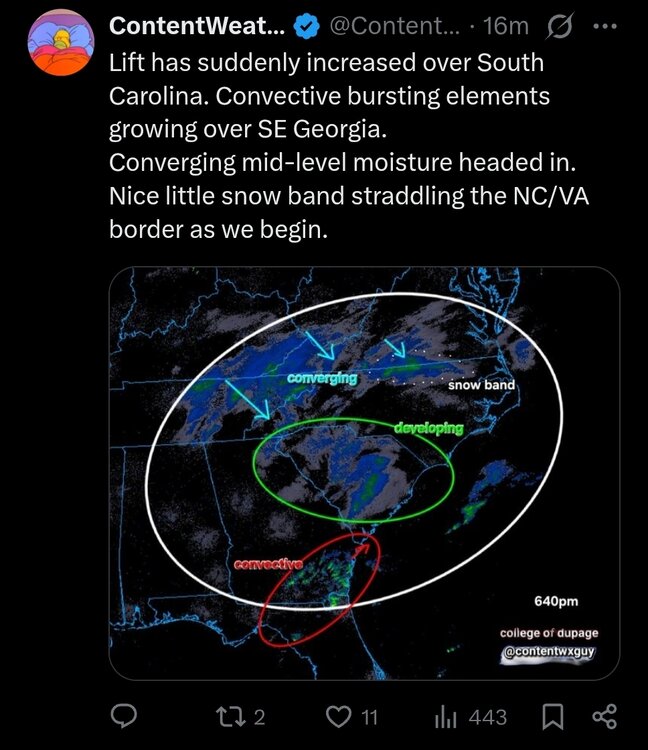
-
2025-2026 ENSO
Stormchaserchuck1 replied to 40/70 Benchmark's topic in Weather Forecasting and Discussion
Practice trial #1 [CPC long range outlook vs Natural Gas Futures price] Contract price at time of comparison: March '26 contract $3.159. Contract price at end of month(end of forecast period): $4.416 Total price difference: +39.8% Experimental predictor: 1-0, +39.8% [monthly] I will continue this in the future, when there is a significant difference between long range predicted temps and short/medium term predicted temps. -
we probably get our next decent storm when the pattern eases.
-

Jan 30th-February 1st 2026 Arctic Blast/ULL Snow OBS Thread.
Uncle Nasty replied to John1122's topic in Tennessee Valley
Current conditions in Ooltewah. Dark. A lot of darkness. The only white I can see outside is light reflections. We are a Chattanooga suburb, so I expect nothing less! 37° Sent from my SM-S916U using Tapatalk -
The “I bring the mojo” Jan 30-Feb 1 potential winter storm
USCG RS replied to lilj4425's topic in Southeastern States
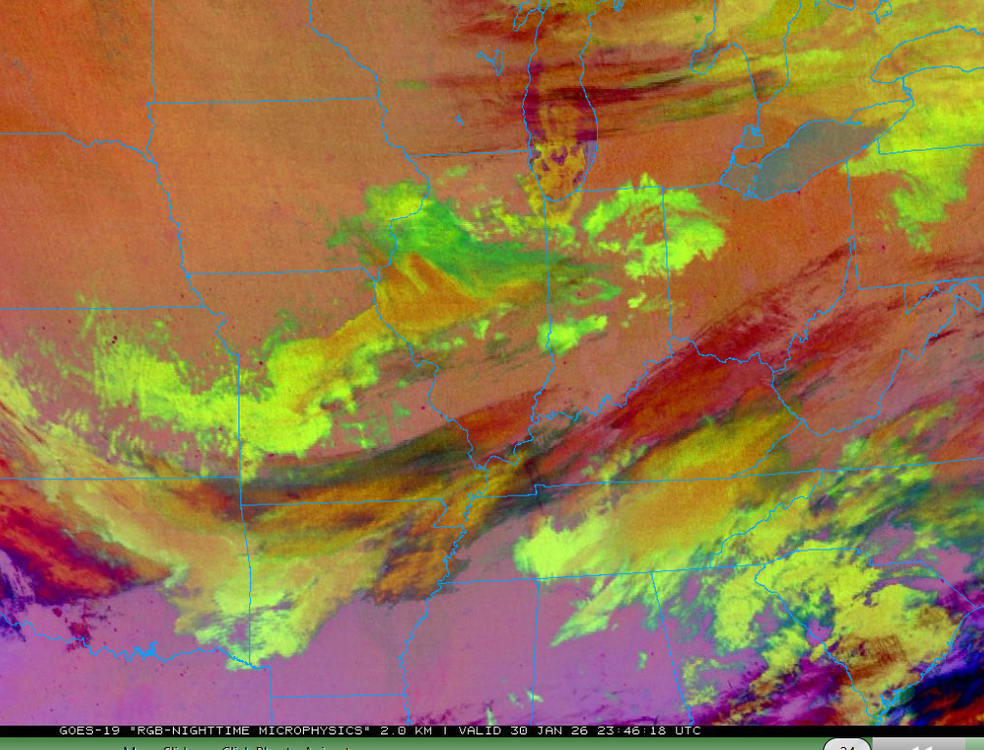
https://x.com/ContentWxGuy/status/2017384586540417531?s=20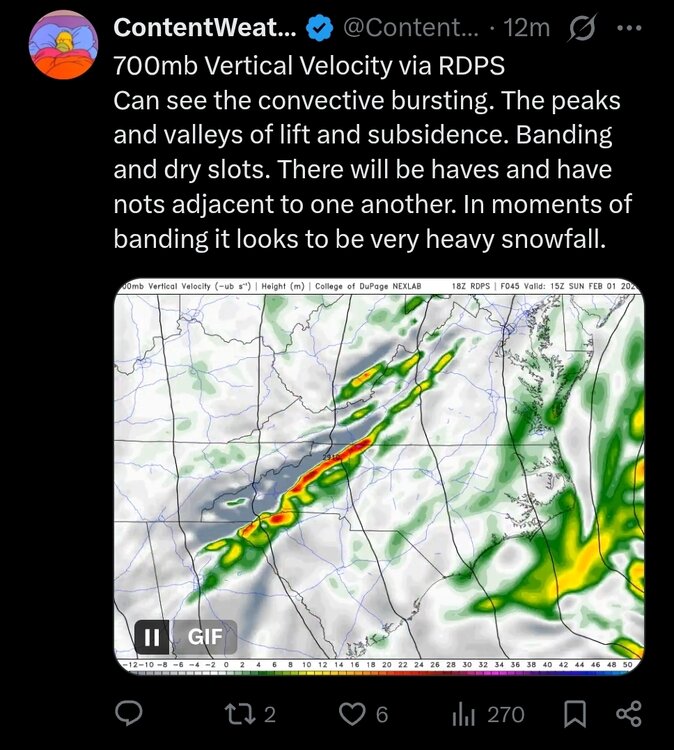
- Yesterday
-

January 30th- Feb 1st ULL and coastal storm obs
WinstonSalemArlington replied to JoshM's topic in Southeastern States
-
Jan 30th-February 1st 2026 Arctic Blast/ULL Snow OBS Thread.
John1122 replied to John1122's topic in Tennessee Valley
Steady nickels falling. Close to an inch down now. 24 degrees. -

January 30th- Feb 1st ULL and coastal storm obs
AGardiner87 replied to JoshM's topic in Southeastern States
Flurries south part of Rock Hill! -
The “I bring the mojo” Jan 30-Feb 1 potential winter storm
Aleksey replied to lilj4425's topic in Southeastern States
How do I update my location in this forum? . -

Arctic Hounds Unleashed: Long Duration Late January Cold Snap
HoarfrostHubb replied to WxWatcher007's topic in New England
All kinds of anecdotal stories of crazy low temps here from that February . Nothing verified of course and wonky thermometers. -
In contrast to my Obs thread rant.. On the positive side for tonight and tomorrow, the cold core. KCMO area is squeezing out snow showers despite a dearth of multi-level clouds. KCMO is not exactly known for upslope, ha! If they can do it, favored areas in Tennessee will do well on Saturday / Sat. night.
- 770 replies
-
- 3
-

-
- extreme cold
- snow
- (and 1 more)
-
Professor at UNCA said something similar today. Thinks that the ULL flow will be too northerly for the foothills to benefit.
-

2025-2026 Fall/Winter Mountain Thread
Maggie Valley Steve replied to Buckethead's topic in Southeastern States
Flurries have started at Valley floor. It took a while to saturate enough. -
Arctic Hounds Unleashed: Long Duration Late January Cold Snap
JACKASS replied to WxWatcher007's topic in New England
Very cool! Thanks for sharing!!! -
<<<< FEBRUARY NYC DAILY RECORDS >>>> Note: Max 2d snow is the listed date plus the previous date, so for example 17.4" fell Feb 3-4 1961. Any 2d total with * symbol had all of its snow on the calendar date and zero the previous day. Any 2d total with ** had all of its snow the previous day and none on calendar date of table listing. ... Also, any number in brackets after a Low min record is that day's non-record-low max. R or S after precip indicates whether the value was mostly rain, snow or a combination (RS). Some of those may be snow+sleet. Date _____ High max ____ High min _______ Low max ____ Low min _______ Max prec ___ Max snow ___ Max 2d snow Feb 01 __ 67 1989 ____ 50 1988 ______12 1971 _____-2 1920 _______2.15 1915R__14.8 2021 ___16.8 2021^ Feb 02 __ 59 1988 ____ 42 1952 _______8 1881 ____-3 1881 _______2.98 1973R__5.0 2015___ 15.2 2021** Feb 03 __ 64 1991 ____ 46 1999,2006 __16 1917 ____0 1955 _______ 1.55 1972R___8.0 2014 ___8.0 2014* Feb 04 __ 68 1991 ____ 46 1991 _______12 1886 _____0 1886,1918 ___ 2.10 1961RS_11.4 1961 ____17.4 1961 Feb 05 __ 70 1991 ____ 51 1991 ________ 4 1918 _____-6 1918^________1.43 2014RS__5.9 1920 ___11.6 1920 Feb 06 __ 68 2008 ____42 1884,1938 __10 1895 ____-4 1895 ______ 2.74 1896R__15.5 1978 ____15.5 1978* (11.3 1920 3d 17.0") Feb 07 __ 56 2020 ____ 42 1904 ______10 1875 _____ 1 1910 _______ 2.96 1941R__12.5 1967 ____17.7 1978 (15.2 1967) Feb 08 __ 62 2017 ____ 48 1965 _______ 8 1895 _____ -7 1934 ______ 1.15 2013RS__8.0 1870 ____12.5 1967** Feb 09 __ 63 1990 ____ 46 2005 _______8 1934 _____-15 1934 _____ 1.74 1885R __14.0 1969 ___14.0 1969* Feb 10 __ 61 1990,2001,2023_ 47 2024* __7 1899 ____-6 1899 ______ 2.63 1970R___10.4 1926 ___15.3 1969 (12.0 1926) Feb 11 __ 65 1960,2009 _50 1966 _______ 9 1899 _____-2 1885, 99 ___ 2.74 1886R___12.8 1994 ___12.8 1994* (12.5 1983) Feb 12 __ 62 1999,2018 _ 45 1966 _______9 1899 ____-3 1914 (10) ___1.66 2006S___24.1 2006___26.9 2006 (17.6 1983) Feb 13 __ 64 1951 ____ 47 1880 _______11 1899 _____-1 1914 ________ 2.42 1966R___10.7 1899^___16.0 1899 Feb 14 __ 63 1946 ____ 50 1949 ______ 12 1916 _____-1 2016 (15) ___ 1.59 1914RS__ 8.1 1914 ____12.5 2014 (9.5+3.0) Feb 15 __ 73 1949 ____ 49 1984 _______8 1943 _____-8 1943 _______2.60 1869R___ 5.4 1922 ____9.0 1940 (7.7+1.3) Feb 16 __ 71 1954 ____ 56 2023^______11 1904 _____ 1 1888 _________ 1.40 1885R___ 9.9 1996 ____9.9 1996* Feb 17 __ 68 2022 ____ 49 2022 ______ 7 1896 _____-5 1896 ________1.49 2003S__16.3 2003____19.8 2003 (10.7 1996)^ Feb 18 __ 68 1981 ____ 48 1981 _______16 1958 _____0 1979 (13,17 17th-18th)_1.50 1887R__3.5 1928 ___16.3 2003** Feb 19 __ 66 1997 ____ 53 2017 _______16 1903 _____ 1 1936 (18) ____ 2.15 1908RS_ 12.7 1979 ___12.7 1979* Feb 20 __ 69 1930,39__48 1939 _______16 1885 _____ 2 2015 (19) ____3.07 1898R^__ 12.5 1921 __ 12.7 1979** (7.6" 1934 4,9+2.7) Feb 21 __ 78 2018^____55 2018 ________17 1870 _____ 4 1896 ________ 1.86 1902RS__ 8.0 1929 ___12.5 1921** _ (9.2 1929)^ Feb 22 __ 69 1997 ____ 46 1996 _______21 1963 _____ 8 1918, 63 _____2.39 1878R___ 6.0 2008 ___6.0 2008* Feb 23 __ 72 1874 ____ 55 1985 _______19 1873 _____ 5 1889 _________1.38 1928R___4.8 1972 ____ 5.8 2001 (5.5+0.3) Feb 24 __ 75 1985 ____ 58 2017 _______10 1894 _____-1 1873 ________ 1.69 1977R___6.0 1907 ____ 6.0 1907* Feb 25 __ 75 1930 ____ 51 1930 _______16 1934 _____ 1 1894, 1914 ___ 2.11 1916R___9.4 2010 ____ 9.4 2010* Feb 26 __ 65 1890 ____ 49 1976 _______19 1900 _____ 7 1928, 1990 __ 1.87 1929R__11.5 2010 ____20.9 2010 (9.3" 1934 3.7+5.6) Feb 27 __ 72 1997 ____ 49 1976 _______18 1886 _____ 5 1900 _________ 1.56 2013R___4.0 1873 ____11.5 2010** (8.9" 1991 8.4+0.5) Feb 28 __ 67 1976 ____ 47 1903,10,2017 _ 19 1875 _____ 5 1934 _________ 1.21 1910R___ 9.0 1949 ____9.0 1949* Feb 29 __ 69 1880 ____ 47 1896, 2016 __12 1884 _____4 1884 _______ 2.26 1896R___ 1.1 1968 ____ 5.0 1884** -- - - - - - - - - - - -- ^ 1st _ 2021 snow broke record of 9.8" (1934 -- which was a one-day snowfall event). 5th_6th ... probably very cold with some snow in 1855 *10th _ new record high min 45F 2023 broke 43, 1999; in 2024, 47F broke 2023. 13th _ The 2d 1899 snowfall in this data base may be recorded as a one-day 16.0" in other data bases, here it is broken down to 5.3" 12th and 10.7" 13th. 16th _ New record high min 56F 2023 prev rec 44F 2002 17th _ Also 2d totals of 9.6"(6.3+3.3) 1903 and 9.1" 17th-18th (7.1+2.0) 1893 (these may appear as one-day totals of same amounts in other data bases). Also, 17th max temp 68F 2022 replaced 67F 1976. high min 49F 2022 replaced 46F 1981, 2011. 19th_ 1908 prec record included 4.3" snow 20th _ also 2.68" (unknown amount rain and 12.5" snow) 1921. 21st _ also 68 max in 1930 ... also 2d snow 10.7" 1947 (4.2+6.5) ____________________________________________________________________________________
-
The “I bring the mojo” Jan 30-Feb 1 potential winter storm
Aleksey replied to lilj4425's topic in Southeastern States
It doesn’t show me under your name. I’ll have to update my settings. For some reason it’s not letting me log in, but I can reply and post? I’m not sure. I used to live in Grand Rapids, MI for 5 years prior to coming back home and now I’m back in Winder. Saw the heaviest snow of my entire life up there. We averaged about 75” per winter up there and it became so old so quick. Southern snow is so much more exciting lol but tomorrow’s snow will be like the snow I was used to. Toccoa is sitting very pretty for tomorrow! I think they could see the most along with Athens and Winder in the top 3-5 for totals in the state. .