All Activity
- Past hour
-

Augdewst 2026: Summer's Last Stand
Baroclinic Zone replied to Prismshine Productions's topic in New England
Soakah! -

Augdewst 2026: Summer's Last Stand
CoastalWx replied to Prismshine Productions's topic in New England
Nothing like to my south, but a good soaking here. Same story as Kev even with a little less rain. Nothing terribly exciting, but a good drink nonetheless. I guess we had a decent tstm when I was a way a couple of weeks ago. -

E PA/NJ/DE Summer 2026 Obs/Discussion
soadforecasterx replied to PhiEaglesfan712's topic in Philadelphia Region
Got two rounds of rain. first round brought 1.25" rain and second round overnight brough 1.31" for a total of 2.56" -

2026-2027 Super El Nino
OSUmetstud replied to Stormchaserchuck1's topic in Weather Forecasting and Discussion
The June monthly OISST data was actually adjusted by 0.51. (1.55 v 1.04). -

Chester County PA - Analytical Battle of Actual vs. Altered Climate Data
rclab replied to ChescoWx's topic in Climate Change
Well there goes your shot for the congeniality award at the atmospherics convention. As always ….. -

Augdewst 2026: Summer's Last Stand
weatherwiz replied to Prismshine Productions's topic in New England
Thought this even looked good last Thursday or maybe it was Friday. Front is actually moving more quickly than I thought but when you're ripping a 40+ knot LLJ ahead of a slow moving front with sfc dews >70 and 850 dews into the 60's, PWATS > 2" and a totally saturated profile...great way to great prolific rain rates and over a large area. -
 Just follow https://mexicopharmnews.sbs/# to start saving money.
 -
Augdewst 2026: Summer's Last Stand
weatherwiz replied to Prismshine Productions's topic in New England
AWT -
Line looks to fe falling apart as it moved NNE.
-

E PA/NJ/DE Summer 2026 Obs/Discussion
The Iceman replied to PhiEaglesfan712's topic in Philadelphia Region
Up to 4.65” after the lunch time heavy shower. Extra soupy out there -
Adley to Boston is gonna make me puke
-
Same here. Just clipped my area. Skies partly cloudy right now.
-
2026-2027 Super El Nino
OSUmetstud replied to Stormchaserchuck1's topic in Weather Forecasting and Discussion
I believe because the nino itself is increasing the 20N-20S SSTs. -
Pls let this be it...let this line be it.
-
Yup caught in a 10 minute torrential now..heaviest of storm but clearing showing already to n and w
-
Interesting temp/snowfall website tool. If you're a snow lover, the odds are not in your favor in these parts for big ENSO events:
-

2026-2027 Super El Nino
GaWx replied to Stormchaserchuck1's topic in Weather Forecasting and Discussion
What’s weird is that NOAA July PDO of -1.29 isn’t as negative as NOAA June of -1.32 despite the big plunge on WCS in July!! -
2.48" in Syosset & 2.41" in Muttontown so far.
-

E PA/NJ/DE Summer 2026 Obs/Discussion
Hurricane Agnes replied to PhiEaglesfan712's topic in Philadelphia Region
Rain band was a quick mover so did finish up with 1.79" total for the day so far. Sun has been back out now and has really juiced up the atmosphere. Currently 80 with dp 79. -
Augdewst 2026: Summer's Last Stand
CoastalWx replied to Prismshine Productions's topic in New England
Woof -
Augdewst 2026: Summer's Last Stand
CoastalWx replied to Prismshine Productions's topic in New England
Come my sheep, for I am thy shepherd. -
Like a Jungle out there.
-

Augdewst 2026: Summer's Last Stand
Prismshine Productions replied to Prismshine Productions's topic in New England
What a temperature difference... 110-116 in the Dakotas while we in the 50s/60s Sent from my SM-S176V using Tapatalk -
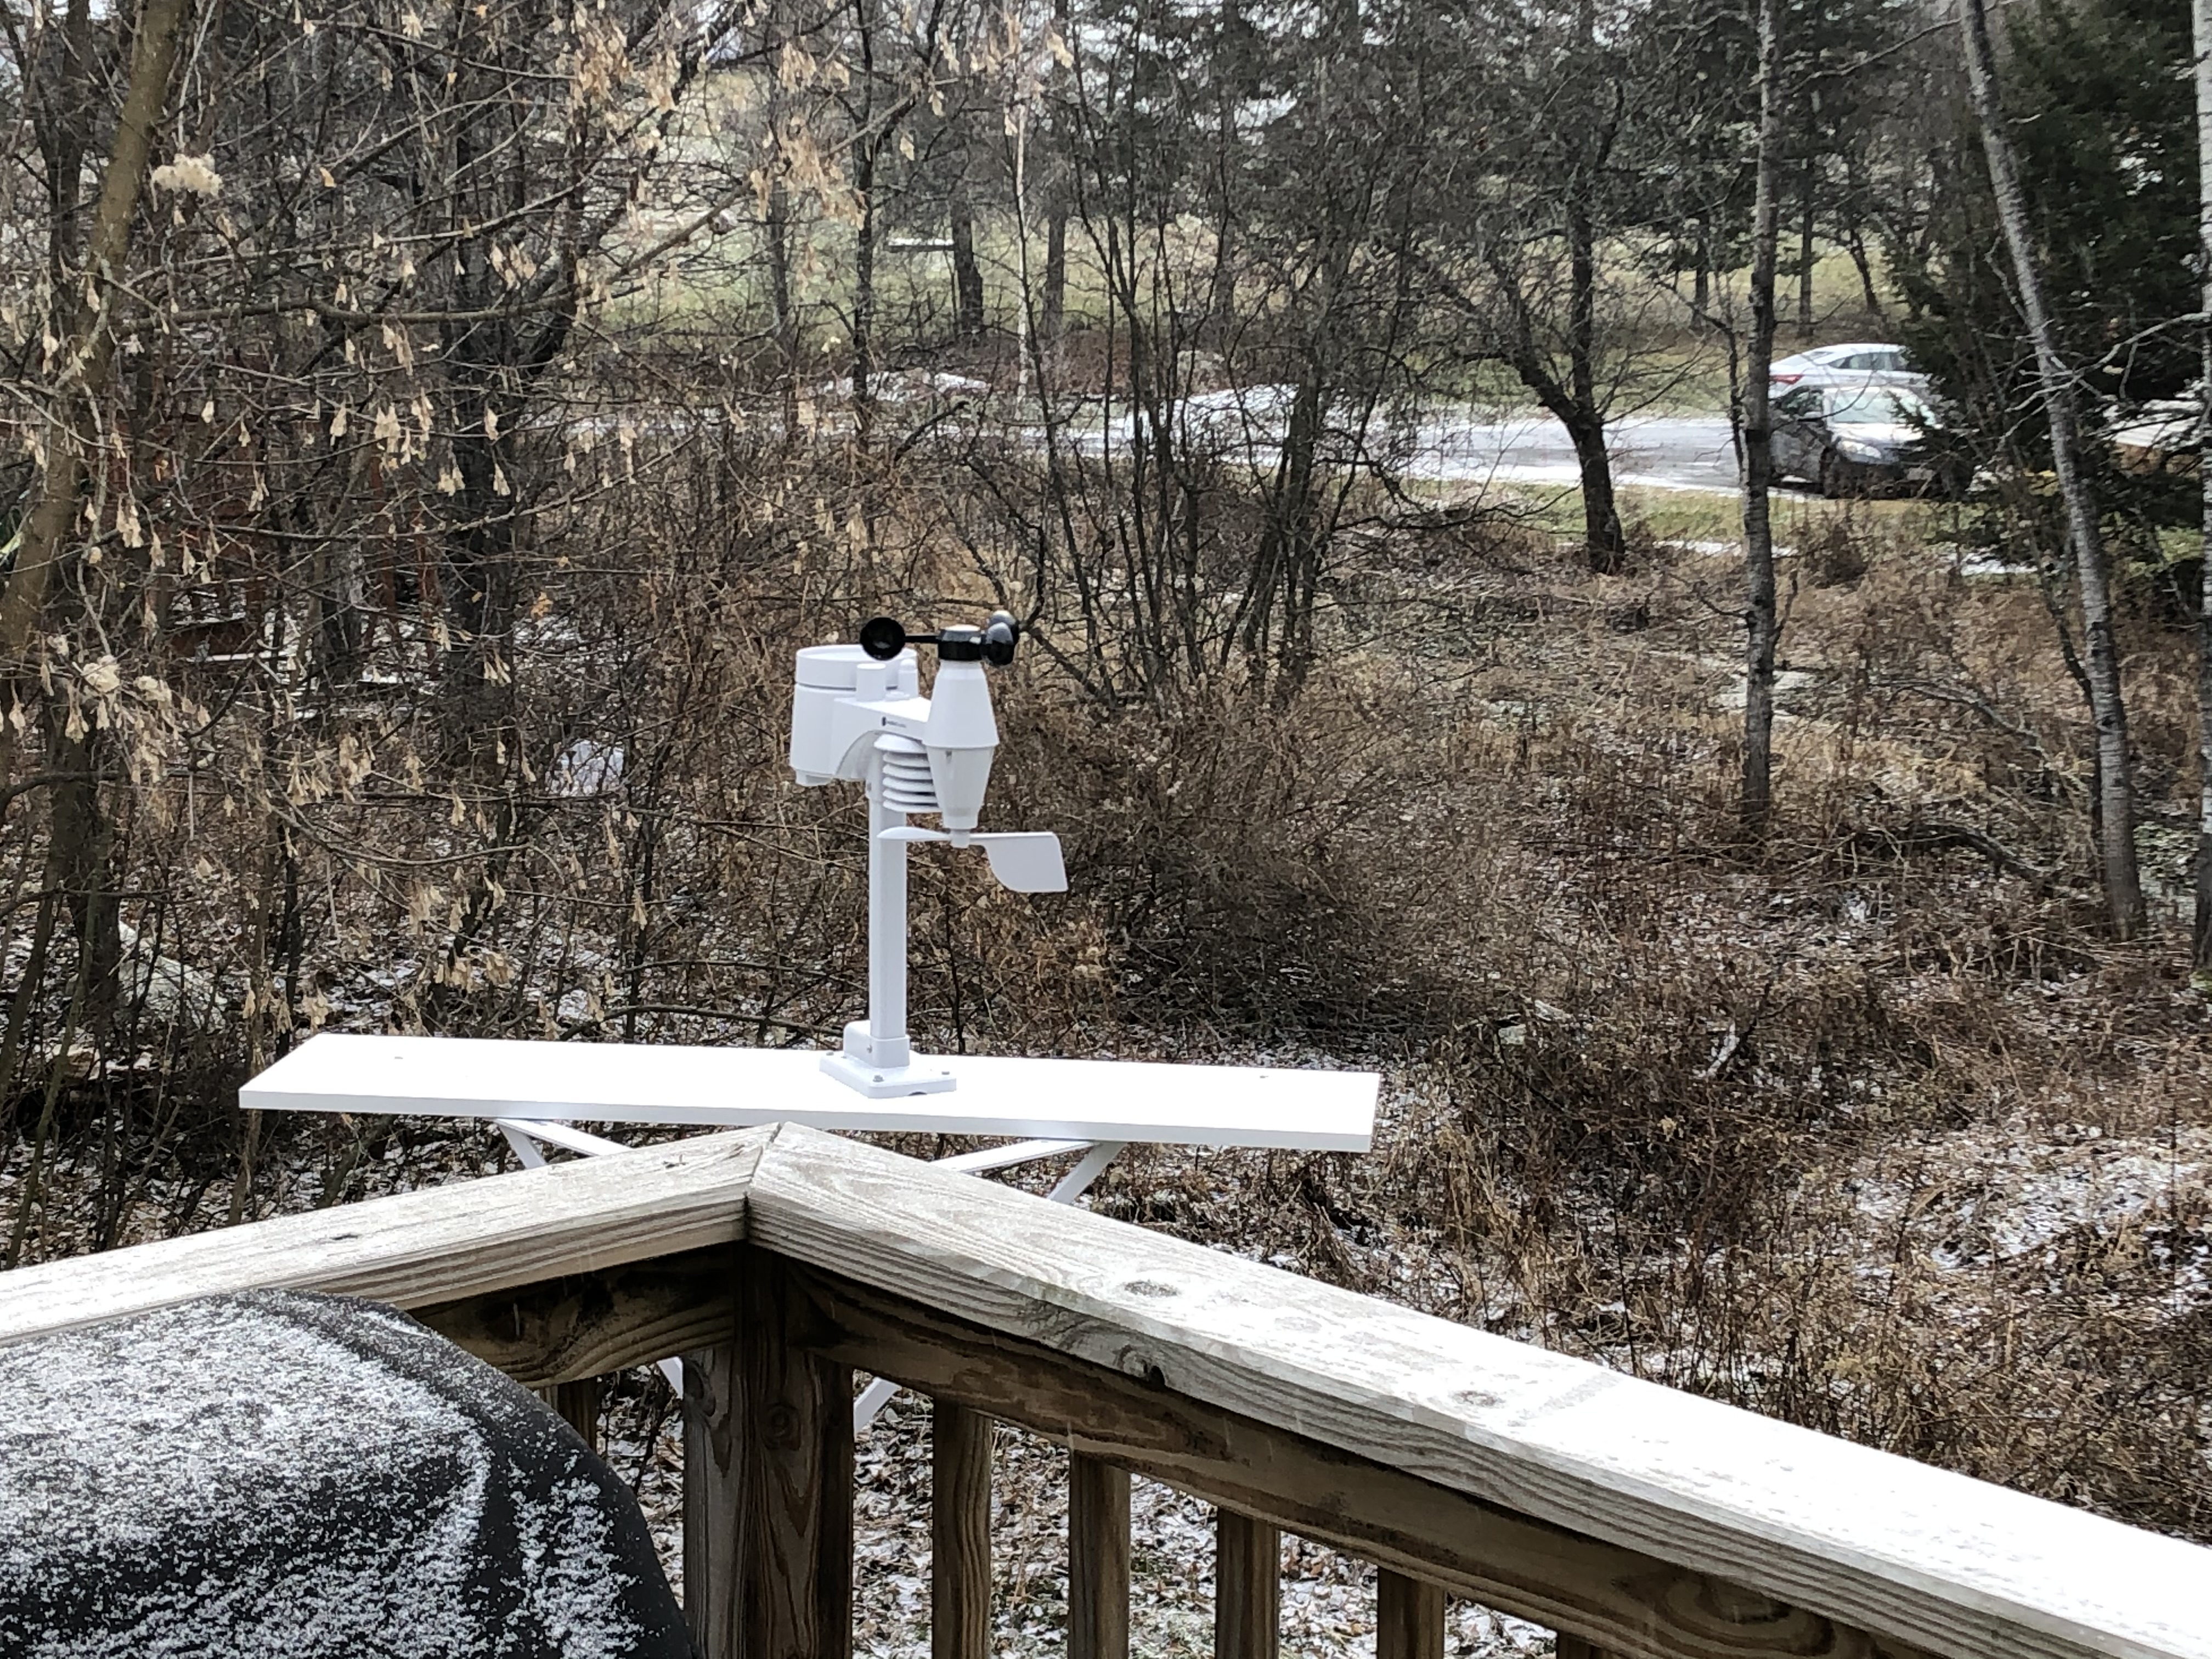
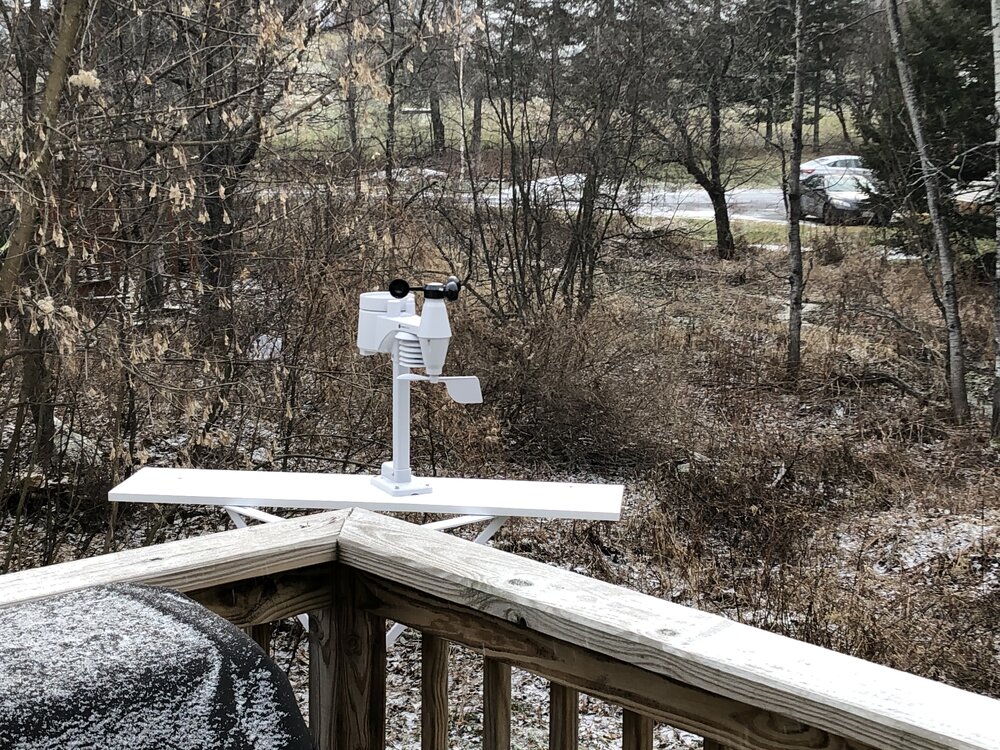
I’ve posted this before but I installed mine on the corner of our deck. The main issue was it being only 8’ from the roof. We are in the middle of enlarging the deck so it will be a couple of feet further out when it gets reinstalled. It’s about 8’-9’ above the ground.
-
Augdewst 2026: Summer's Last Stand
TauntonBlizzard2013 replied to Prismshine Productions's topic in New England
1.97”….