All Activity
- Past hour
-
Nope. Let it snow until April. This has been a great winter. Last year would have also been great if suppression wasn't an issue. Maybe we are turning the corner here in regards to cold and snowy winters.
-

Outta gas and Outta Time: Early March Winter Storm finale
wasnow215 replied to Ji's topic in Mid Atlantic
HRRR-Hardly Right Rarely Right -

Outta gas and Outta Time: Early March Winter Storm finale
SnowenOutThere replied to Ji's topic in Mid Atlantic
FGEN! (I have no idea if its helpful in this setup) -

Outta gas and Outta Time: Early March Winter Storm finale
baltosquid replied to Ji's topic in Mid Atlantic
You are not crazy, pivotal does that for some reason. Maybe because the scale adjusts slightly for each run to better fit all totals but idk edit: actually it is not changing the bar length at all so I guess it’s just something with how pivotal processes the gif -

Outta gas and Outta Time: Early March Winter Storm finale
bncho replied to Ji's topic in Mid Atlantic
I feel like the snowfall color guide on the bottom changing colors. I didn't get a lot of sleep last night so that might be it -
Went from 3.39 to 4.49 a/gal over the weekend, and I'm due for a fill up on 3/11. Fun times Lets get this warmth in here.
-
Pretty disappointing to see winter end this week if that is the case. I'm sure we'll see some more chances after Weds along with a bit of cold, but once the pack is decimated I'm read to move on. I thought we'd be safe at least till 2nd or 3rd week of the month, but such is life.
-
Looks like a few inches up here.
-
Outta gas and Outta Time: Early March Winter Storm finale
baltosquid replied to Ji's topic in Mid Atlantic
if you believe the RRFS, that band will be legit lol.
-
Uh oh.... P Sunny 6.6
-
Back to weather... started a thread for Tuesday/Wednesday
-
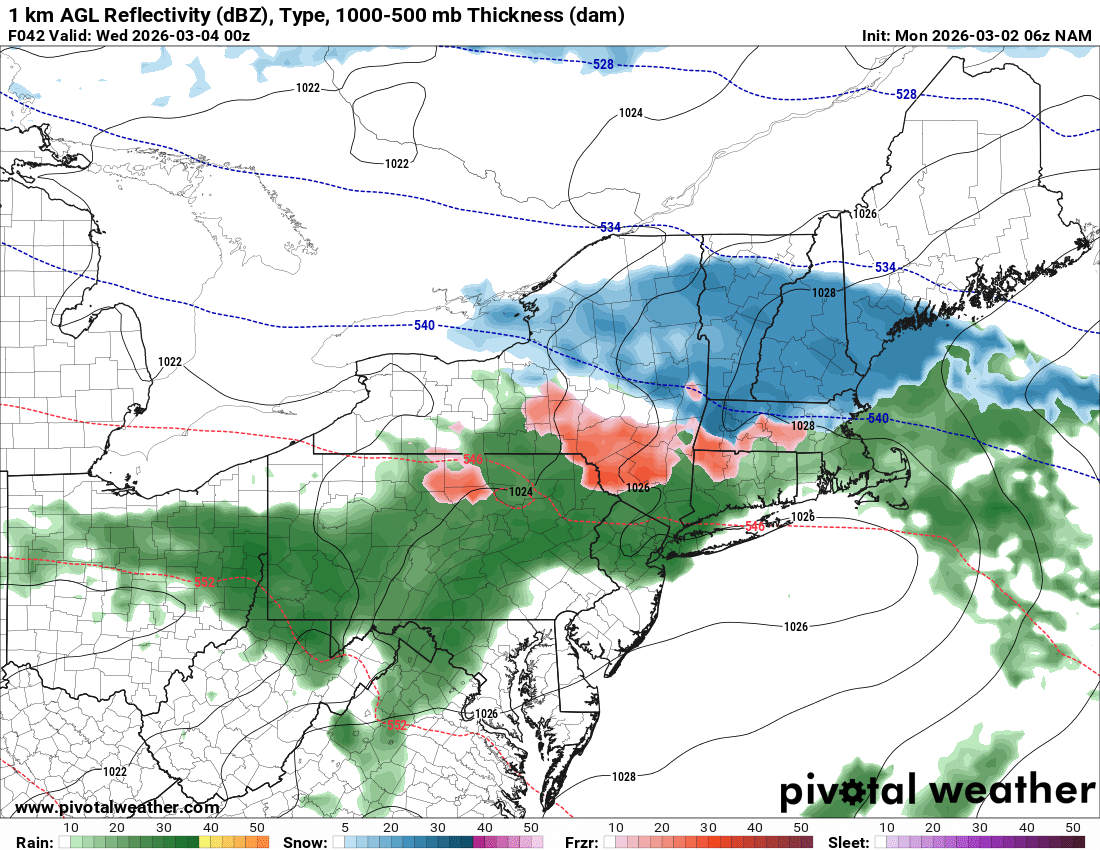
thats the 12z nam and whats wrong with this?
-
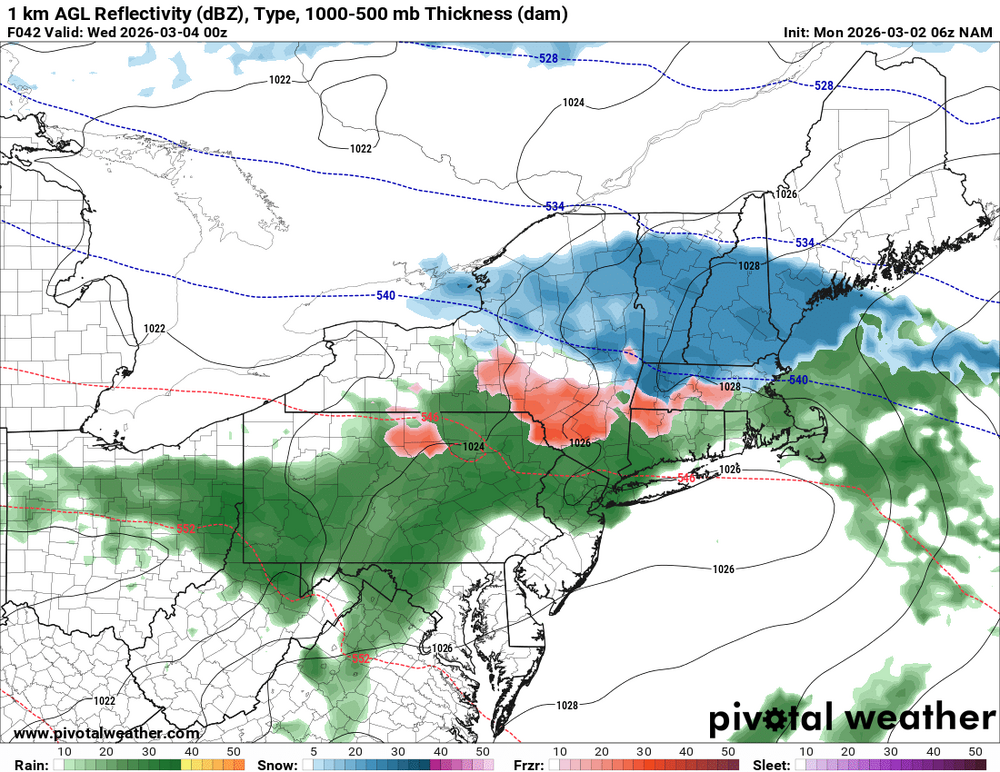
Models suggest 1-3" of snow, sleet, ZR before transitioning to all rain for south of the MA -VT/NH border
-

Outta gas and Outta Time: Early March Winter Storm finale
snowfan replied to Ji's topic in Mid Atlantic
Not a surprise not a rug pull. Also consistent w WPC guidance. -
It's imperialistic ... tough shit And anyone that says shit like 'above your paid grade' is trying to elicit toeing the line. Everyone alive has a moral imperative/responsibility to understanding the reality humanity creates, and act accordingly.
-
The winter of 2025-6 had only 18 of its 90 days with a WPO >0. That’s the lowest # of days since the very cold winter of 1962-3, which had only 11 (lowest number of any since 1948-9). 1956-7 had only 16. So, 2025-6 had the 3rd lowest. I think 1967-8 is in 4th with 21 of its 91 days >0: https://downloads.psl.noaa.gov/Public/map/teleconnections/wpo.reanalysis.t10trunc.1948-present.txt
-
Prepare for drought busting and shorts in December
-

2025-2026 ENSO
PhiEaglesfan712 replied to 40/70 Benchmark's topic in Weather Forecasting and Discussion
Yeah, we should pin the 2026-27 el nino thread, and unpin the 2023-24 el nino. -

Outta gas and Outta Time: Early March Winter Storm finale
Weather Will replied to Ji's topic in Mid Atlantic
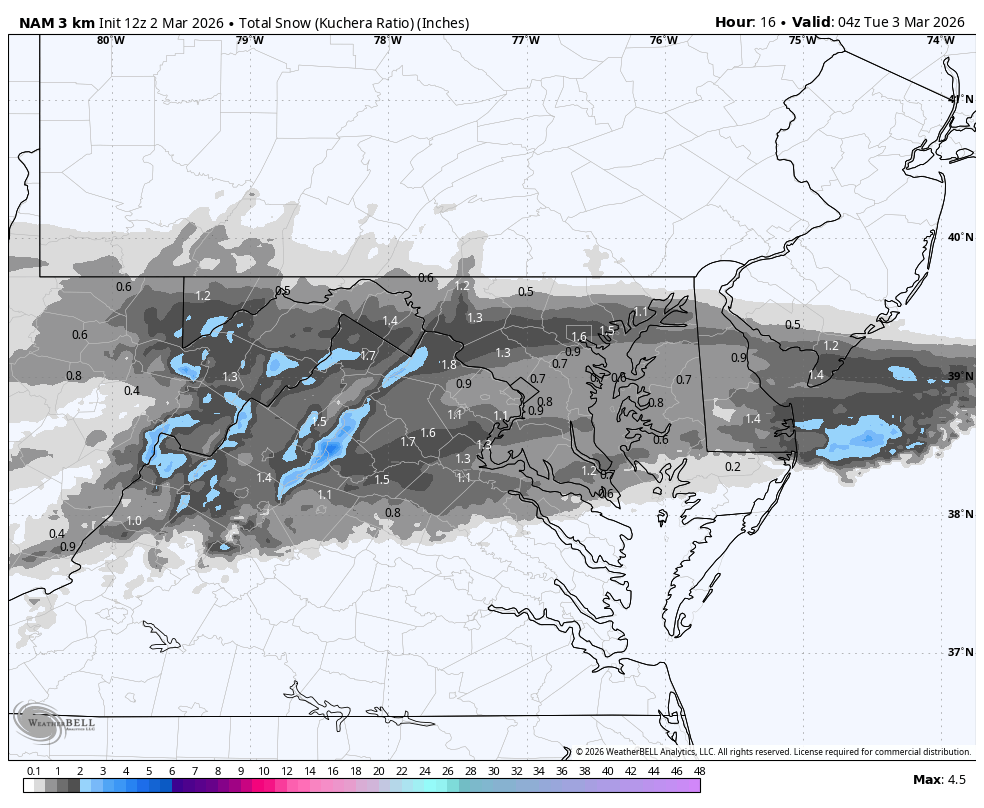
Not much expectation east of the mountains for snow today. All the models seemed to be fizzling out at 6Z and so has the latest WB 12Z 3K NAM. Our typical rug pull at the last minute.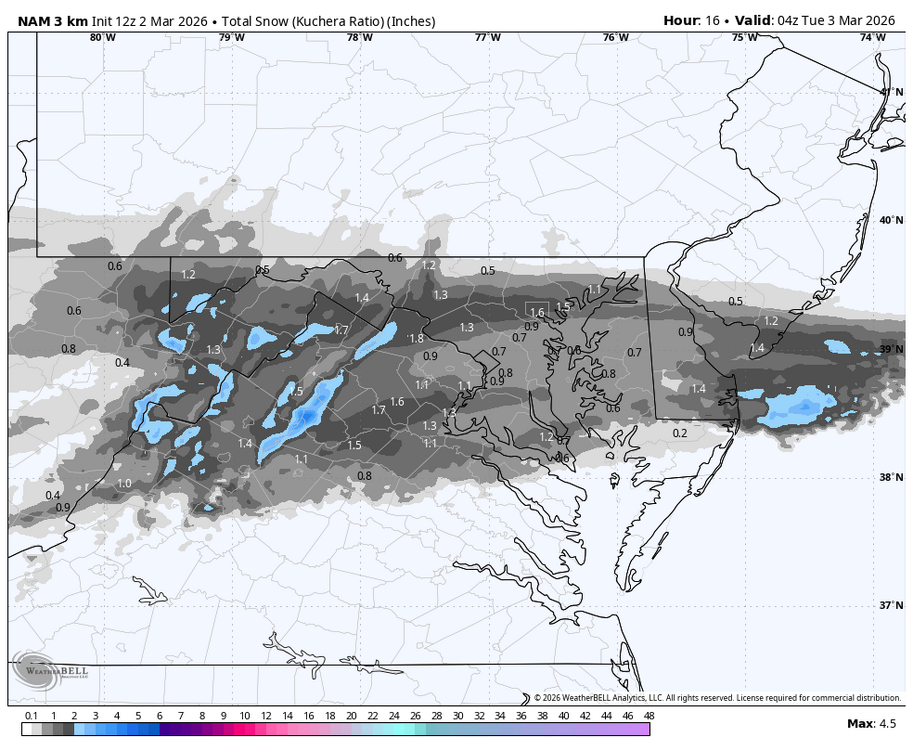
-
Long game being used. Way way above your pay grade. Put it this way China ain't invading Taiwan and they will be buying our oil. New sheriff in town. Finally took out the most evil people on earth. Rest in hell
-
Hopefully the snow melt and projected rain going forward tames brush fire season which starts soon. 3/15-5/15 is the annual burn ban in NY to help mitigate wildfire season….
-

Central PA Winter 25/26 Discussion and Obs
Mount Joy Snowman replied to MAG5035's topic in Upstate New York/Pennsylvania
Low of 21. Tomorrow morning’s commute could be dicey in some areas. -
We were on school trip in mid March in the early 1970s with t-shirt weather. Think it was near 80 felt like 100 to us after being in snow and cold.
-
If oil prices go up, it is a profit grab, ...not because of supply. Recent geological studies combined with advances in extraction technology have discovered that the U.S. and Canada have nearly 200 billion barrels of technically recoverable shale oil. One potential "real reason" for these quasi imperialistic military operations abroad is to choke-hold oil resources; in other words, a move to hegemony over the world. It's not necessarily because the U.S. even needs it ... but because like all acts of imperialism, the strategy is to control resources. China had been moving on Venezuela for some time to secure ... however they could imply ownership. Meanwhile, it just so happens to be ... China is the biggest export/foreign purchaser of Iran exports. It also just so happens to be, China is situated as the U.S.'s greatest potential competitor, if not adversary, in establishing world dominance - the primary ambition of the imperialist agenda. That's what the U.S. has become. some how. some way.
-
Records: Highs: EWR: 78 (1972) NYC: 72 (1972) LGA: 67 (2004) JFK: 64 (1985) Lows: EWR: 12 (1950) NYC: 9 (1891) LGA: 13 (1962) JFK: 12 (1980) Historical: 1846 - A great storm hit Virginia and the Carolinas. The storm caused half a million dollars damage, and in North Carolina drowned fifty families and a thousand cattle on Notts Island. (David Ludlum) 1927 - Raleigh, NC, was buried under 17.8 inches of snow in 24 hours, a record for that location. Nashville NC received 31 inches of snow. The average snow depth in the state of Carolina was fourteen inches. (The Weather Channel) 1927: Nor'easter high winds gusted to 62 mph at Cape Henry and 52 mph at Norfolk, VA. Heavy snow fell across North Carolina into Virginia and travel was delayed for two to three days. In Virginia Beach, high tide and heavy surf on March 2 inflicted considerable damage. The beaches in some places were washed back 50 feet and denuded of the overlying sand, exposing the clay beneath. (Ref. Virginia Weather History) 1975 - The governor's Tornado&puot; in Atlanta did considerable damage to the governor's mansion and surrounding areas resulting in three deaths and 56.5 million dollars damage. (The Weather Channel) 1983: An unusual warning to residents of Lake Tahoe, CA: they were advised not to go out cross country skiing as they might ski into power lines. The snow depth was an amazing 215 inches. A major coastal storm ripped out several hundred feet of the Santa Monica pier. (Ref. Wilson Wx. History) 1985 - A massive winter storm struck the Northern Plains Region. The storm produced up to 33 inches of snow in northeastern South Dakota, at Summit and at Milbank, and also produced high winds which whipped the heavy snow into drifts twenty feet high. (Storm Data) 1987 - A storm in the northeastern U.S. produced heavy snow in Maine, with 16 inches reported at West Grand Lake and Guilford. (The National Weather Summary) (Storm Data) 1988 - Thunderstorms produced severe weather in the south central U.S. A tornado at Baton Rouge LA injured two persons, and another tornado caused five million dollars damage at the airport in Lafayette LA. (The National Weather Summary) (Storm Data) 1989 - Snow and high winds plagued the western U.S. Up to 16 inches of snow was reported south of Seattle WA, and more than two feet of snow blanketed the Sierra Nevada Range of California. Winds gusted to 89 mph at Hidden Peak UT, and reached 92 mph at Peavine CA. (The National Weather Summary) (Storm Data) 1990 - Mild weather continued across the northern tier of states. Highs of 52 degrees at Saint Johnsbury VT, 63 degrees at Olympia WA, and 64 degrees at Seattle WA were records for the date. (The National Weather Summary) 1996: Another East Coast snowstorm deposited 4.6 inches of snow at Central Park in New York City to bring its seasonal snowfall total to 66.3 inches, breaking the old season snowfall record of 63.2 inches set in 1947-48. (Ref. Wilson Wx. History) 1998: Lead, SD sets record 9-day snowstorm with a total of 103 inches. (Bob Ryan's 2002 Almanac) 2001: Both Caribou and Bangor, ME set a new all-time March record low temperatures with -28 °F and -16 °F., respectively. (Ref. Wilson Wx. History) 2005: Waterspouts were recorded in Redondo Beach in southern California. Pea size hail accumulated to a depth of one inch on Huntington Beach. 2012: The March 2 and 3, 2012, a deadly tornado outbreak occurred over a large section of the Southern United States into the Ohio Valley region. The storms resulted in 41 tornado-related fatalities, 22 of which occurred in Kentucky. Tornado-related deaths also occurred in Alabama, Indiana, and Ohio. The outbreak was the second deadliest in early March for the U.S. since official records began in 1950. Only the 1966 Candlestick Park tornado had a higher death toll for a tornadic system in early March. Click HERE for more information from the NWS Louisville, Kentucky.