All Activity
- Past hour
-

September 2025 OBS-Discussion centered NYC subforum
NorthShoreWx replied to wdrag's topic in New York City Metro
I have never been able to unravel the mystery of airport snow-depth reporting. -
another in a long line of excellent posts!
-
Welcome! Also, in non new met news - had a bald eagle cruise past me about head high over by the bridge .7 miles south of Monkton Station on the NCR trail while I was walking my labs this AM. He/she landed on a branch about 30 yards from the bridge hanging over the river. Absolutely awesome in all respects. Breath-taking being that close to one.
-
Up to 3.85" for the month now (3.53" avg), and that looks to be about it for a while. Another foggy, misty AM. Sun broke out for a while yesterday aftrn before the fog rolled in again. Today, and tomorrow look to be about the same set up before things change. BTW, MRCC has a new website now. Very cool with a lot more tools on deck. https://mrcc.purdue.edu/
-

September 2025 OBS-Discussion centered NYC subforum
steve392 replied to wdrag's topic in New York City Metro
OMG that is just glorious! -
sun is sloped and tepid, getting more sloped and cooler ... soon 60+ dps will only make the side streets sweat - nothing else of consequence. the reason is because the sun doesn't dump in enough energy to keep both a higher dp air mass afloat, while also providing enough energy to simultaneously elevate the kinetic temperature. granted this is all more so the environmental limitation (at this latitude) by mid oct+ ... but is already more challenging.
-
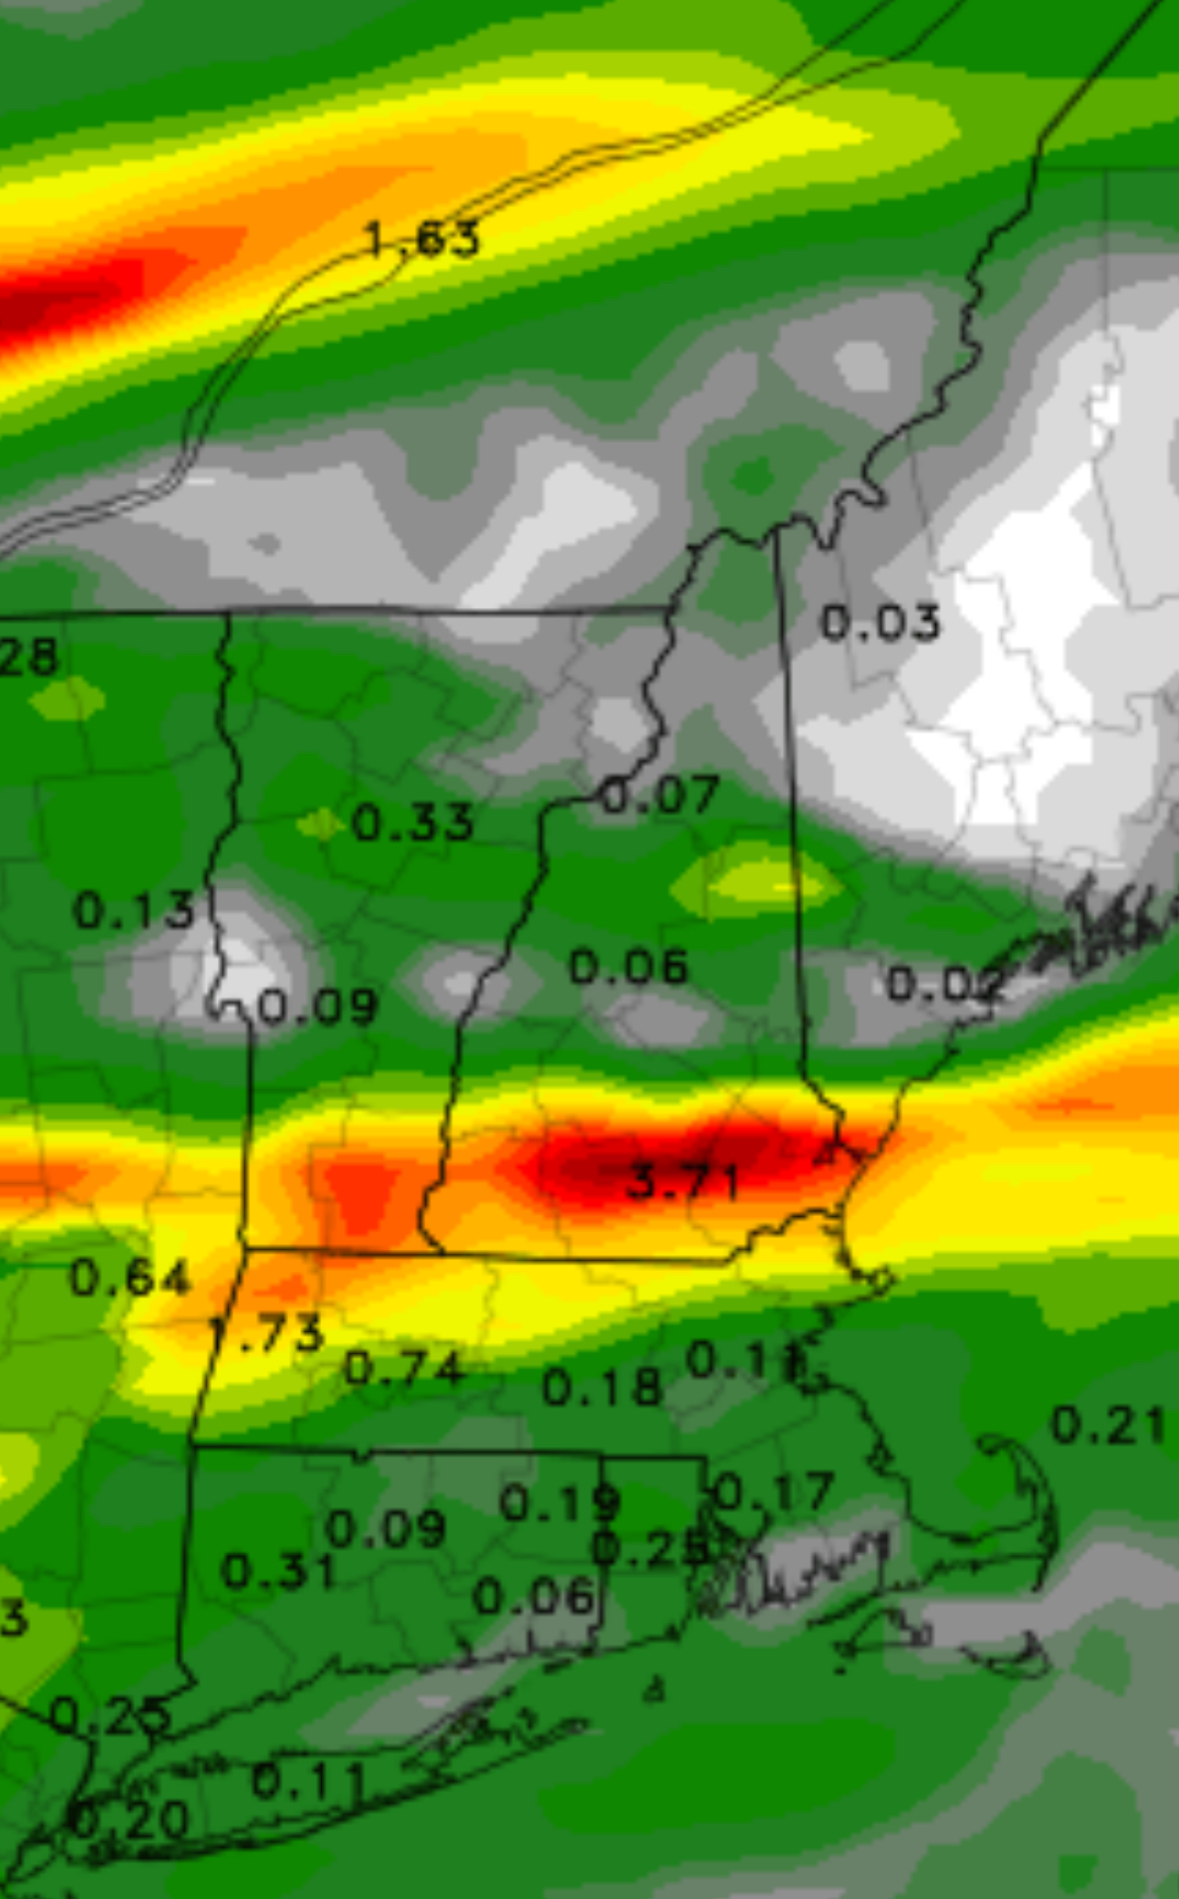
That is an absurdly narrow band of high QPF. You have to think it’s a little more widespread than that.
-

September 2025 OBS-Discussion centered NYC subforum
LibertyBell replied to wdrag's topic in New York City Metro
This looks like a good pattern for snowy noreasters in the winter if we get the right storm tracks. Forget tropical threats I'm completely over the tropical *season* or lack thereof. -
Perfect clear blue sky down in Calvert right now. I didn't see any clouds this morning.
-
That's awful.
-
September 2025 OBS-Discussion centered NYC subforum
LibertyBell replied to wdrag's topic in New York City Metro
We had PD1 in February that winter that fringed the area but was still enough for over a foot of snow for the city and Long Island. I wonder if anyone on the south shore saw close to 20 inches in that storm? -
Recon will shortly tell us more.
-

September 2025 OBS-Discussion centered NYC subforum
SACRUS replied to wdrag's topic in New York City Metro
Current SST anolaly -
September 2025 OBS-Discussion centered NYC subforum
LibertyBell replied to wdrag's topic in New York City Metro
1983 was definitely the hottest summer here (and hottest until 2010), but what I find incredible about 1983's summer heat was that it was also our wettest year on record. We dried out enough for the summer for all that record heat from June through September!!!! -
3k is nooseworthy too.
-
Kidding aside, if CON-MHT pull 2-4” and I’m counting hundredths I may need to leave the board.
-

September 2025 OBS-Discussion centered NYC subforum
donsutherland1 replied to wdrag's topic in New York City Metro
Driest Year during the 1980s: National: 1988 Northeast: 1980 New York City: 1981 Driest September-August during the 1980s: National: 1987-1988 Northeast: 1984-1985 New York City: 1980-1981 Driest Summer during the 1980s: National: 1980 Northeast: 1983 New York City: 1981 -
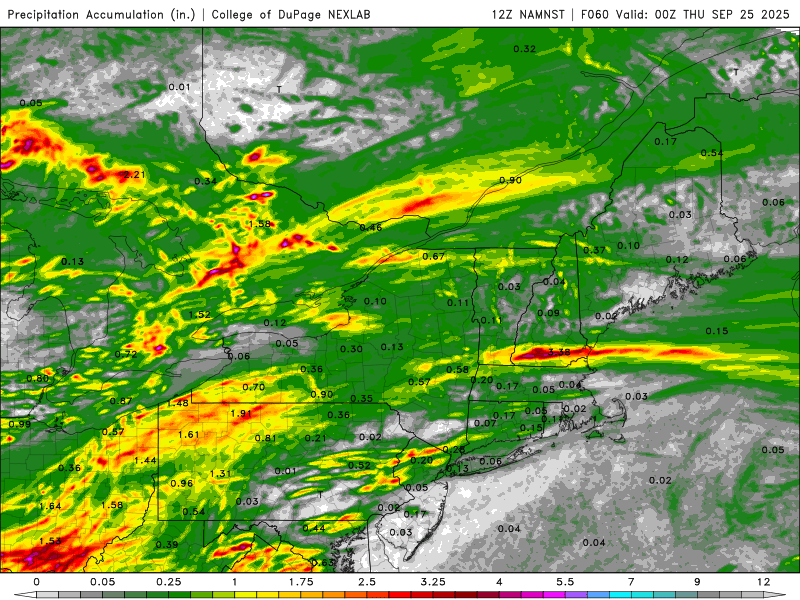
DOJ just released the 12z NAM

-

September 2025 OBS-Discussion centered NYC subforum
bluewave replied to wdrag's topic in New York City Metro
Still the coldest 14 day period at Islip. Minimum 14-Day Mean Avg Temperature for ISLIP-LI MACARTHUR AP, NY Click column heading to sort ascending, click again to sort descending. Period of record: 1963-09-05 to 2025-09-21 1 11.4 1979-02-06 through 1979-02-19 0 2 11.5 1979-02-07 through 1979-02-20 0 3 11.9 1979-02-05 through 1979-02-18 0 4 12.5 1979-02-08 through 1979-02-21 0 5 13.4 1979-02-04 through 1979-02-17 0 6 13.8 1979-02-09 through 1979-02-22 0 7 14.6 1967-12-31 through 1968-01-13 0 8 14.8 1967-12-30 through 1968-01-12 0 9 15.0 1979-02-03 through 1979-02-16 0 10 15.4 1979-02-10 through 1979-02-23 0 11 15.5 1968-01-01 through 1968-01-14 0 12 15.9 1979-02-02 through 1979-02-15 0 13 16.0 1967-12-29 through 1968-01-11 0 14 16.3 1968-01-02 through 1968-01-15 0 15 16.3 1968-01-04 through 1968-01-17 0 16 16.5 1979-02-01 through 1979-02-14 0 - 16.5 1968-01-05 through 1968-01-18 0 17 16.8 1968-01-03 through 1968-01-16 0 18 17.2 1977-01-11 through 1977-01-24 0 19 17.4 2017-12-26 through 2018-01-08 0 20 17.4 1981-01-01 through 1981-01-14 0 21 17.5 1981-01-03 through 1981-01-16 0 - 17.5 1981-01-02 through 1981-01-15 0 22 17.7 1980-12-31 through 1981-01-13 0 - 17.7 1967-12-28 through 1968-01-10 0 1979-02-06 25 13 19.0 -12.9 46 0 0.00 0.0 0 1979-02-07 22 13 17.5 -14.5 47 0 0.65 6.5 0 1979-02-08 30 17 23.5 -8.6 41 0 0.03 0.3 7 1979-02-09 19 8 13.5 -18.7 51 0 0.00 0.0 6 1979-02-10 15 -1 7.0 -25.4 58 0 0.00 0.0 5 1979-02-11 11 -2 4.5 -28.0 60 0 0.00 0.0 4 1979-02-12 15 -6 4.5 -28.2 60 0 0.09 0.9 2 1979-02-13 12 5 8.5 -24.3 56 0 T T 3 1979-02-14 13 -1 6.0 -27.0 59 0 0.00 0.0 3 1979-02-15 20 9 14.5 -18.6 50 0 T T 2 1979-02-16 18 8 13.0 -20.3 52 0 0.02 0.2 1 1979-02-17 10 0 5.0 -28.5 60 0 0.00 0.0 1 1979-02-18 14 -2 6.0 -27.7 59 0 0.00 0.0 1 1979-02-19 24 10 17.0 -16.9 48 0 0.88 8.8 2 -
September 2025 OBS-Discussion centered NYC subforum
LibertyBell replied to wdrag's topic in New York City Metro
1994: A nor’easter wreaked havoc on coastal MD. 50-mph winds (gusts to 79 mph) destroyed 100’s of tents/vending areas at the end-of-summer Sunfest in Ocean City. Windblown fires burned several shops along the boardwalk; 9 foot waves flooded other areas. Damage up to $5 million. (Ref. Weather Guide Calendar with Phenomenal Weather Events 2011 Accord Pub. 2010, USA) I think I remember this-- did we have 5-5.50 inches of very heavy rainfall during this? I remember this because I was on I-80 in NJ when this happened. I also remember an August noreaster which gave us very heavy rain during the 90s. There was even some snow reported on Mt Washington in that one. -
Hope no one uninstalled
-
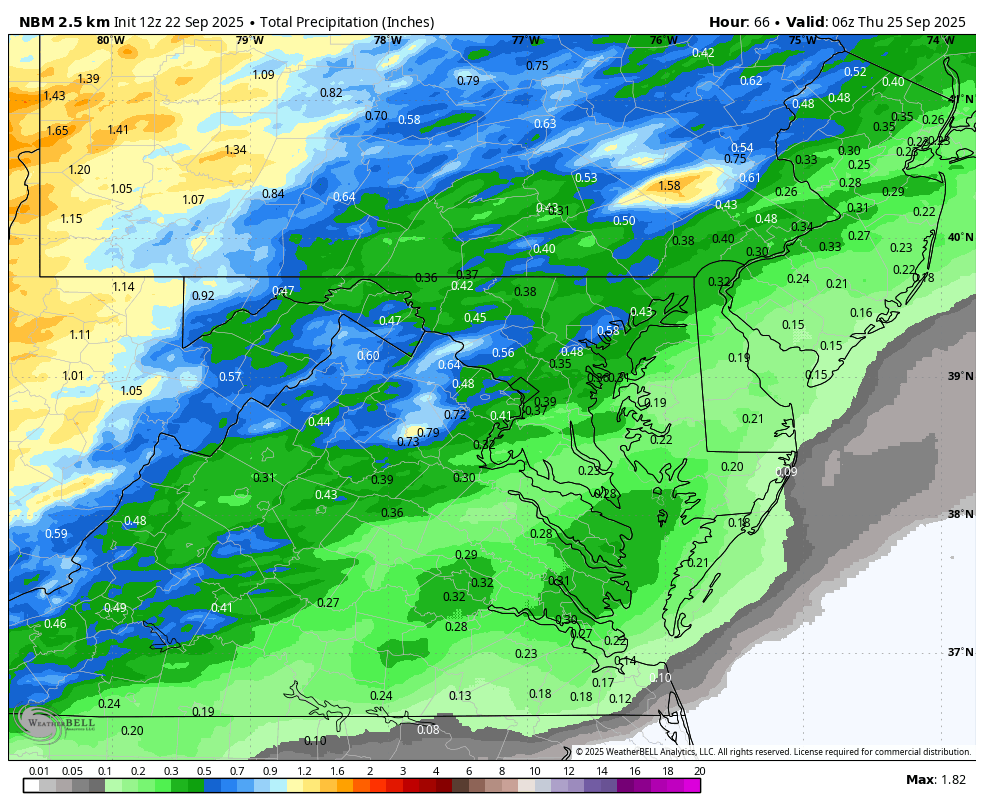
Yup, still cloudy here....12Z WB NBM thru Wed. Bring in rains tomorrow afternoon.

-
September 2025 OBS-Discussion centered NYC subforum
LibertyBell replied to wdrag's topic in New York City Metro
1978-79 was one of the coldest winters on record nationally, we might never see that kind of extensive cold ever again. -
Looks like it’s cloudier west of 95 on satellite. I’m assuming it thins out as milder air moves in.
-
Peak Season Forecast (Aug 20-Oct 20) Named Storms: 10 (2) Hurricanes: 6 (1) Major Hurricanes: 3 (1) Fernand, Gabrielle (MH) Thank you Gabby! More likely on the way.


.thumb.png.4150b06c63a21f61052e47a612bf1818.png)