All Activity
- Past hour
-
It’s rare in the lower elevations and about a once-every-five-year occurrence in the mountains. Belgrade’s first snowfall is typically November 30 (earliest: October 7, 1897: Trace).
-
FWIW…
-
Eastern queens is suburban and has lots of parks and wooded areas. (Alley pond park, Cunningham Park) so it’s not a surprise
-
Low of 45 last two mornings. Glorious out
-
I've tended to shy away from ONI alone and incorporate for SOI/MEI/RONI/ENS-ONI but with that I am a bit uncertain as to how much we really develop into La Nina but even with a Nina, I am unsure how "Nina like" the atmosphere will truly be. Thanks for linking that paper, gave a quick breeze through but need to read it in full later. I certainly could see periods where MJO activity is favorable or more favorable for us, but the question is, how favorable? If/when we get MJO activity into the favorable phases, how strong will the MJO signal be and how much weight will it have? But I really want to see how the hemisphere evolves through the remainder of this month and first half of November.
-
Interesting. It was relatively cool up here with BDL only +.9. Needed AN the last 8 days of the month just to get there.
-

Spooky Season (October Disco Thread)
WxWatcher007 replied to Prismshine Productions's topic in New England
Low of 41.1 here in EH -
how common is the balkan snowstorm that's happening the past few days?
-
Highly unlikely. Since 1869, only 1891 (October 5) and 2002 (October 7) had the last 70 or above high on or before October 7 at Central Park. Records go back to 1869.
-
I found a couple of nearby Ambient stations that dropped to 47 degrees, like a couple miles SE of me.
-
isnt this normal/expected (for the IPWP) in +TNH cluster winters? although you are certainly right with the warmest waters being between 140-160E, -QBO increases instability in the UTLS which should fuel more active/stronger convection on the equator, but since the Nina is east-based/not very strong, theoretically, MJO propogation should be able to make it into more favorable phases at times https://journals.ametsoc.org/view/journals/clim/36/3/JCLI-D-22-0010.1.xml
-
-
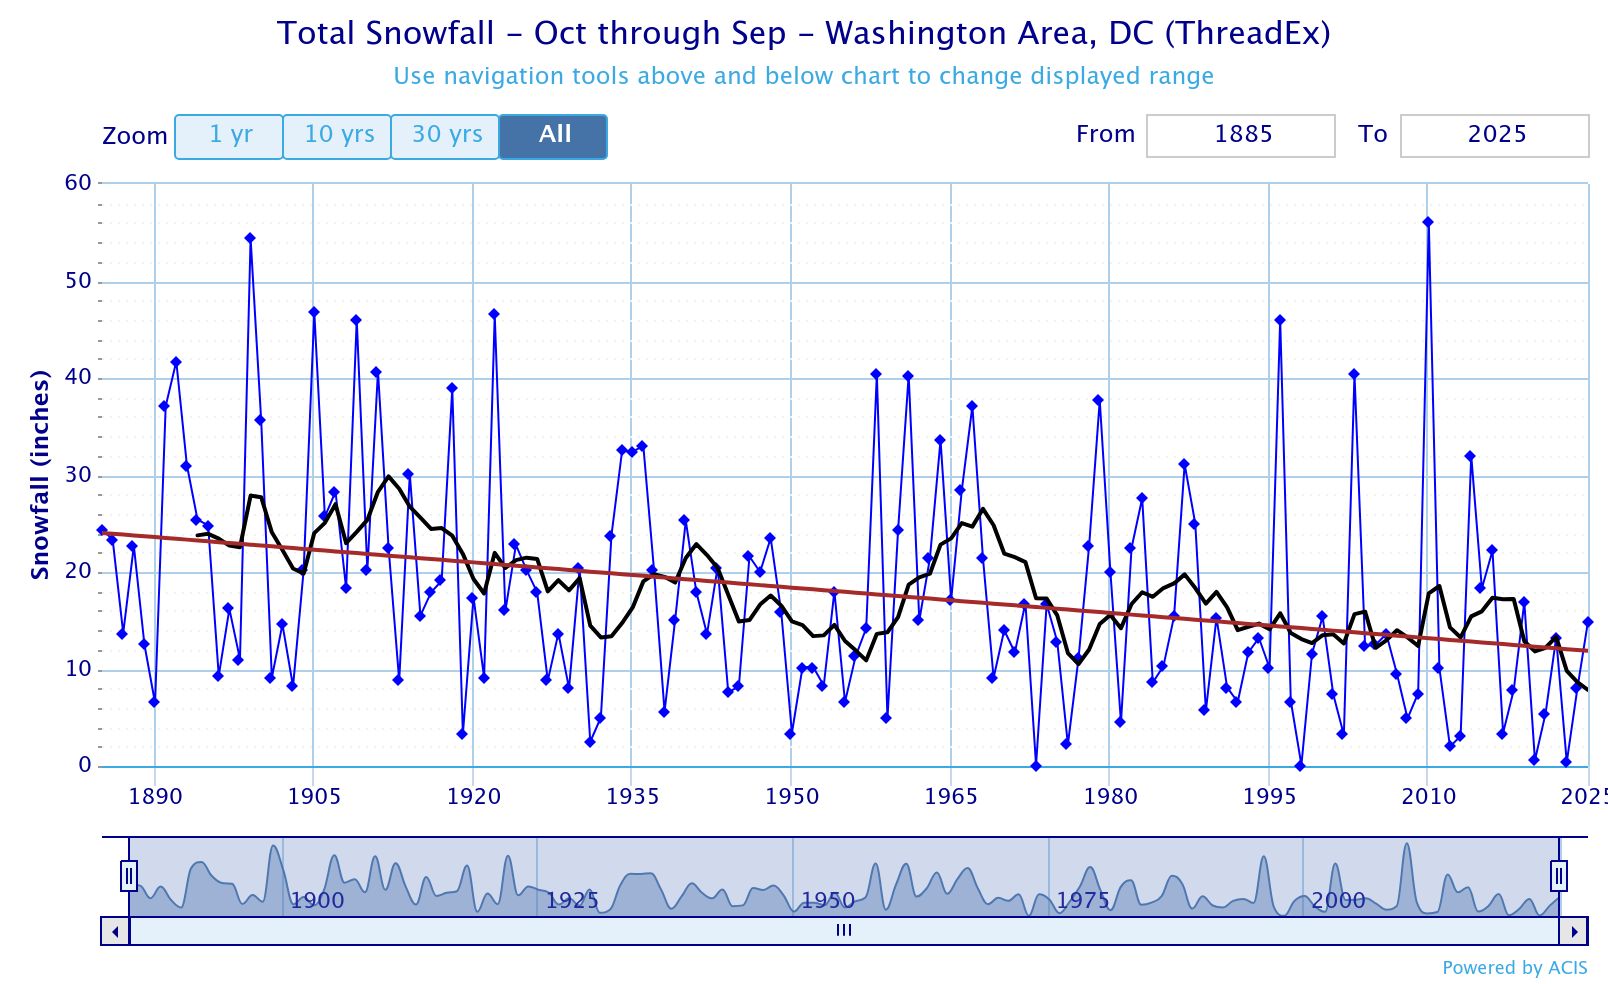
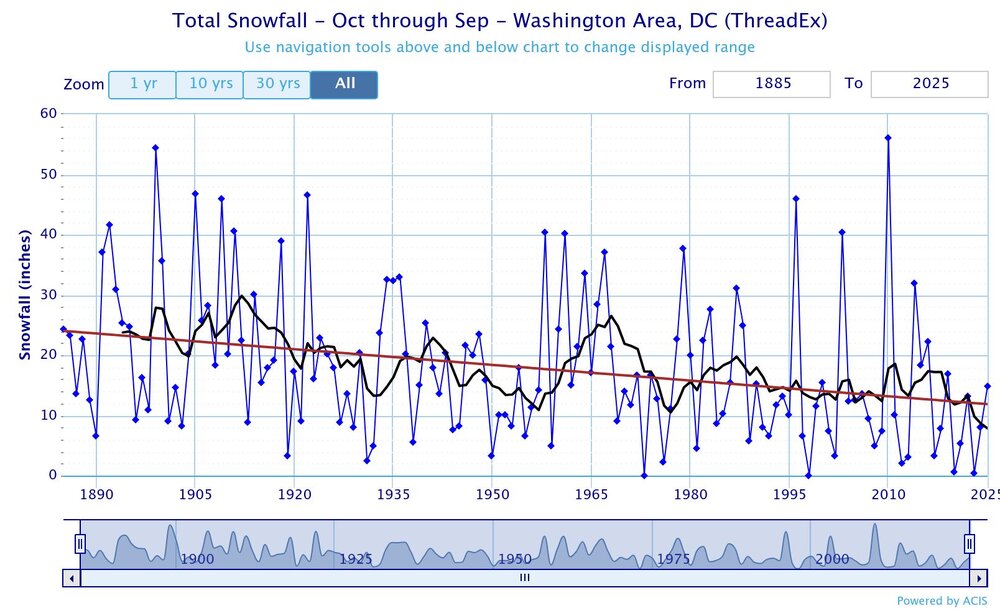
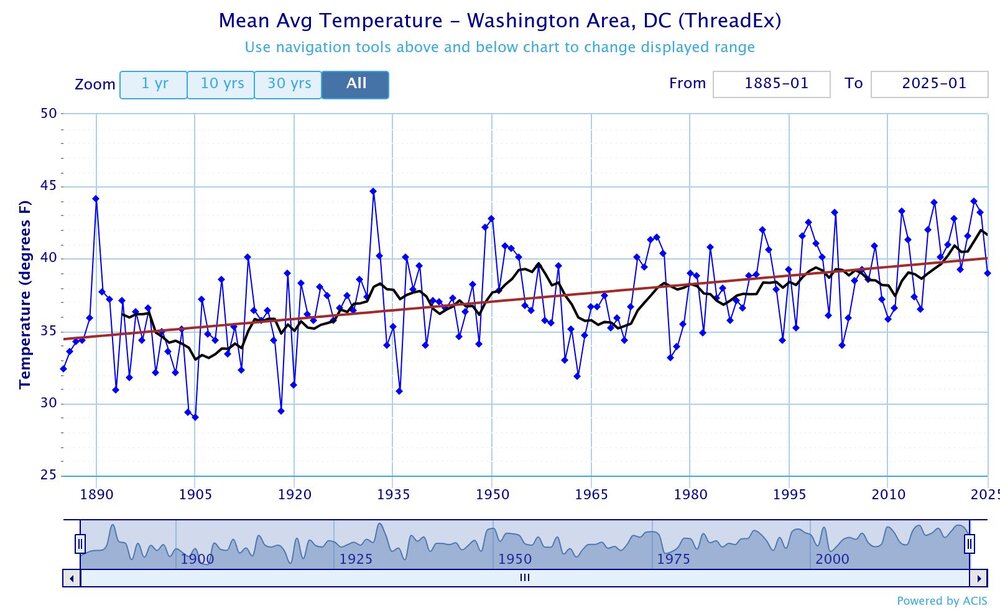
Those rebounds occurred back in a much colder climate. So previous snow droughts were a function of dry patterns and not too much warmth like we have seen in the last decade. DC has been experiencing a long term snowfall decline as the winters have been warming. So unless the winters stop warming, the long decline will continue. Hard to say if the next 9 years declines more, holds steady, or bounces a little off the current record lows. But it’s too warm now for a strong rebound like was the case for past 9 year lows with the 9 year means getting back above 20”. it would probably take VEI 7 eruption to cool the winters enough for a more significant rebound next 9 years. But long range volcanic forecasting is still very low skill. Plus the effects of large eruptions would only be temporary lasting several years. 9 year running mean snowfall is black line and the trend line is red
-
It would almost certainly be a miss of the Conus if it were to be a TC E of 55W per history. There hasn’t been on record even one TC existing E of 55W after October 4th that made it all of the way to the Conus! (I’ve checked all of the years.) That doesn’t mean it’s impossible and that it won’t eventually happen. But that does mean the chance is tiny. OTOH, it is were to be very slow to develop and wait, say, til near the Lesser Antilles or further W, then there would no longer be the near certainty of a Conus miss. It might then still be a likelihood but not a near certainty looking from this far out.
-
Low temp of 47°.
-

Spooky Season (October Disco Thread)
Damage In Tolland replied to Prismshine Productions's topic in New England
Not seeing it -
Thats a great stat. Had to of been close a few days tho. What a run we've been on since mid August. Top shelf cali weather. Looks like possibly the last 80 degree days coming up. You would think eventually we're going to start to get some precipitation and hopefully that happens with the temps crashing soon. Were due for a harsh winter, temps and snow wise.
-
45 here. Stopped dropping around 2 am, lower spots in town dropped to 43/44. Getting used to not being in the pit and radiating well.
-

Spooky Season (October Disco Thread)
Typhoon Tip replied to Prismshine Productions's topic in New England
Another in these so-called 'fake cold' mornings.. 37 with car top frozen dew, nothing on the lawn though. Meanwhile, 45 was the low up on the hill at Worcester AP. Up to 57 ... goodly bounce is going on. Looking at NAM soundings... should be about 76 if it were July, but with sloped tepid October sun, maybe just a 70 nick. Not sure... it's getting late in the solar shoulder season and we're really only 4 weeks from entering the perennial min so some challenges. -
-
Chris, Who’s to say that the next 9 seasons won’t jump back somewhat given that 2016-7 through 2024-5 was the lightest 9 year avg on record? Consider this: 1948-9 through 1956-7 averaged only 10.9”, which at the time was the lightest 9 season avg on record and was much lower than the 17.6” of the prior 9 season avg: Monthly Total Snowfall for Washington Area, DC (ThreadEx) Mean 0.0 0.0 0.0 T 1.4 1.8 4.4 1.4 1.9 0.0 T T 10.9 1948-1949 0.0 0.0 0.0 0.0 T 4.4 7.4 4.0 T 0.0 0.0 0.0 15.8 1949-1950 0.0 0.0 0.0 0.0 T T 0.3 T 3.1 T 0.0 0.0 3.4 1950-1951 0.0 0.0 0.0 0.0 1.6 3.8 0.8 3.0 1.0 0.0 T 0.0 10.2 1951-1952 0.0 0.0 0.0 0.0 T 4.8 1.6 T 3.8 T 0.0 T 10.2 1952-1953 0.0 0.0 0.0 0.0 1.7 2.0 1.3 0.2 3.1 T 0.0 T 8.3 1953-1954 0.0 0.0 0.0 T 6.7 T 11.3 T T T 0.0 0.0 18.0 1954-1955 0.0 0.0 0.0 T 0.0 0.1 2.3 4.2 T 0.0 0.0 0.0 6.6 1955-1956 0.0 0.0 0.0 0.0 2.3 0.5 4.5 T 4.0 0.0 0.0 0.0 11.3 1956-1957 0.0 0.0 0.0 0.0 T 0.2 10.1 1.6 2.2 0.1 0.0 0.0 14.2 The subsequent 9 seasons jumped way up to 25.0”, one of their heaviest 9 season stretches: Monthly Total Snowfall for Washington Area, DC (ThreadEx) Mean 0.0 0.0 0.0 T 0.2 5.1 6.8 7.9 4.9 0.0 T 0.0 25.0 1957-1958 0.0 0.0 0.0 T 0.3 12.0 0.3 17.2 10.6 0.0 0.0 0.0 40.4 1958-1959 0.0 0.0 0.0 0.0 T 0.9 4.0 T T T 0.0 0.0 4.9 1959-1960 0.0 0.0 0.0 0.0 T T T 7.2 17.1 0.0 0.0 0.0 24.3 1960-1961 0.0 0.0 0.0 0.0 T 8.7 13.6 18.0 T T 0.0 0.0 40.3 1961-1962 0.0 0.0 0.0 0.0 1.3 1.2 2.0 6.5 4.0 0.0 0.0 0.0 15.0 1962-1963 0.0 0.0 0.0 0.0 T 16.2 2.1 2.0 1.1 0.0 T 0.0 21.4 1963-1964 0.0 0.0 0.0 0.0 T 6.4 8.9 11.7 6.2 0.4 0.0 0.0 33.6 1964-1965 0.0 0.0 0.0 0.0 0.2 0.5 9.1 1.9 5.4 0.0 0.0 0.0 17.1 1965-1966 0.0 0.0 0.0 0.0 0.0 0.2 21.3 6.9 T 0.0 0.0 0.0 28.4 ————— Then 1968-9 through 1976-7 attained a new 9 season record low of 10.5”: Monthly Total Snowfall for Washington Area, DC (ThreadEx) Click column heading to sort ascending, click again to sort descending. Mean 0.0 0.0 0.0 T 0.2 2.7 3.0 3.5 1.0 0.1 0.0 0.0 10.5 1968-1969 0.0 0.0 0.0 0.0 T T 0.2 2.2 6.7 0.0 0.0 0.0 9.1 1969-1970 0.0 0.0 0.0 0.0 T 6.8 3.6 3.6 T 0.0 0.0 0.0 14.0 1970-1971 0.0 0.0 0.0 0.0 T 5.2 4.8 0.3 1.4 T 0.0 0.0 11.7 1971-1972 0.0 0.0 0.0 0.0 1.4 0.1 0.3 14.4 T 0.6 0.0 0.0 16.8 1972-1973 0.0 0.0 0.0 T T 0.0 T 0.1 T T 0.0 0.0 0.1 1973-1974 0.0 0.0 0.0 0.0 0.0 11.0 1.5 4.2 T T 0.0 0.0 16.7 1974-1975 0.0 0.0 0.0 T T 0.1 6.6 5.8 0.3 T 0.0 0.0 12.8 1975-1976 0.0 0.0 0.0 0.0 0.0 0.4 0.1 0.9 0.8 0.0 0.0 0.0 2.2 1976-1977 0.0 0.0 0.0 0.0 0.8 0.6 9.7 0.0 0.0 T 0.0 0.0 11.1 That new record low had followed the prior 9 season avg of 26.5”: Monthly Total Snowfall for Washington Area, DC (ThreadEx) Click column heading to sort ascending, click again to sort descending. Mean 0.0 0.0 0.0 0.0 0.9 6.2 6.8 8.4 4.2 0.0 T 0.0 26.5 1959-1960 0.0 0.0 0.0 0.0 T T T 7.2 17.1 0.0 0.0 0.0 24.3 1960-1961 0.0 0.0 0.0 0.0 T 8.7 13.6 18.0 T T 0.0 0.0 40.3 1961-1962 0.0 0.0 0.0 0.0 1.3 1.2 2.0 6.5 4.0 0.0 0.0 0.0 15.0 1962-1963 0.0 0.0 0.0 0.0 T 16.2 2.1 2.0 1.1 0.0 T 0.0 21.4 1963-1964 0.0 0.0 0.0 0.0 T 6.4 8.9 11.7 6.2 0.4 0.0 0.0 33.6 1964-1965 0.0 0.0 0.0 0.0 0.2 0.5 9.1 1.9 5.4 0.0 0.0 0.0 17.1 1965-1966 0.0 0.0 0.0 0.0 0.0 0.2 21.3 6.9 T 0.0 0.0 0.0 28.4 1966-1967 0.0 0.0 0.0 0.0 T 16.1 1.3 19.0 0.7 0.0 0.0 0.0 37.1 1967-1968 0.0 0.0 0.0 0.0 6.9 6.3 2.8 2.4 3.0 0.0 0.0 0.0 21.4 And the new record low 9 season 1968-9 through 1976-7 avg of 10.5” was followed by an 18.8” 9 season mean for 1977-8 through 1985-6: Monthly Total Snowfall for Washington Area, DC (ThreadEx) Click column heading to sort ascending, click again to sort descending. Mean 0.0 0.0 0.0 0.0 0.4 1.1 6.7 8.7 1.8 T 0.0 0.0 18.8 1977-1978 0.0 0.0 0.0 0.0 0.1 0.2 10.3 3.8 8.3 0.0 0.0 0.0 22.7 1978-1979 0.0 0.0 0.0 0.0 3.1 T 4.0 30.6 T 0.0 0.0 0.0 37.7 1979-1980 0.0 0.0 0.0 0.3 0.0 T 8.6 5.1 6.1 0.0 0.0 0.0 20.1 1980-1981 0.0 0.0 0.0 0.0 T 0.3 4.2 T T 0.0 0.0 0.0 4.5 1981-1982 0.0 0.0 0.0 0.0 T 1.7 15.3 5.3 0.2 T 0.0 0.0 22.5 1982-1983 0.0 0.0 0.0 0.0 0.0 6.6 T 21.0 0.0 T 0.0 0.0 27.6 1983-1984 0.0 0.0 0.0 0.0 0.3 T 6.5 T 1.8 T 0.0 0.0 8.6 1984-1985 0.0 0.0 0.0 0.0 T 0.3 10.0 T T T 0.0 0.0 10.3 1985-1986 0.0 0.0 0.0 0.0 0.0 0.7 1.8 12.9 T T 0.0 0.0 15.4 ————— So, in summary: 1939-40 through 1947-8: 17.6” 1948-9 through 1956-7: 10.9” 1957-8 through 1965-6: 25.0” 1959-60 through 1967-8: 26.5” 1968-9 through 1976-7: 10.5” 1977-8 through 1985-6: 18.8” 2007-8 through 2015-6: 15.9” 2016-7 through 2024-5: 7.8” 2025-6 through 2033-4: ??? Maybe 2025-6 through 2033-4 will jump back up a nice amount. It wouldn’t at all surprise me if it were to jump back up to ~12-15”. And then perhaps it would drop back down. Obviously nobody knows. Yes, it’s overall been headed down with the warming, which is intuitive. But I assume we can agree it’s nowhere near a straight plunge.
-
I've had a few close calls in the low 50s but never actually below 50. I am not that far from the water either, places that are a few miles south of me more in the central part of the island away from the Sound and the ocean get a little bit cooler than me. Plus my thermometer is like 20 feet up and not the best location unfortunately. All that combines for elevated temps.
-
I've seen good reports of color, especially above 1500'. I'm hiking the MD section of the Appalachian trail next weekend. Color should be good in higher elevation. It will look green in the valley.
-

Spooky Season (October Disco Thread)
CoastalWx replied to Prismshine Productions's topic in New England
Nah we change things a bit mid month and beyond - Today
-
64.8 is the monthly normal. 65.5 and +6.4 is just for that particular day.