All Activity
- Past hour
-
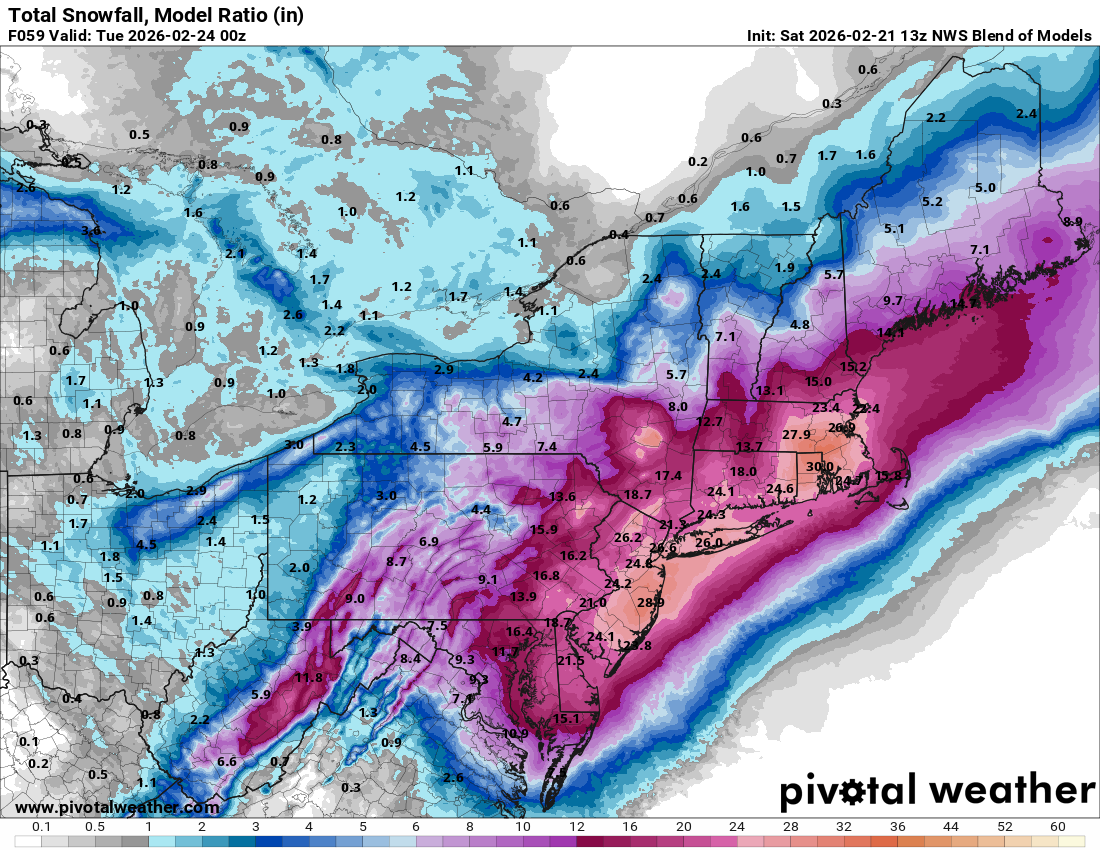
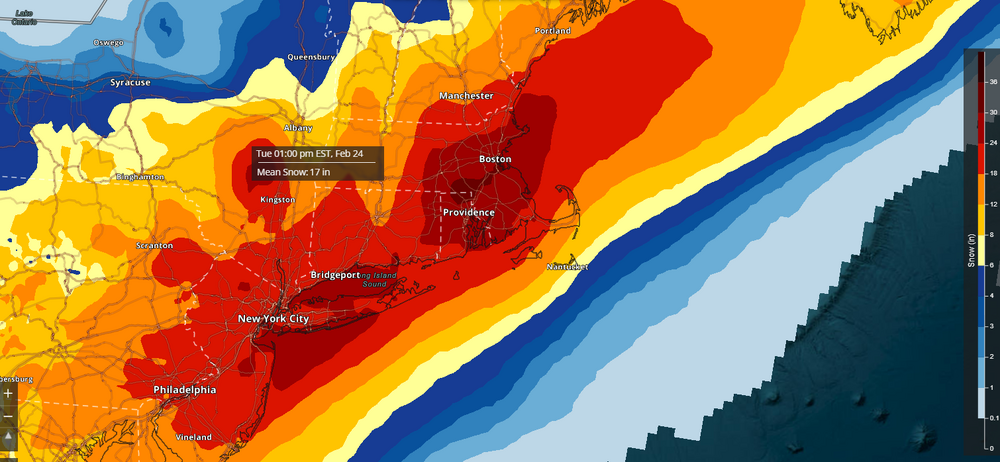
13z NBM is pretty wild. The mean(!!!) has a large area of 24-30" across the Boston/Providence area (even 30-36"). The diagnostic ratios are likely too high considering winds will be strong.
-

2/22-23 "There's no way..." Storm Part 2
EastCoast NPZ replied to Maestrobjwa's topic in Mid Atlantic
My NWS forecast for tomorrow is a chance of rain and snow with less than 1 inch accumulation. Not even a WWA. -
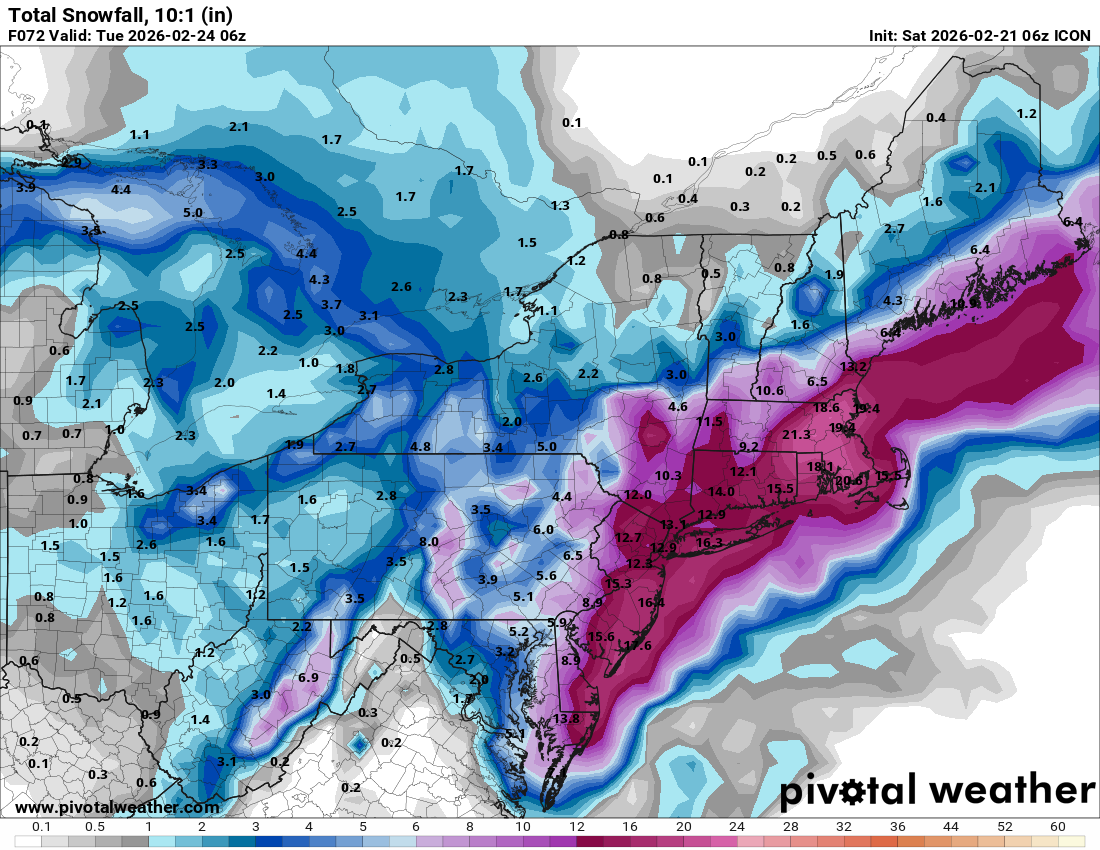
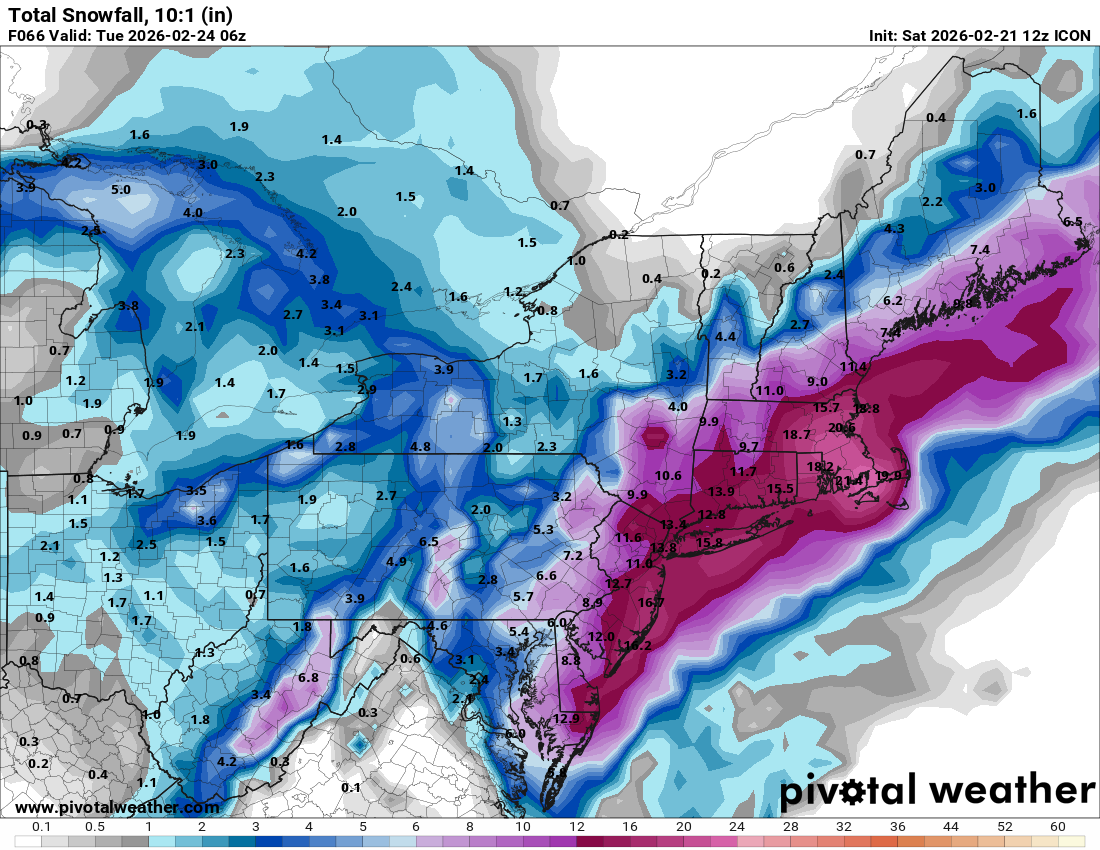
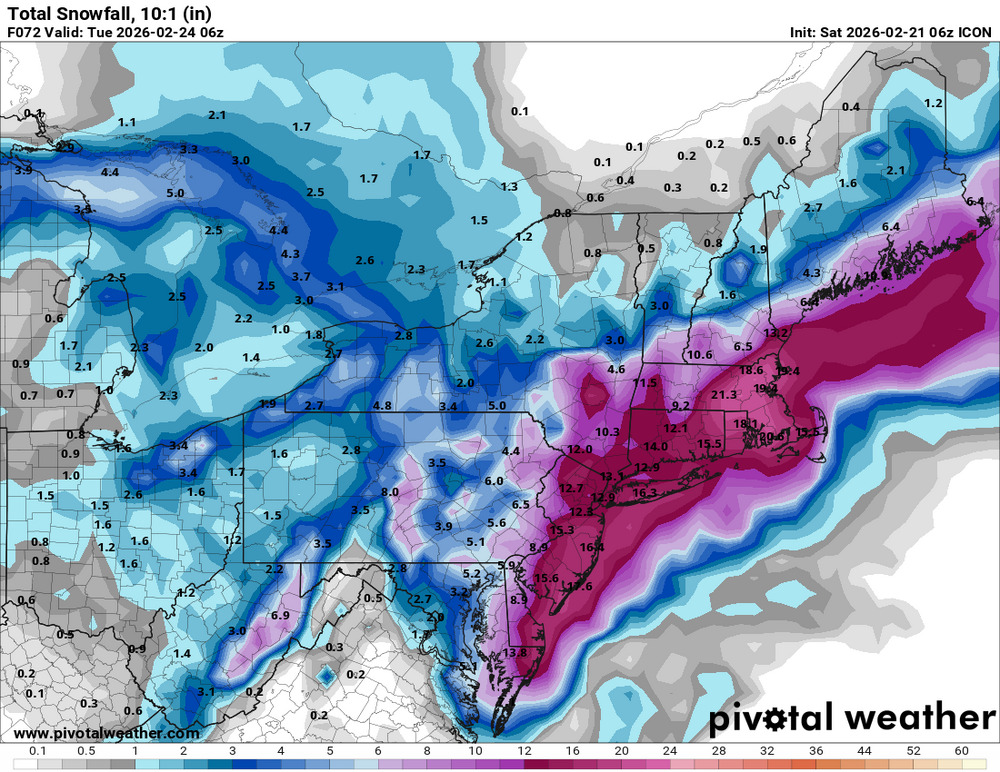
Icon 6z 12z

-
There are forecasts for as little as 6 - 12" for W NJ, S NY State, chances are most of these areas are getting 15" - 25", NAM had near 20" to Harrisburg and Albany...they got to up quick
-

“Cory’s in NYC! Let’s HECS!” Feb. 22-24 Disco
bristolri_wx replied to TheSnowman's topic in New England
Brave does use Chromium, which is the basis for Google Chrome, and is the open source project managed by them. Other browsers that use Chromium are Microsoft Edge, Brave, Vivaldi, and Opera (to name a few). Firefox and Safari run separate browser engines... -

2/22-23 "There's no way..." Storm Part 2
NorthArlington101 replied to Maestrobjwa's topic in Mid Atlantic
Ah! Terrible news. Sounds like someone should contact WxBell. But thanks. Curious what they are pulling the 90th percentile from lol -

“Cory’s in NYC! Let’s HECS!” Feb. 22-24 Disco
George001 replied to TheSnowman's topic in New England
A lot of this is over my head as a non met and more of a causal snow weenie (especially in such a complex setup like this) so I would like to learn more about your process. From what I understand you don’t just look at QPF, storm track, 500mb You see the entire system, notice patterns (eg your Miami rule, phase heavy bias in the mid range, teleconnections, anticipating where the correction vector is pointed based on the ensemble clustering etc) and lean on that pattern recognition rather than ripping and reading QPF and kuchera like people do on Twitter. It’s an old school approach similar to another met I follow, Bernie Rayno. We need more of this and less QPF ripping from twitterologists. Feel free to tweak or correct parts of this that are off base. About your game of managing nested anomalies idea, I want to make sure I really understand this right. Would things like an extreme arctic airmass, intense thermal gradient, rapid phase shift for NAO, ENSO mismatch (La Nina surface with El Niño subsurface), etc fall into that category? The arctic airmass isn’t as entrenched as it was in the heart of winter, but a 1050ish mb high diving into the Midwest is no joke. Then we have the SE well AN. What about the role that CC as a whole plays in this idea of nested anomalies? On a global scale we are a pocket of cold in a sea of warmth like you mentioned in an earlier post, I’m curious how that ties into this. -
I’m thinking 3-6” in VA/DMV east of 15 towards I-95, high end if caught under norlun banding.
-

“Cory’s in NYC! Let’s HECS!” Feb. 22-24 Disco
CoastalWx replied to TheSnowman's topic in New England
It’s been doing that and I really can’t find a reason why, other than land/sea convergence. But if that was the case, I would expect other models to show that -
8-14 inches on Reggie
-
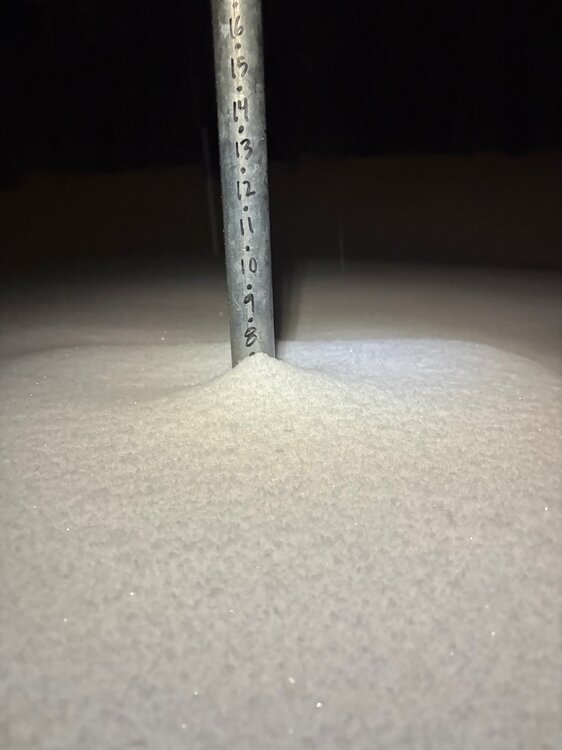
2.21 qpf on Reggie
-
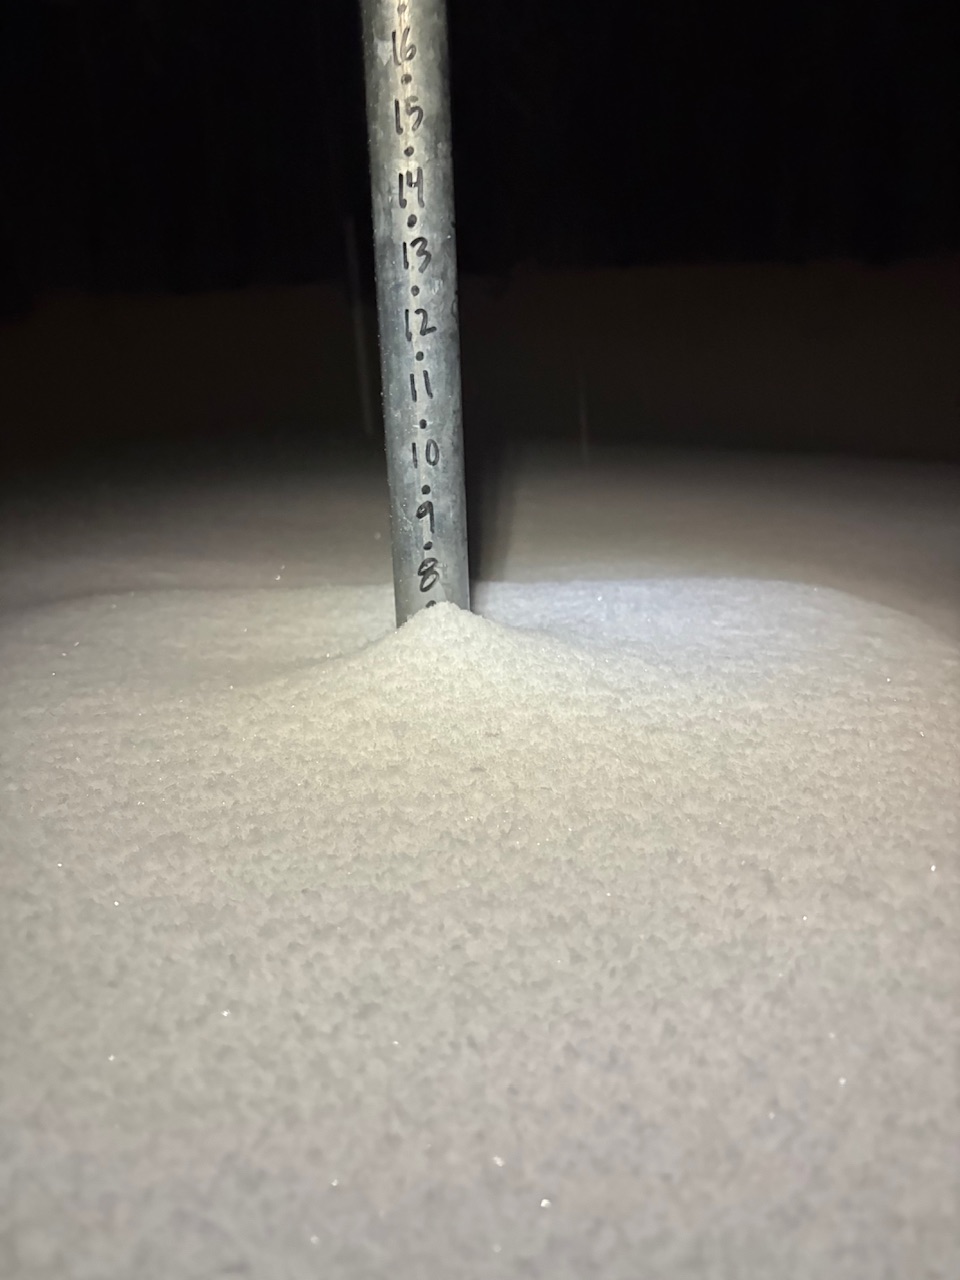
Got a bit more than anticipated. Grabbed a pic as it started yesterday and one this morning. We’re and fluffy stuff. Experienced some decent rates on 101 near 95 last night around 11pm.

-

2/22-23 "There's no way..." Storm Part 2
nw baltimore wx replied to Maestrobjwa's topic in Mid Atlantic
If anyone needs me tomorrow, I'll be on my roof. -
Thanks for all you do friend! Hoping you cash in at home!
-

Central PA Winter 25/26 Discussion and Obs
Itstrainingtime replied to MAG5035's topic in Upstate New York/Pennsylvania
Sounds like MillvilleWx screw zone is between 83 and 81 as of now. -

“Cory’s in NYC! Let’s HECS!” Feb. 22-24 Disco
Kitz Craver replied to TheSnowman's topic in New England
I’m so traumatized by your Dad saying IGONE, this is much better -

“Cory’s in NYC! Let’s HECS!” Feb. 22-24 Disco
Typhoon Tip replied to TheSnowman's topic in New England
I've also upgraded my home sys and run Windows 11 these days - which I don't like for other reason..ha. I seem to have less issue with Firefox - which also was pretty bad back in the day. I may check out Brave and see. I need to be able to turn off trajectories tho. And I'll never use Google - so if Brave is affiliated with that engine I'd probably defer. -
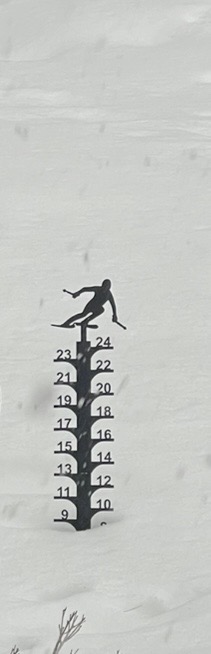
IMG_0992.mov Paste on trees in Plymouth
-
Idk who set that up, but that's actually our 90th percentile from our probability precipitation portal. I'm not sure why that says 50th percentile. I just checked and that is, to a T our 90th percentile. And yes, those are automated with an algorithmic process that produces a more gaussian distribution based off our forecast.
-
Anyone got a sled team I can borrow?
-
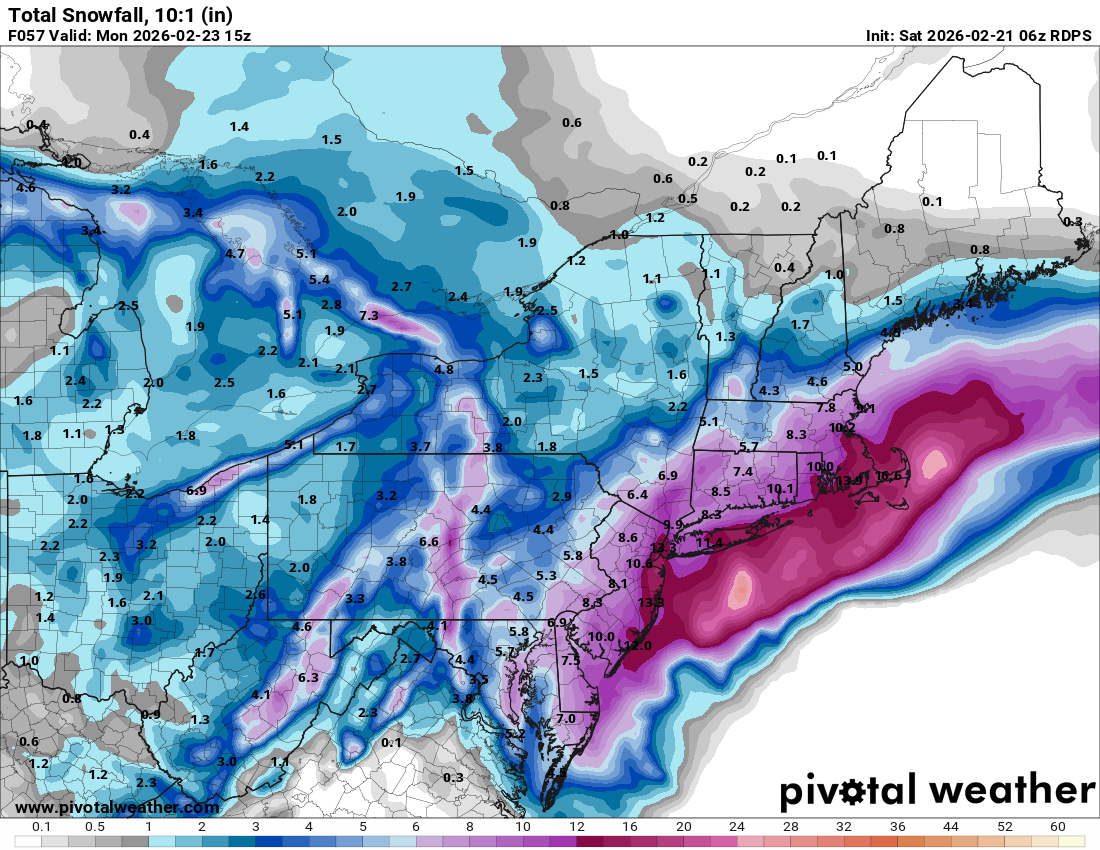
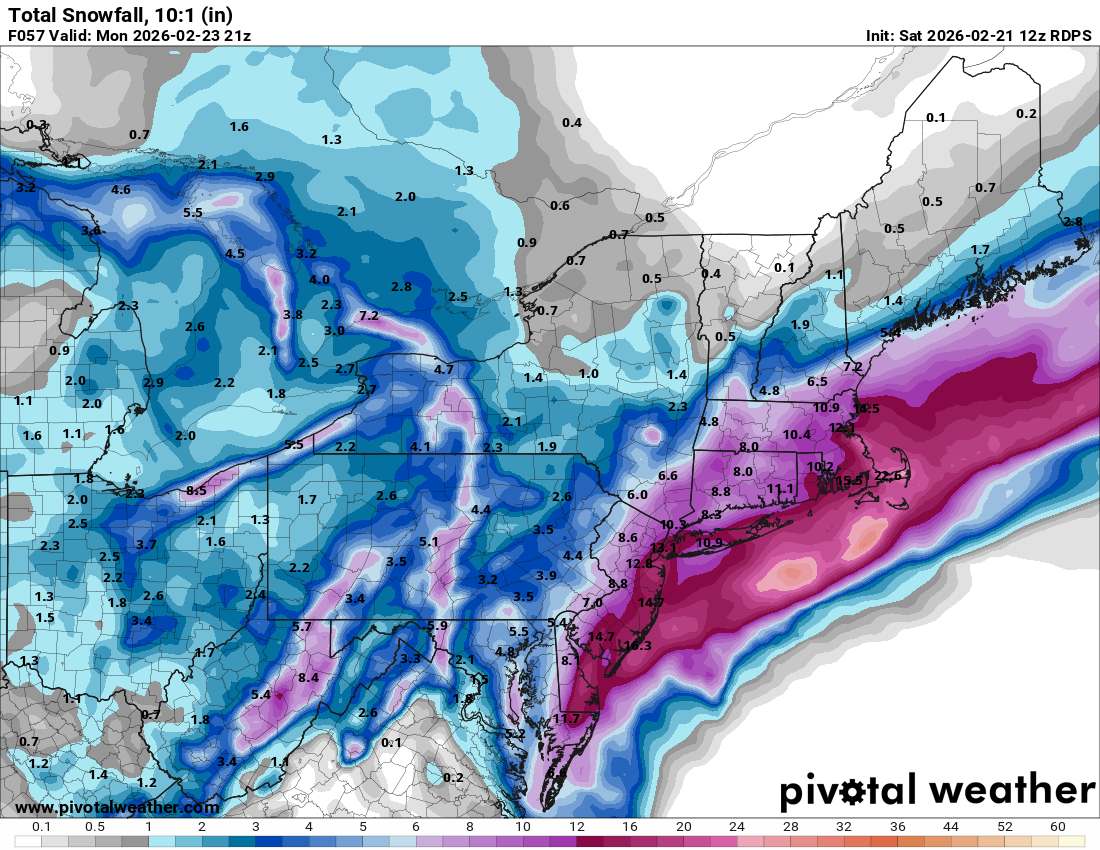
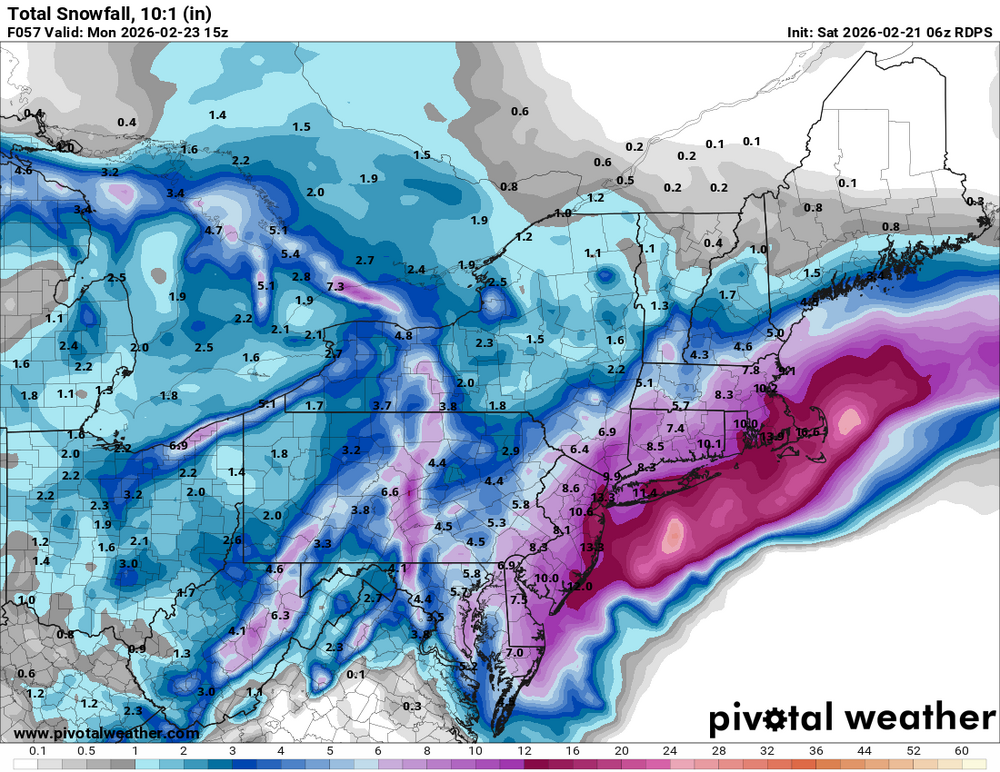
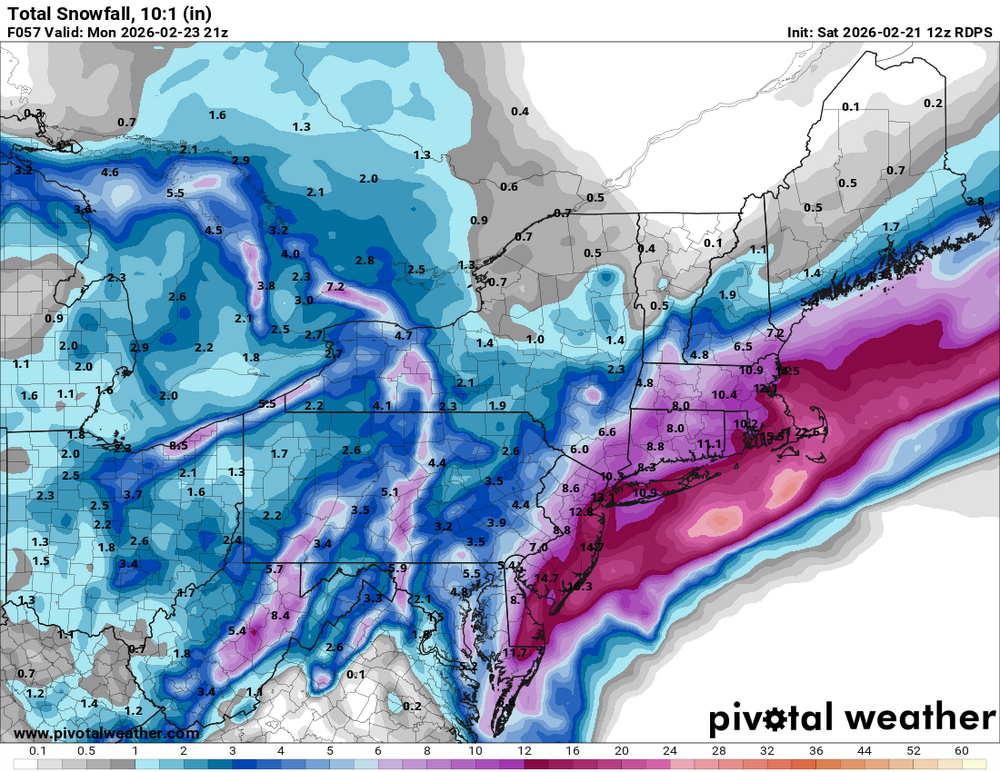
RDPS comparison 6z 12z
-
“Cory’s in NYC! Let’s HECS!” Feb. 22-24 Disco
bristolri_wx replied to TheSnowman's topic in New England

-

“Cory’s in NYC! Let’s HECS!” Feb. 22-24 Disco
RUNNAWAYICEBERG replied to TheSnowman's topic in New England
Thoughts on euro not fully committing either? -
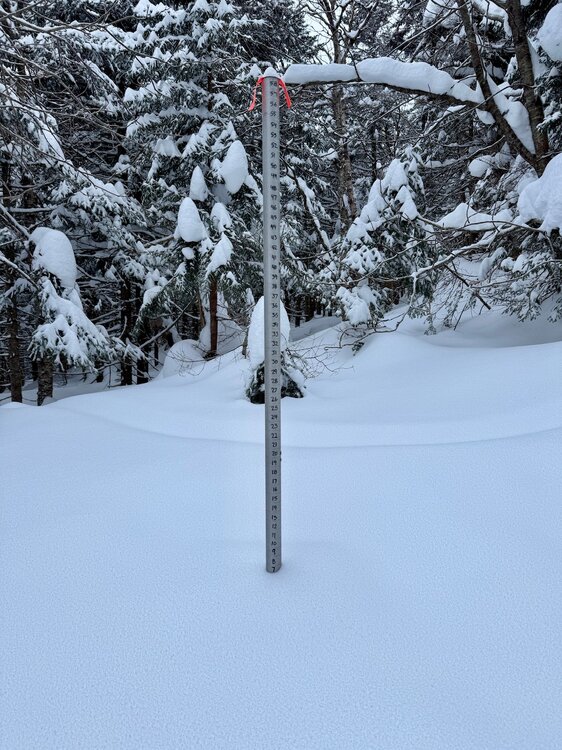
Had 7.5” at 1500ft and about the same at 3,000ft. No change with elevation in this one. Even town was close to that.