All Activity
- Past hour
-
I really don't know what the NWS is thinking by putting 104 and 105 into the zones. You don't forecast historic heat 4-5 days out, especially when the only guidance giving those types of numbers are models that have known boundary layer issues. From the AFD: ================================================================== *** ALL-TIME RECORD HIGHS *** ================================================================== Baltimore 107 (set on Jul 10, 1936) Washington 106 (set on Jul 20, 1930 + Aug 06, 1918) Sterling-Dulles Airport 105 (set on Jul 22, 2011) Baltimore Downtown 108 (set on Jul 07, 2012 + Jul 22, 2011) Annapolis 106 (set on Aug 06, 1918) Hagerstown 105 (set on Jul 14, 1954) Martinsburg 112 (set on Jul 11, 1936) Charlottesville 107 (set on Sep 07, 1954 + 3 other times) ================================================================== *** ALL-TIME RECORD WARM LOWS *** ================================================================== Baltimore 83 (set on Aug 05, 1930 + 2 other times) Washington 84 (set on Jul 24, 2011 + 2 other times) Sterling-Dulles Airport 79 (set on Aug 08, 2007) Baltimore Downtown 88 (set on Jul 02, 2011 and Jul 10, 1993) Annapolis 92 (set on Jul 07, 1994) Hagerstown 86 (set on Jun 15, 1899) Martinsburg 86 (set on Jul 21, 1930) Charlottesville 85 (set on Aug 07, 1918) ================================================================== *** JULY MONTHLY RECORD HIGHS *** ================================================================== Baltimore 107 (set on Jul 10, 1936) Washington 106 (set on Jul 20, 1930) Sterling-Dulles Airport 105 (set on Jul 22, 2011) Baltimore Downtown 108 (set on Jul 07, 2012 + Jul 22, 2011) Annapolis 105 (set on Jul 21, 1930 + Jul 02, 1901) Hagerstown 105 (set on Jul 14, 1954) Martinsburg 112 (set on Jul 11, 1936) Charlottesville 107 (set on Jul 10, 1936 + Jul 20, 1930) ================================================================== *** JULY MONTHLY RECORD WARM LOWS *** ================================================================== Baltimore 83 (set on Jul 21, 1930) Washington 84 (set on Jul 24, 2011 + 2 other times) Sterling-Dulles Airport 78 (set on Jul 24, 2010 + Jul 08, 2010) Baltimore Downtown 88 (set on Jul 22, 2011 + Jul 10, 1993) Annapolis 92 (set on Jul 07, 1994) Hagerstown 83 (set on Jul 24, 2010) Martinsburg 86 (set on Jul 21, 1930) Charlottesville 84 (set on Jul 22, 1930) ================================================================== *** DAILY RECORD HIGHS | WARM LOWS *** VALID: Jul 01 ================================================================== Baltimore 103 (1901) | 80 (1933 + 1901) Washington 102 (1901) | 79 (1977) Sterling-Dulles Airport 96 (2012) | 72 (2017 + 3) Baltimore Downtown 101 (2012) | 82 (2012) Annapolis 103 (1901) | 79 (1945 + 1901) Hagerstown 100 (1901) | 74 (2017 + 1977) Martinsburg 102 (1933) | 74 (1933) Charlottesville 101 (2012 + 1945) | 78 (1901) ================================================================== *** DAILY RECORD HIGHS | WARM LOWS *** VALID: Jul 02 ================================================================== Baltimore 103 (1901) | 80 (1901) Washington 101 (1898) | 79 (2012 + 1872) Sterling-Dulles Airport 98 (1966) | 75 (2022) Baltimore Downtown 102 (1966) | 84 (2002) Annapolis 105 (1901) | 80 (1901) Hagerstown 100 (1966) | 74 (2018 + 1901) Martinsburg 102 (1933 + 1931) | 75 (1933 + 1901) Charlottesville 100 (1954) | 76 (1910) ================================================================== *** DAILY RECORD HIGHS | WARM LOWS *** VALID: Jul 03 ================================================================== Baltimore 104 (1898) | 80 (1898) Washington 101 (1966 + 2) | 80 (2018) Sterling-Dulles Airport 103 (1966) | 73 (2018 + 2) Baltimore Downtown 102 (1997) | 82 (2018 + 1983) Annapolis 100 (1901) | 84 (1896) Hagerstown 102 (1966) | 76 (2002) Martinsburg 102 (1941 + 1911) | 74 (1980) Charlottesville 100 (1966 + 1954) | 79 (1911)
-

Junorch obs and discussion 2026
Damage In Tolland replied to Damage In Tolland's topic in New England
We found Ineedsnow and Kooky Kenny -
I’m still feeling mostly 98-100 in the hot spots right now…not buying the 2m 103-105 stuff with 850s of only 22-23C. I’m sure EWR will drop a 104° one day over the tarmac though. Just imagine all of those sweathogs in DC later next week for the 250th. No thanks.
-
Going to fall short of triple digits but we should string together 5+ 90 degree days, with near daily storm chances. 16 of the last 17 days have been BN. A classic summer heatwave was bound to happen.
-
Even the 88 figure in Downtown Baltimore seems excessive, but it's remotely plausible if the observation site is in the middle of the urban heat island, surrounded for miles on all sides by asphalt and brick buildings, with absolutely no green space.
-

Central PA Summer 2026 Discussion/Obs Thread
mahantango#1 replied to Voyager's topic in Upstate New York/Pennsylvania
US National Weather Service State College PA nspedSootr1a3646c41lu02354136h0gh2amh0h1tlh0cgi2179h3mii3i1l · Significant, dangerous heat wave expected from Tuesday into Independence Day Stay informed and take steps to protect yourself from heat related illness -
In other words days and days of shirtlessness (perhaps down to short shorts?) with several packages of hard mikes and dude wipes on standby. Lfg baby!
-

2026-2027 Super El Nino
snowman19 replied to Stormchaserchuck1's topic in Weather Forecasting and Discussion
Very strong coupling now (ocean-atmosphere/Bjerknes feedback) showing up….the ERWs are constructively interfering with El Niño. Also, classic Nino standing wave convection/-OLR -
Central PA Summer 2026 Discussion/Obs Thread
mahantango#1 replied to Voyager's topic in Upstate New York/Pennsylvania
Try to make today a good day. -
Yeah euro op is still pretty warm. Lots of 15-20C in the extended. ACATT squealing for help.
-
Junorch obs and discussion 2026
Damage In Tolland replied to Damage In Tolland's topic in New England
Cancel uncanceled -
Junorch obs and discussion 2026
Damage In Tolland replied to Damage In Tolland's topic in New England
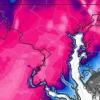
It’s like Ineedsnow drew that map -
Makes you really miss years like 1996 with 77”-92” of snow and only 1-5 days reaching 90° on parts of Long Island. Snowfall Data for October 1, 1995 through April 30, 1996 Click column heading to sort ascending, click again to sort descending. BRIDGEHAMPTON COOP 84.0 GREENPORT POWER HOUSE COOP 80.0 ISLIP-LI MACARTHUR AP WBAN 77.1 PATCHOGUE 2 N COOP 92.0 RIVERHEAD RESEARCH FARM COOP 78.8 UPTON COOP - NWSFO NEW YORK COOP 86.2 90° Day Data for January 1, 1996 through December 31, 1996 Click column heading to sort ascending, click again to sort descending. SETAUKET STRONG COOP 5 UPTON COOP - NWSFO NEW YORK COOP 3 PATCHOGUE 2 N COOP 2 ISLIP-LI MACARTHUR AP WBAN 2 RIVERHEAD RESEARCH FARM COOP 2 BRIDGEHAMPTON COOP 1 GREENPORT POWER HOUSE COOP 1
-
After the 4th we cool off but still summery. It’s here baby.
-
Looks a lot worse than typical. Long lasting with many records broken.
-

Central PA Summer 2026 Discussion/Obs Thread
Voyager replied to Voyager's topic in Upstate New York/Pennsylvania
Why couldn't today have been yesterday's weather? I needed a morale booster so bad, and instead, I got the opposite. -
Hard L

-
That would be impressive. I can't recall a reading at DCA of 105, but admittedly I don't track summer heat . Edit:: Google tells me this happened in 2012. I was here and it was super hot, just don't remember the 105 reading
-
Looks like a typical New England heat wave. We embrace
-
LWX going 105 in the zones at DCA for Friday .WEDNESDAY...Sunny, hot with highs in the upper 90s. Heat index values up to 110. .WEDNESDAY NIGHT...Mostly clear. Lows in the upper 70s. .THURSDAY...Sunny, hot with highs 100 to 105. Heat index values up to 110. .THURSDAY NIGHT...Mostly clear. Lows around 80. .FRIDAY...Sunny with a chance of showers and thunderstorms. Hot with highs around 105. Chance of rain 30 percent. .FRIDAY NIGHT...Partly cloudy. Lows in the upper 70s. .INDEPENDENCE DAY...Mostly sunny with a chance of showers and thunderstorms. Hot with highs around 100. Chance of rain 40 percent.
- Today
-
Central PA Summer 2026 Discussion/Obs Thread
mahantango#1 replied to Voyager's topic in Upstate New York/Pennsylvania
.CLIMATE... Triple digit max temps are forecast in the Lower Susq Valley (LSV) on Thursday and Friday bookended by upper 90s Wednesday and Saturday. The last time Harrisburg observed consecutive days with maxT greater than or equal to 100F was back in 2011 on July 21-22. The record number of consecutive days with maxT >= 100F is 3 and has occurred 5 times: (all in the month of July) 1999-07-16 to 1999-07-18 1999-07-04 to 1999-07-06 1991-07-19 to 1991-07-21 1966-07-02 to 1966-07-04 1936-07-09 to 1936-07-11 The last time Harrisburg hit the century mark was July 16th in 2024. Prior to that, it was July 19th in 2020. Harrisburg averages 1 day annually with a maxT >100F. The most number of days observed in a year is 6 in 1999. -
Central PA Summer 2026 Discussion/Obs Thread
mahantango#1 replied to Voyager's topic in Upstate New York/Pennsylvania
And in 6 months or so our heating systems will be getting a workout. -
Like the "29 inches of snow that fell at BWI in 2016. Bogus. I measured 21" at BWI. The biggest official snowstorm is Bogus. Feb 2010 was the GOAT.
-
From Junorch to Jultorch...