All Activity
- Past hour
-
Records: Highs: EWR: 97 (1965) NYC: 96 (1880) record early season heatwave continued on LGA: 92 (1965) JFK: 86 (1985) Lows: EWR: 43 (1967) NYC: 41 (1961) LGA: 41 (1961) JFK: 42 (1961) Historical: 1771: In Virginia, a wall of water came roaring down the James River Valley following ten to twelve days of intense rain. As water swept through Richmond, buildings, boats, animals, and vegetation were lost. About one hundred fifty people were killed as the River reached a flood stage of forty-five feet above normal. A monument to the flood was inscribed by Ryland Randolph, of Curles, in 1771-72: " ... all the great rivers of this country were swept by inundations never before experienced which changed the face of nature and left traces of violence that will remain for ages." 1826: A tremendous hail storm struck the eastern shore of Maryland during the evening damaging wheat and vegetable crops from Hillsborough in Caroline County to Easton in Talbot County. One person was killed. Between the Severn and Patapsco Rivers, hail the size of eggs fell. Across the bay in Calvert County, a man was killed by hail. (Ref. Wilson Wx. History) 1896 - A massive tornado struck Saint Louis, MO, killing 306 persons and causing thirteen million dollars damage. The tornado path was short, but cut across a densely populated area. It touched down six miles west of Eads Bridge in Saint Louis and widened to a mile as it crossed into East Saint Louis. The tornado was the most destructive of record in the U.S. up until that time. It pierced a five-eighths inch thick iron sheet with a two by four inch pine plank. A brilliant display of lightning accompanied the storm. (David Ludlum) (The Weather Channel) 1909: Bakersfield, CA reached 104°; their hottest temperature for May which featured 12 days with triple digit temperatures, the most ever for that location. (Ref. Wilson Wx. History) 1914: Boston, MA recorded its warmest ever low temperature of 74 °F for May. (Ref. NOAA Boston Weather Events) 1973: A large F4 tornado cut a 135-mile path across central Alabama. Hardest hit was the town of Brent where five people perished and 90% of the town was demolished. Seven people died along the path of the twister. Cancelled checks from Greensboro, AL were found at Gadsden, AL, over 100 miles away. Another killer tornado struck Centerpoint on the northeast side of Birmingham, killing one person. One person was killed and 35 people were injured when an F3 tornado stormed across Jones County, Mississippi. Another 3 people were injured when an F2 tornado swept across Clarke County. A second F2 tornado also moved across Scott County that evening. (Ref. Wilson Wx. History) 1987 - Severe thunderstorms in West Texas produced baseball size hail at Crane, hail up to three and a half inches in diameter at Post, and grapefruit size hail south of Midland. Five days of flooding commenced in Oklahoma. Thunderstorms produced 7 to 9 inches of rain in central Oklahoma. Oklahoma City reported 4.33 inches of rain in six hours. Up to six inches of rain caused flooding in north central Texas. (The National Weather Summary) (Storm Data) 1988 - Sunny and warm weather prevailed across much of the nation to kick off the Memorial Day weekend. Afternoon thunderstorms in southern Florida caused the mercury at Miami to dip to a record low reading of 69 degrees. (The National Weather Summary) (Storm Data) 1989 - Unseasonably hot weather prevailed in the southeastern U.S. Ten cities reported record high temperatures for the date as readings soared into the 90s. Lakeland, FL, reported a record high of 99 degrees, and Biloxi, MS, reported a temperature of 90 degrees along with a relative humidity of 75 percent. (The National Weather Summary) 1990 - Thunderstorms produced severe weather from north central Texas to the Central Gulf Coast Region. Severe thunderstorms spawned four tornadoes, and there were eighty-one reports of large hail or damaging winds. Late afternoon thunderstorms over southeast Louisiana produced high winds which injured twenty-seven persons at an outdoor music concert in Baton Rouge, and high winds which gusted to 78 mph at the Lake Ponchartrain Causeway. (Storm Data) (The National Weather Summary) 1991: From this date through the 28th, severe thunderstorms produced wind gusts of over 80 mph with numerous reports of over 60 mph. However, the real threat with these storms was the hail. Over 1,000 nesting birds were killed by falling hail at La Creek Refuge in Bennett County. Softball size hail was reported just north of Artesian in Sanborn County, and near Arlington in Kingsbury County. The hail completely destroyed a grain bin near Arlington. Many areas had golf ball size hail or larger. Many homes had windows knocked out and roofs damaged. The storms produced millions of dollars in damage. (Ref. Wilson Wx. History) 1992: Late record snow in CHEYENNE, WY measured 4.3 inches. 1995: A violent tornado moved from near Carroll to near Fonda, Iowa. Carroll County was also clipped by another violent tornado which moved from near Coon Rapids to near Churdan, Iowa. This tornado picked up a car and tossed it more than a quarter-mile into a field. One student's homework papers were found some 55 miles away in the town of Gilmore City. The Iowa State Patrol closed off a four mile section of the interstate to allow the half-mile wide tornado to pass. Greene, Adair, Carroll, Guthrie, Sac and Union counties were declared disaster areas. Some damage estimates included $2 million dollars in Greene County, $1.2 million in Carrol and Union Counties, $828,000 in Adair County and $642,000 in Sac County. (Ref. Wilson Wx. History) 1997: An F5 tornado killed 27 people in Jarrell, Texas. Although tornado warnings were issued 30 minutes in advance and local sirens were sounded, there were few places to go for safety. Most homes were on slabs, with no basements. Houses were swept clean off their foundations, with little debris left behind. Total damage was $20 million. The same thunderstorm complex produced a wind gust to 122 mph at Kelly Air Force Base in San Antonio. 2001: This day brought one of the most destructive and widespread windstorms to much of Oklahoma and north Texas in recent memory. These storms left one person dead, 4 injured, 160,000 people without power and over $350 million dollars in damage in Oklahoma alone. Several non-tornadic wind reports in excess of 100 mph were recorded, and it took nearly a week to restore power to all of the affected areas
-
This is some seriously heavy rain. .65" in less than 10 minutes!
-
2026-2027 Strong/Super El Nino
40/70 Benchmark replied to Stormchaserchuck1's topic in Weather Forecasting and Discussion
I love how you mock those on Social Media who dare to suggest that the ONI may not top 2.5, and then quote a dude suggesting that his incorrect interpretation of the RONI forecast could trigger "dystopian global climate change impacts over the next 1.5 years". 'Cmon, Adam...you're better than that. -
Now do the 1000s of posts calling for a warm Nov-Feb for the NE. You probably don't have enough space on this site to post screenshots
-
72 / 66 clouds rain / showers just to the south. Cluds look to perist all day and pushing temps below forecast likely. Dry and cool and its still a matter of escaping clouds/ unsettled -ness from the strong cut off / ULL into the northeast first Saturday and then next Tuesday. Untill then cooler than normal and models would have you believe dry, but id be weary of at least Sat and next Tue for rain. Beyond then much warmer as ridge finally pushes east and a more sw flow, next shot at heat in the 6/4 - beyond period.
-
March and April were solidly above normal.
-
That takes up about 3 minutes of your life total, unless you own a clock/watch store, then you have a little work to do for a day between customers every few hours.
-
torrential on and off rain, thunder and lightning. it alternates between almost sunny to the street lights coming on—very dramatic weather this morning.
-
I'm kinda looking for a "new" type of spring and summer heat that's been papered. "heat excursions" at higher latitudes have become a coherent/reproducible aspect of CC. That period of time suspiciously looks like an opportunity for one of those ridge nodal resonant features. UK is experiencing one now. And just like them, this one was not very well modeled either. They may be more sussed out by telecon trends - the old institutional way to 'sense' or see storms or warmth or cold etc.. at extended leads, because ( my conjecture) is that they are emerging within regions where the non-linear wave function is supplying - hence the "invisible" - a constructive feedback. The UK heat of these recent days didn't really show up in the guidance until 120 hours out. That's awesome in 1988, but 2026 ... mm. It's anomaly distribution has been extreme, relative to date. Uuuusually bigger anomalous in the physics materialize early in the linearity of the guidance, and have a way of sticking around from a longer lead... Sandy showed up 13 days out. So did the 1993 so called super storm. There are other examples. These heat nodes at higher latitudes are an increasing global phenomenon, and the linear day-to-day logistics of events in the models are not seeing them like that. There was a whopper in Siberia either last year or the previous ... The Pacific NW, 2020... there's a huge list. They are proportional in SD to no heat-related bigs, but with historic heat... not storms, thus less well seen ahead of time. And have been surging in occurrence in the last 20 years. The fact that this heat over in the UK might have been been merely suggested, but then went kind of bonkers is a smoking gun attribution deal. The PNA dips to -1 for 3 or 4 days between June 6-ish and 10-like, while the EPO does a weird 3-day dive to -2 SD, all the while the NAO is positive. Every so often the operational runs do like that 18z yesterday... then of course fade. Seems like there's a region where the non-linear ( "tendencies" is the best way to describe that - I've called that correction vectoring in the past) forcing occurs in a domain from say IA-ME. It's unfortunately not a linear weather forecast, because it can't be. I'm probably over-explaining it. Simply put, we have to sense where these tendency fields are, and then watch for the models to avail.
-
This last week was pretty pitiful for rain down in Calvert. Today is another day of mist/drizzle that doesn't even get the ground under the trees wet. Might as well go back to sun and full drought instead of this stupid weather.
-
Currently at work in Frederick, yeah that was a nice big thunder.
-
Well was not expecting that. Large flash out my bedroom window and thunder. Was going to show but will wait.
-
-
I find that hard to believe. Outside our 4-5 days of heat in March April and May, this hasnt been a particularly warm or pleasant spring. Cool, cloudy, misty, windy are adjectives I would use
-
Only about half an inch of rain from the western mesonet sites. Good for soils and denting the drought.
-
Just had a brief heavy shower; looks like more to come!
-
Having married into a sub-Saharan genealogy that's about as close to living with heat as you really want to go, huh lol
-
Yes it's been pouring rain here.
-
Take.
-
Central PA Spring 2026 Discussion/Obs Thread
Mount Joy Snowman replied to Voyager's topic in Upstate New York/Pennsylvania
Remarkable consistency in my observations lately, with three consecutive days of nearly exactly a third of an inch, then an even one-incher, followed by three consecutive tenth-of-an-inch type days. I understand this probably only interests me ha. carry on. 20-May Heavy Rain 0.34 21-May Rain 0.33 22-May Rain 0.33 23-May Rain 1.00 24-May Rain 0.11 25-May Rain 0.10 26-May Rain 0.10 - Today
-
Almost matched here
-
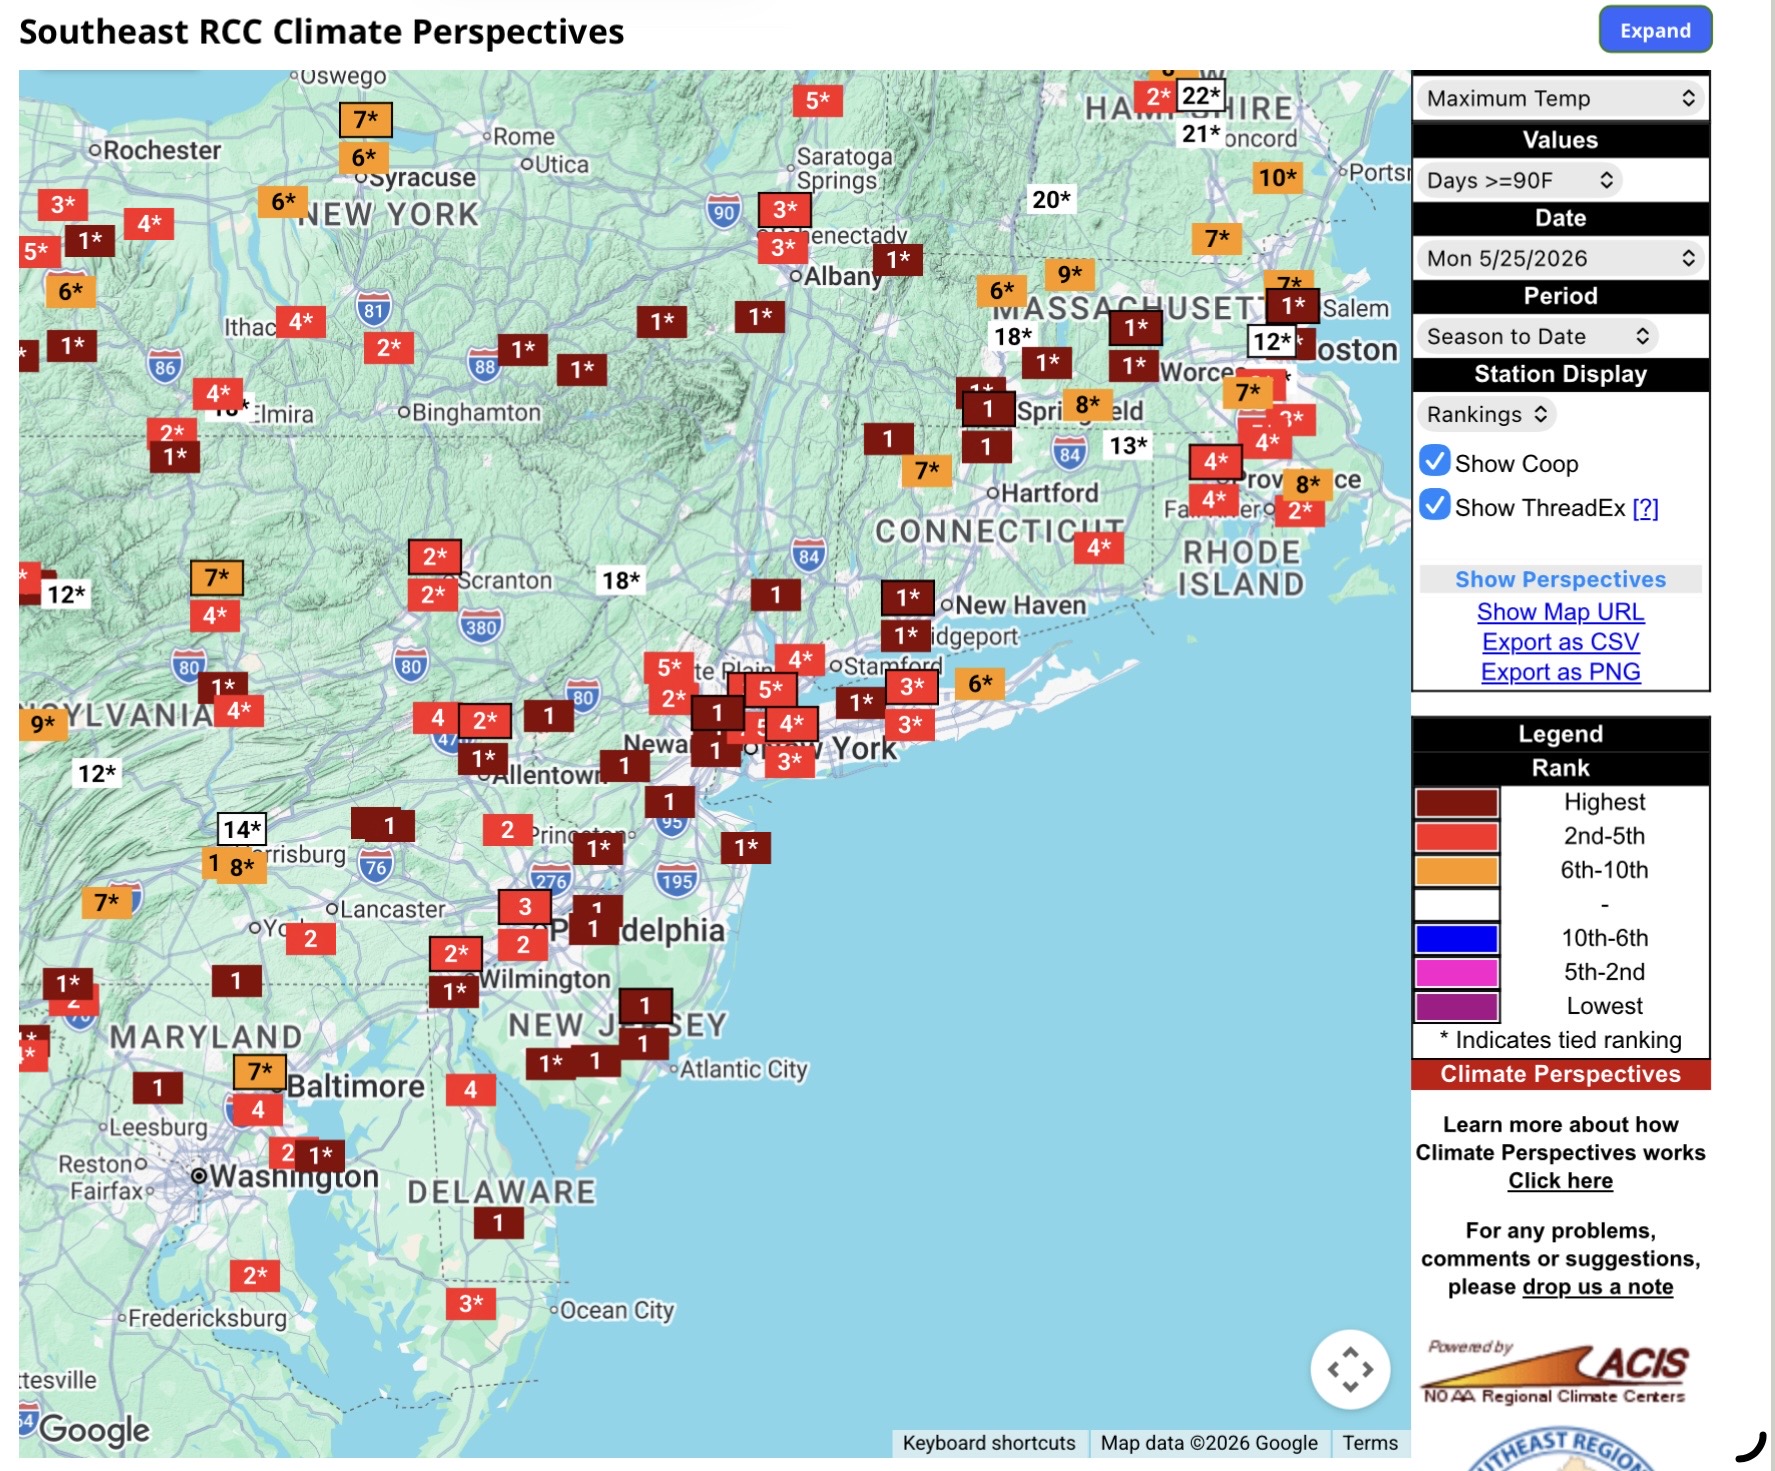
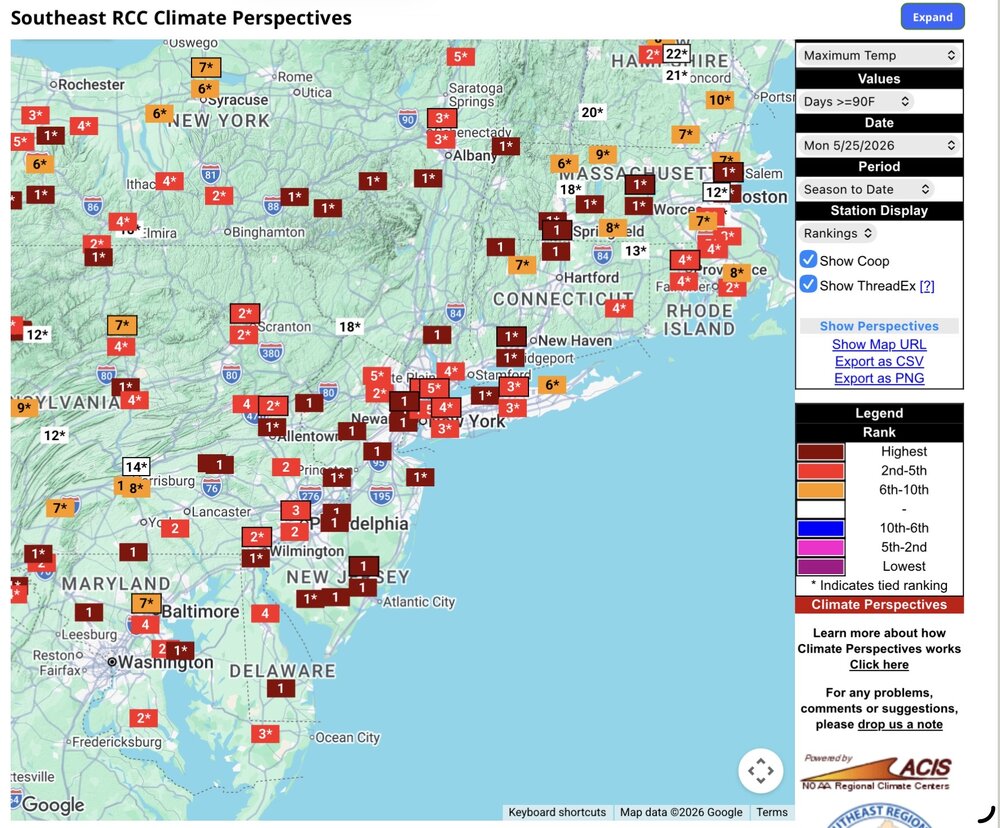
Stations in NJ will finish spring near first place for the most 90 days. Time Series Summary for HARRISON, NJ - Mar through May 90° Days Click column heading to sort ascending, click again to sort descending. 1 2026 7 5 2 2018 6 0 3 2001 5 2 4 2021 4 0 - 2016 4 0 - 2010 4 10 - 2004 4 2 - 2002 4 3 5 2022 3 0 - 2017 3 0 - 2009 3 13 - 2006 3 1 - 2000 3 4 Time Series Summary for NEWARK LIBERTY INTL AP, NJ - Mar through May Click column heading to sort ascending, click again to sort descending. 1 1991 8 0 2 2026 6 5 - 1986 6 0 3 2002 5 0 - 1959 5 0 - 1896 5 0 4 2022 4 0 - 2021 4 0 - 2018 4 0 - 2000 4 0 - 1987 4 0 - 1977 4 0 - 1965 4 0 - 1939 4 0 Time Series Summary for NEW BRUNSWICK 3 SE, NJ - Mar through May Click column heading to sort ascending, click again to sort descending. 1 2026 6 5 2 2016 4 0 - 2010 4 0 - 1976 4 0 3 2021 3 0 - 2017 3 0 - 2012 3 0 - 2009 3 0 - 2002 3 0 - 2001 3 1 - 2000 3 0 Time Series Summary for SOMERSET AIRPORT, NJ - Mar through May Click column heading to sort ascending, click again to sort descending. 1 2026 5 5 2 2021 4 1 3 2022 3 0 - 2017 3 0 - 2012 3 0 - 2009 3 0 - 2002 3 0 - 2000 3 2 Time Series Summary for SUSSEX AIRPORT, NJ - Mar through May Click column heading to sort ascending, click again to sort descending. 1 2026 3 6 - 2022 3 4 2 2023 2 0 - 2018 2 0 - 2013 2 5 - 2009 2 1 - 2002 2 0
-
That cluster of showers and storms in western MD and WV looks decent…
-
EPS breaks down the omega block and opens the gulf back up, so that’s possible.
-
Central PA Spring 2026 Discussion/Obs Thread
pawatch replied to Voyager's topic in Upstate New York/Pennsylvania
63 degrees for the low. Cloudy, not sure if we got rain showers coming.