All Activity
- Yesterday
-

2026 Atlantic Hurricane Season
vortex95 replied to Stormchaserchuck1's topic in Tropical Headquarters
Great questions and critical thinking above. That's the right thing to in practicing good science -- asks lots of questions! See this paper 2011 paper (pdf attached): On the Classification of Extreme Atlantic Hurricanes Utilizing Mid-Twentieth-Century Monitoring Capabilities* A methodology is created to determine how many of these 10 recent Category 5 hurricanes likely would have been recorded as Category 5 if they had occurred during this period using only the observations that likely would have been available with existing technology and observational networks. Late-1940s and early- 1950s best-track intensities are determined for the entire lifetime of these 10 recent Category 5 hurricanes. It is found that likely only 2 of these 10—both Category 5 landfalling hurricanes—would have been recorded as Category 5 hurricanes if they had occurred during the late-1940s period. The results suggest that intensity estimates for extreme tropical cyclones prior to the satellite era are unreliable for trend and variability analysis. So it virtually certain due to limitations of tech, esp. prior to the satellite era, many cat 4s even some cat 3s documented were actually cat 5s. The hurricane reanalysis project has found solid evidence of cat 5sifor some system, and that has been corrected in HURDAT, but due to the mesoscale nature or the inner cores of these beasts, you just can't tell many times. Also, hurricanes do not remain at cat 5 strength very long, so that makes them even harder to detect historically. Even today, some are missed in the absence of recon since Dvorak estimates work best for systems 60 to 105 kt. This means two things. One, many TDs are actually weak TSs and two, many intense HUs are underestimated. There is very little difference on satellite what a strong cat 4 and a minimal Cat 5 looks like, and Dvorak cannot account for storm size, RMW, environmental pres gradient, storm forward motions, and other factors that go into actual wind speed of a TC. As an example, take HU Patrica from 2015. If not for recon, it likely would have been capped at 160 kt. I have yet to see NHC assign a HU in their AOR above 160 kt in the absence of recon or other in situ data. Even JTWC rarely goes above 160 kt. Patricia was rather small, and Dvorak does not do well for small TCs (underestimates). Now we did have recon, and initial obs were 175 kt. when it was 880 mb. However, the next recon, over 6 hr later, and it found 879 mb, but the satellite signature had weakened a bit, so recon missed Patricia’s absolute peak intensity. They gave Patricia and estimated 872 mb pressure, but it could have been lower. And on post-season analysis, the found Patricia peak winds were actually 185 kt! So you see how tricky and elusive these beasts can be, even when recon is available! I know Patricia was a cat 5 all along, but see the margin of error there w/ in actual in situ obs? The first official cat 5 in the Atlantic is not until 1924. Does that mean there were none prior? Of course not, just it was very hard to get actual obs to verify something that intense the further you go back, An unfortunate ship would have to survive getting into the core of these things or a land station would have to be at the just the right location and the instruments survive to verify a cat 5. Also, GFS dropsondes were not put into used until 1998, and the SFMR not until 2004. These were game changers as to recons to get a much better idea of the winds sfc and aloft in a TC. They way they got sfc winds prior? They would take about 90% of the FL (700 mb) winds, and go w/ that that. That works often, but not all the time. It can vary quite a bit as GPS dropsondes and the SFMR have shown! So really, using data prior to the 1990s for overall trends in intense hurricanes is not an apples to apples comparison. Our detection and documentation, technology, and knowledge/understanding has improved immensely in the last 30 years alone, giving us a much better idea of reality for TCs, esp. for the intense ones! And 30 years is too short of period to determine TC trends, esp. the in Atlantic since the AMO cycles are approx 25-45 years in length. And the idea that hurricanes are getting worse overall? That notion is partially flawed b/c of the above. Non-wx/climate factors play a big role here. We are better than ever in observing and measuring the wx, getting better all the time, so we have been seeing things in recent decades due to better tech that were always there, just not able to be detected prior (go back to how the first cat 5 in the Atlantic is not until 1924). And the odds of seeing more absolute extremed and setting new records go up b/c of this tech factor as well. jcliD1100420 4461..4475 - hagen-landsea-jclimate-2012.pdf -

2026-2027 Record-breaking El Nino
GaWx replied to Stormchaserchuck1's topic in Weather Forecasting and Discussion
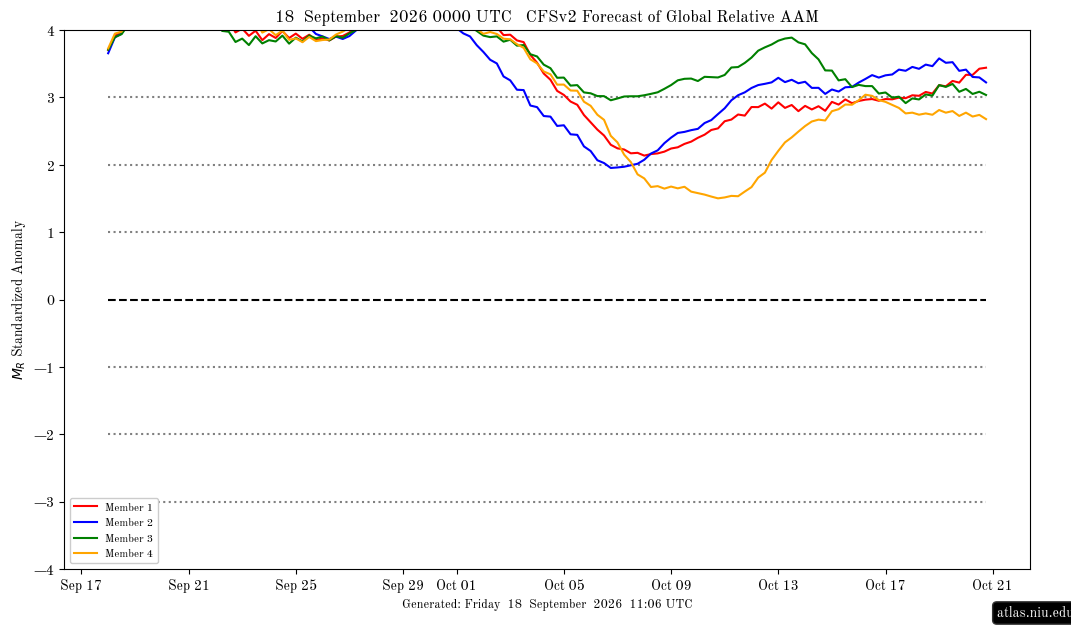
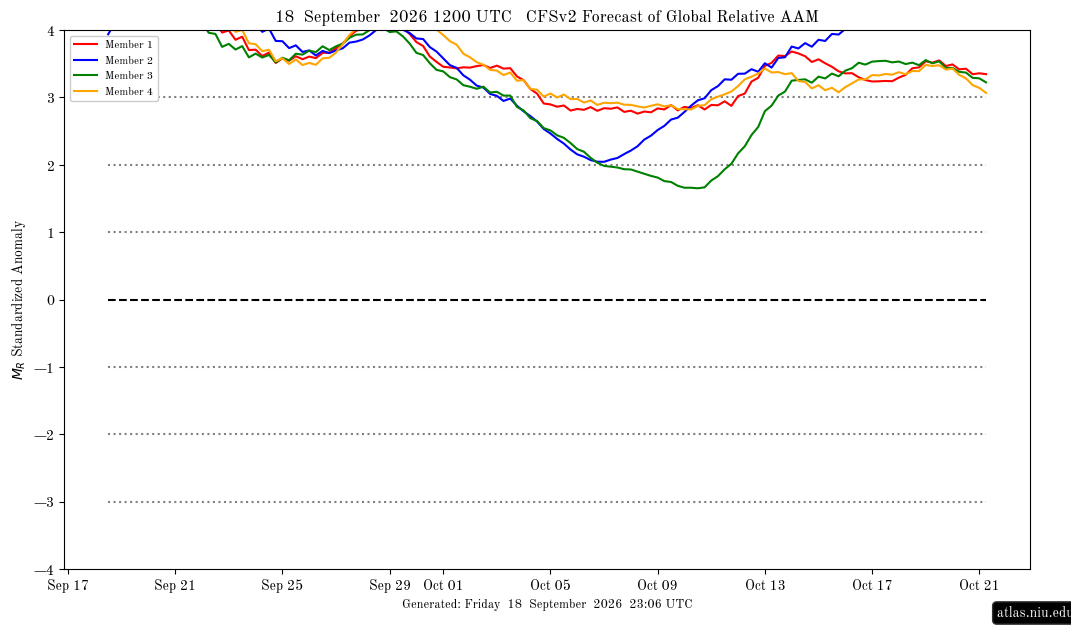
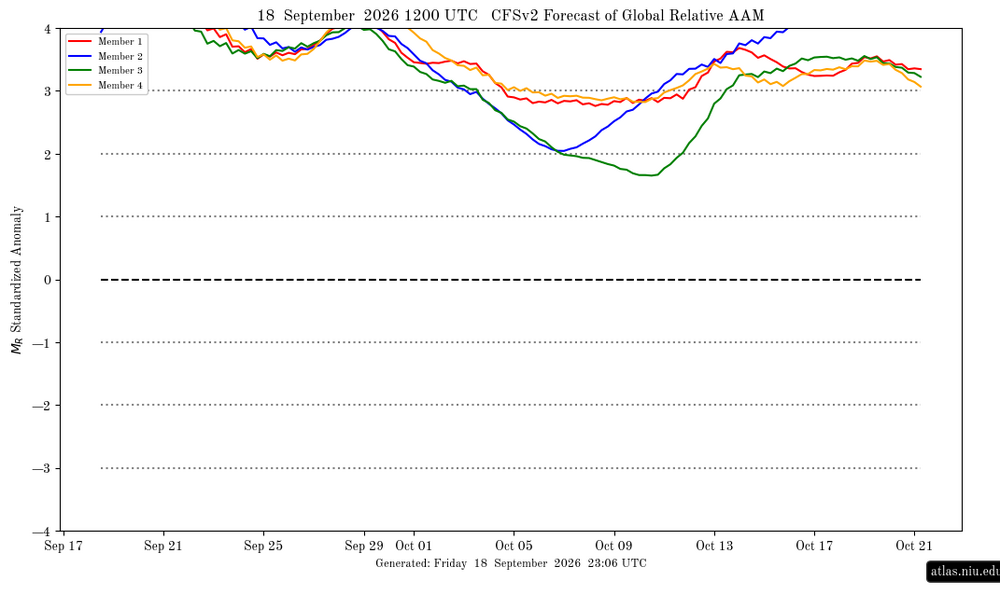
AAM +3.9 & rising to very extreme levels. Should be off the chart on next runs: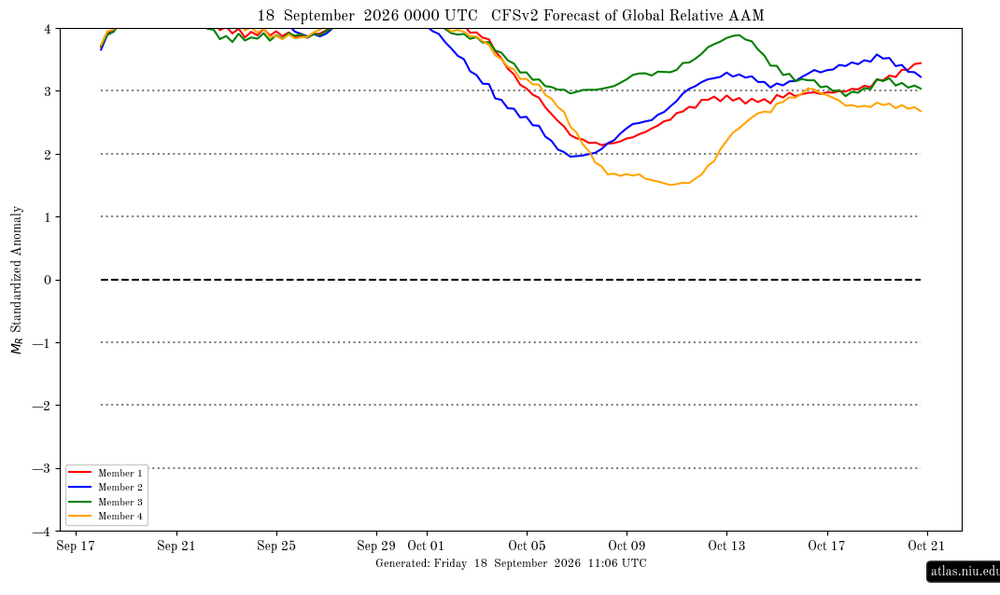
-
2026 Atlantic Hurricane Season
NorthHillsWx replied to Stormchaserchuck1's topic in Tropical Headquarters
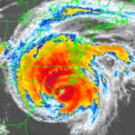
If this was worth flying a plane into they’d called is a TD -
Last winter was good. Best winter in over 10 years.
-

2026-2027 Record-breaking El Nino
bluewave replied to Stormchaserchuck1's topic in Weather Forecasting and Discussion
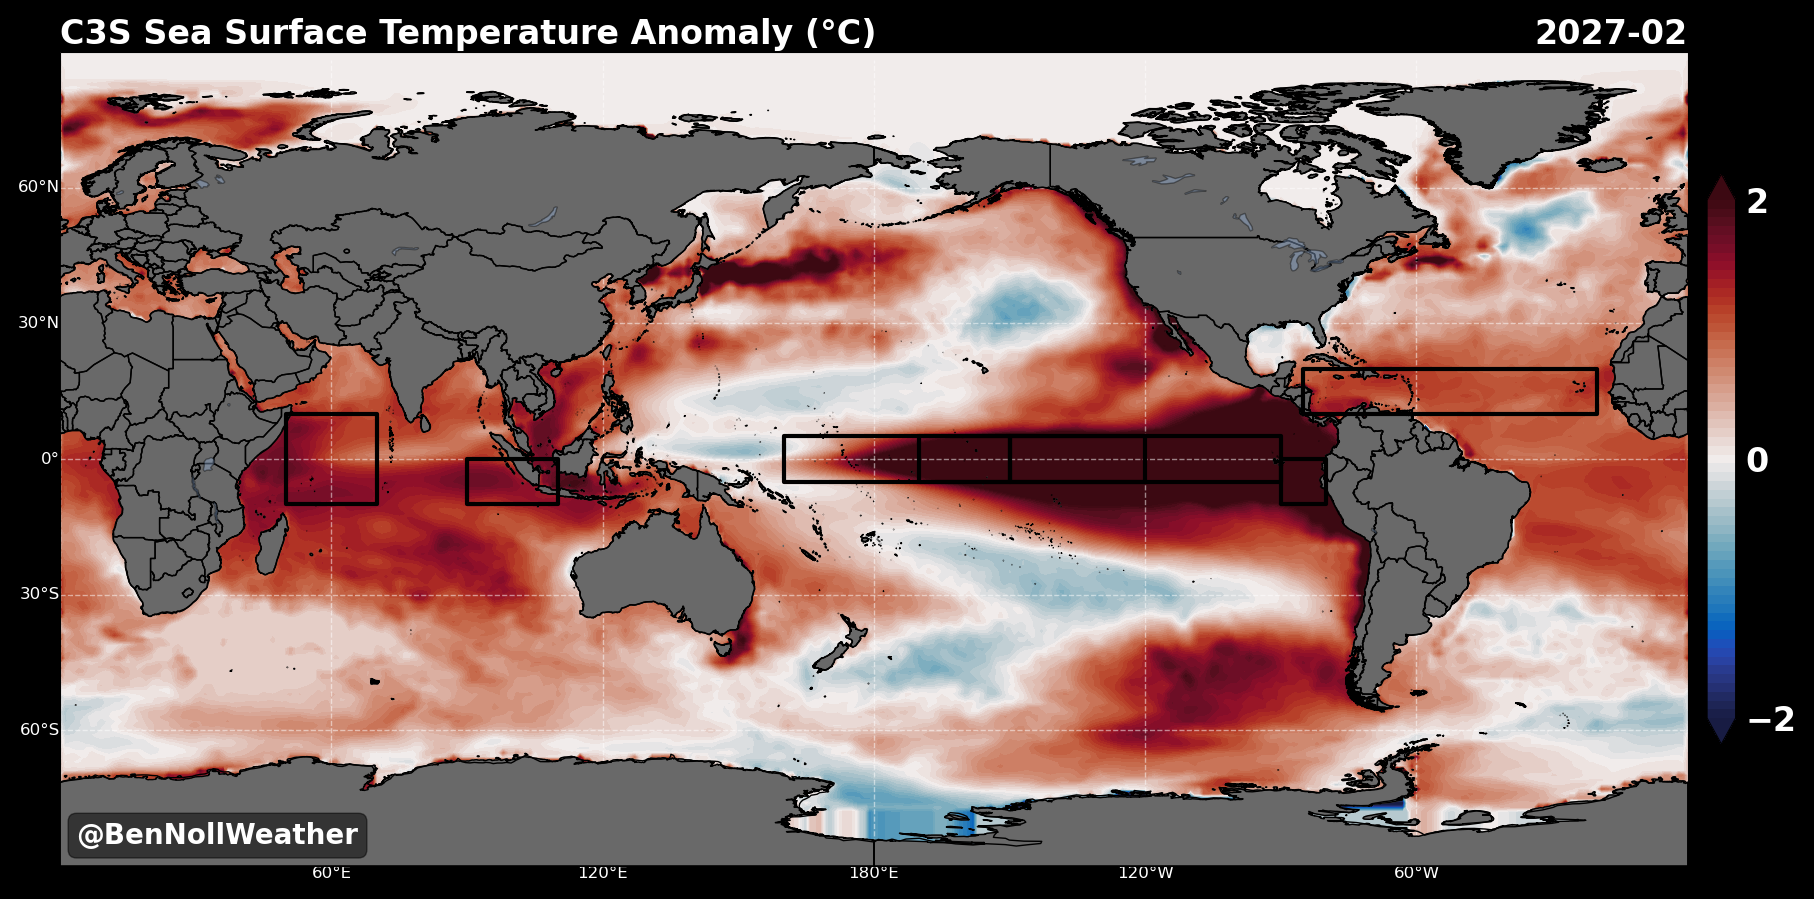
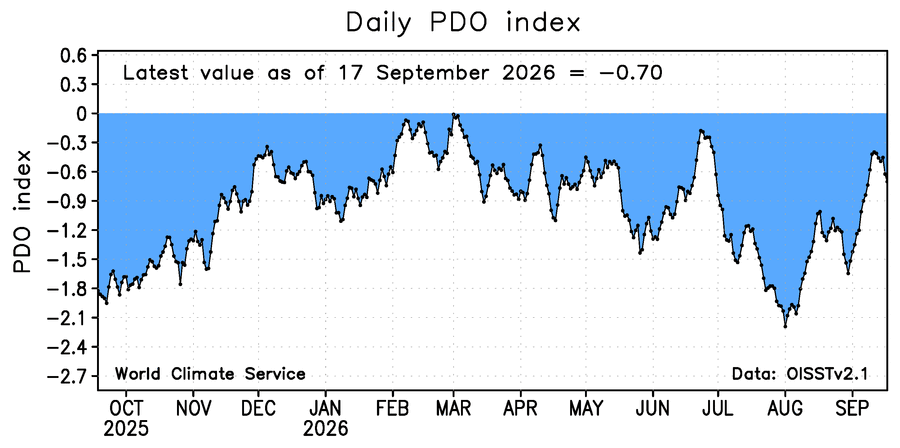
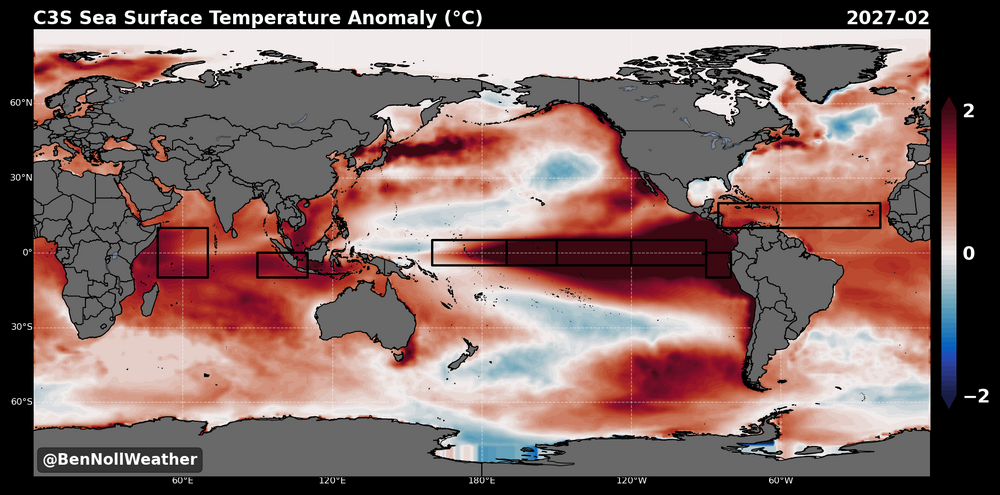
Probably related to how warm the subsurface is from Japan to south of the Aleutians. So every time the PDO rises it meets resistance right around neutral. Will be interesting to see what the ceiling is for the PDO as the super El Niño intensifies going into the late fall and winter. The Euro seasonal maintains the warm pool there through February.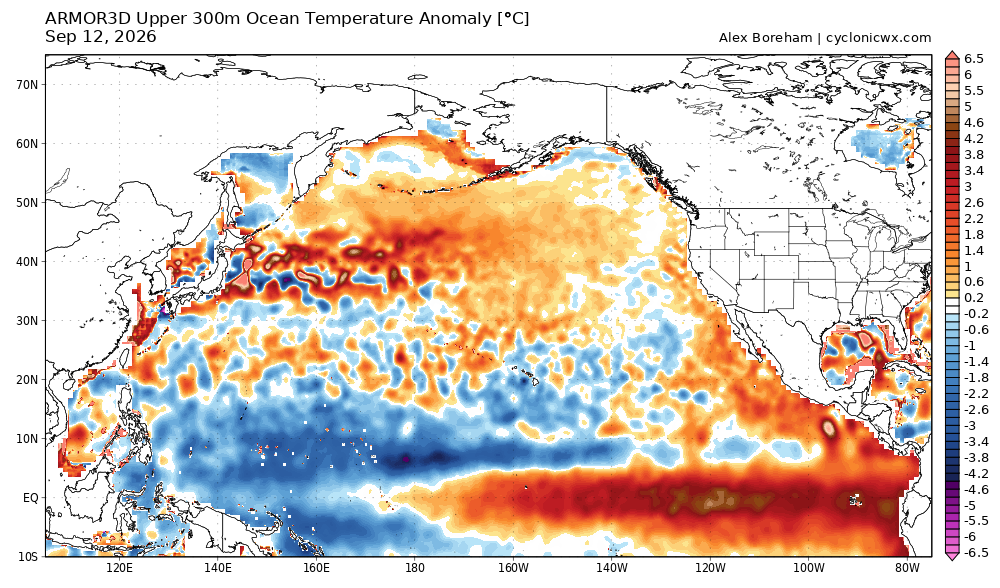
-

E PA/NJ/DE Autumn 2026 Obs/Discussion
Birds~69 replied to PhiEaglesfan712's topic in Philadelphia Region
I think you're good. Looks like Fall will arrive right on time early next week hopefully to stay... 74F/DP 58F
-
We have been in a pattern in Feb-March since 2018 - easily the most +dm on record for a 8-year consecutive period. It will be really interesting to see how this Winter goes in Feb-March in the PNA region - models have like -150dm. My guess would be closer to neutral.
-

E PA/NJ/DE Autumn 2026 Obs/Discussion
JTA66 replied to PhiEaglesfan712's topic in Philadelphia Region
Just turned off the AC. Is that it? Is it off until next spring or just wishful thinking? 74F/DP 57F -
Welllllll, maybe, maybe not. No doubt the ridge in eastern Canada is the wild card, but there are ridges across the globe and there's no guarantee the one in se Canada will be too warm or that it won't be centered further north. And exactly how it morphs over the season will obviously have something to say about it, as I think we both agree it will become more forgiving after December. That said, I still don't hold much hope for December simply due to climo. P.s Just so that you understand my pov, I don't care about monthly temps, only snowfall. And we can squeeze a storm out of a warm month.
-
That will help the Orioles go further south, if that's even possible
-
One thing I am really starting to hone in on as we get closer to go-time is the split forcing that is prevalent until Feb, when the east-basin backs off a bit....but everything about this season screams "bipolar".
-
Looks like it
-

Septorcher 2026 Discussion - Endless Summer
Cyclone-68 replied to Damage In Tolland's topic in New England
I was speaking more about the borrrrringgness about it but you’re not wrong -
Front has gone through. Steady dry northerly wind at oriole park.
-

Septorcher 2026 Discussion - Endless Summer
kdxken replied to Damage In Tolland's topic in New England
And for the end of the week? A solid nobody knows? Some models are spitting out some hefty rainfalls. I hate rain. "Finally, the guidance suite is hinting at a possible coastal low pressure some time Thursday into Friday. However, there are rather large variances in track and timing. For example, the 12Z GFS has a low pressure over the Gulf of Maine at 8 AM next Friday. Meanwhile, the 12Z ECMWF has this same low pressure about 300 miles east of southern MD for this same time. Different positions also lead to different tracks due to interactions with a mid level trough." -
Septorcher 2026 Discussion - Endless Summer
kdxken replied to Damage In Tolland's topic in New England
Do you mean incoming weather? I thought this week has been pretty sweet. -
Like I told you before, it's not going to be too warm under the ridge, which will be over se Canada this year...it was over the SW US the past two seasons. Apples and oranges to compare it this year.
-
2026-2027 Record-breaking El Nino
40/70 Benchmark replied to Stormchaserchuck1's topic in Weather Forecasting and Discussion
I would argue that it's a bit of a net positive, but nor argument that it's not anywhere approaching comensurate with the magnitude of El Niño. -
Totally getting missed with the rain and storms tonight.
-
Really unusual fall into spring pattern that year. All-time October warmth followed by not much winter to speak of. Then the record late T of snow in May. Time Series Summary for NEWARK LIBERTY INTL AP, NJ - Month of Oct top 5 warmest maximum temperature Click column heading to sort ascending, click again to sort descending. 1 2019 96 0 2 1941 93 0 3 1949 92 0 4 1959 91 0 5 1939 90 0 - 1938 90 0 - 1908 90 0 Monthly Data for October 2019 for Upton NY NWS CWA Click column heading to sort ascending, click again to sort descending. NJ NEWARK LIBERTY INTL AP WBAN 96 NY LAGUARDIA AIRPORT WBAN 95 NJ HARRISON COOP 95 NJ TETERBORO AIRPORT WBAN 95 NY JFK INTERNATIONAL AIRPORT WBAN 95 NJ CANOE BROOK COOP 94 NJ CALDWELL ESSEX COUNTY AP WBAN 94 NY NY CITY CENTRAL PARK WBAN 93 NY SHRUB OAK COOP 91 CT STAMFORD 5 N COOP 91 NY RIVERHEAD RESEARCH FARM COOP 91 NY MOUNT SINAI COOP 91 NY FARMINGDALE REPUBLIC AP WBAN 90
-
Septorcher 2026 Discussion - Endless Summer
Cyclone-68 replied to Damage In Tolland's topic in New England
April in perpetuity would be hell lol -
2026-2027 Record-breaking El Nino
40/70 Benchmark replied to Stormchaserchuck1's topic in Weather Forecasting and Discussion
It should.....the main argument against a better expression of El Ninoi is the CC enhanced MC regime destructively interfering, but I don't think anyone would argue that the S Hem isn't experiencing CC, as well. -

Septorcher 2026 Discussion - Endless Summer
Brewbeer replied to Damage In Tolland's topic in New England
it could be worse .... it could be April 71/56 at sunset -
a tornado went over a mountaintop at Kaysville, Utah today
-
 https://getbelvion.com/# Cheapest Sildenafil online