All Activity
- Past hour
-
Chile… y’all peep this mess?! This hurricane bout to WILD OUT on somebody mama, I just know it
-
This is likely going to end up as Humberto per 12Z model consensus including UKMET: NEW TROPICAL CYCLONE FORECAST TO DEVELOP AFTER 102 HOURS FORECAST POSITION AT T+102 : 20.7N 59.6W LEAD CENTRAL MAXIMUM WIND VERIFYING TIME TIME POSITION PRESSURE (MB) SPEED (KNOTS) -------------- ---- -------- ------------- ------------- 0000UTC 26.09.2025 108 20.9N 59.8W 1010 36 1200UTC 26.09.2025 120 21.5N 60.5W 1008 35 0000UTC 27.09.2025 132 22.4N 60.7W 1005 41 1200UTC 27.09.2025 144 23.2N 60.9W 1002 40 0000UTC 28.09.2025 156 24.8N 61.5W 999 42 1200UTC 28.09.2025 168 26.1N 62.8W 996 44
-
 tilly lilly changed their profile photo
 -
Of the 12Z ops, only the GFS has a TC from this. Some GEFS members also have a TC.
-
2. East of the Windward Islands: Another tropical wave located more than 500 miles to the east of the Windward Islands is currently is producing a small area of disorganized showers and thunderstorms as it moves quickly westward. Earlier satellite-derived wind data indicated the wave does not have a closed circulation. Environmental conditions appear only marginally conducive for further development over the next several days as the wave continues to move quickly westward to west- northwestward at around 20 mph. By the latter part of this week, the system is expected to slow down and turn more northwestward to the north of Hispaniola. Regardless of development, the system is expected to bring gusty winds and showers for portions of the Leeward Islands on Tuesday. * Formation chance through 48 hours...low...10 percent. * Formation chance through 7 days...low...20 percent.
-
1. Central Tropical Atlantic: A broad tropical wave in the central tropical Atlantic is producing limited showers and thunderstorms well to the west-southwest of the Cabo Verde Islands. Although environmental conditions are not favorable for initial development of this system over the next day or two, these conditions should gradually become more favorable for development by the middle to latter part of this week, and a tropical depression could form while the system moves west-northwestward to northwestward across the central Atlantic. * Formation chance through 48 hours...low...near 0 percent. * Formation chance through 7 days...medium...50 percent.
-
tilly lilly joined the community
-
Enjoy
-
Sky looks like early August with all the towers
-

September 2025 OBS-Discussion centered NYC subforum
donsutherland1 replied to wdrag's topic in New York City Metro
Through the first three weeks of September, JFK Airport, LaGuardia Airport, and Central Park have all recorded a monthly high temperature of 86°. The last time all three sites had the same monthly high temperature was August 2024 when the peak temperature was 95°. The last time all three sites had the same highest temperature in September was 2011 when the highest temperature was also 86°. There is a single case where all three sites recorded identical highest and lowest monthly temperatures: November 1957 with a monthly high of 66° and a monthly low of 28°. Back to the present, temperatures will top out mainly in the lower and middle 70s tomorrow. It will then turn noticeably warmer on Tuesday before another cool front crosses the region on Wednesday. Highs on Tuesday will likely reach the lower 80s with some middle 80s in the warmer spots. The advancing front could trigger some showers or thundershowers. Additional rain is possible Thursday into Saturday as a series of low pressure systems move along the frontal boundary. The ENSO Region 1+2 anomaly was -0.2°C and the Region 3.4 anomaly was -0.5°C for the week centered around September 10. For the past six weeks, the ENSO Region 1+2 anomaly has averaged +0.10°C and the ENSO Region 3.4 anomaly has averaged -0.37°C. La Niña conditions will likely develop during mid- or late-autumn. The SOI was +0.12 today. The preliminary Arctic Oscillation (AO) was +0.667 today. Based on sensitivity analysis applied to the latest guidance, there is an implied near 51% probability that New York City will have a cooler than normal September (1991-2020 normal). September will likely finish with a mean temperature near 69.1° (0.1° below normal). Supplemental Information: The projected mean would be 1.1° above the 1981-2010 normal monthly value. -
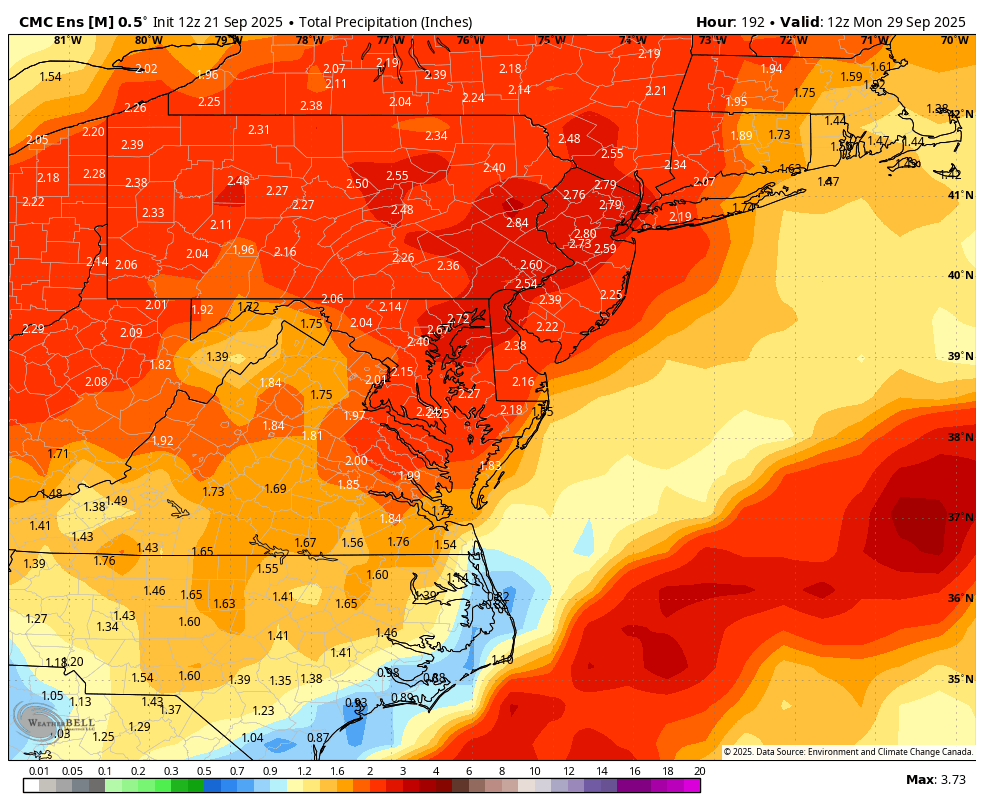
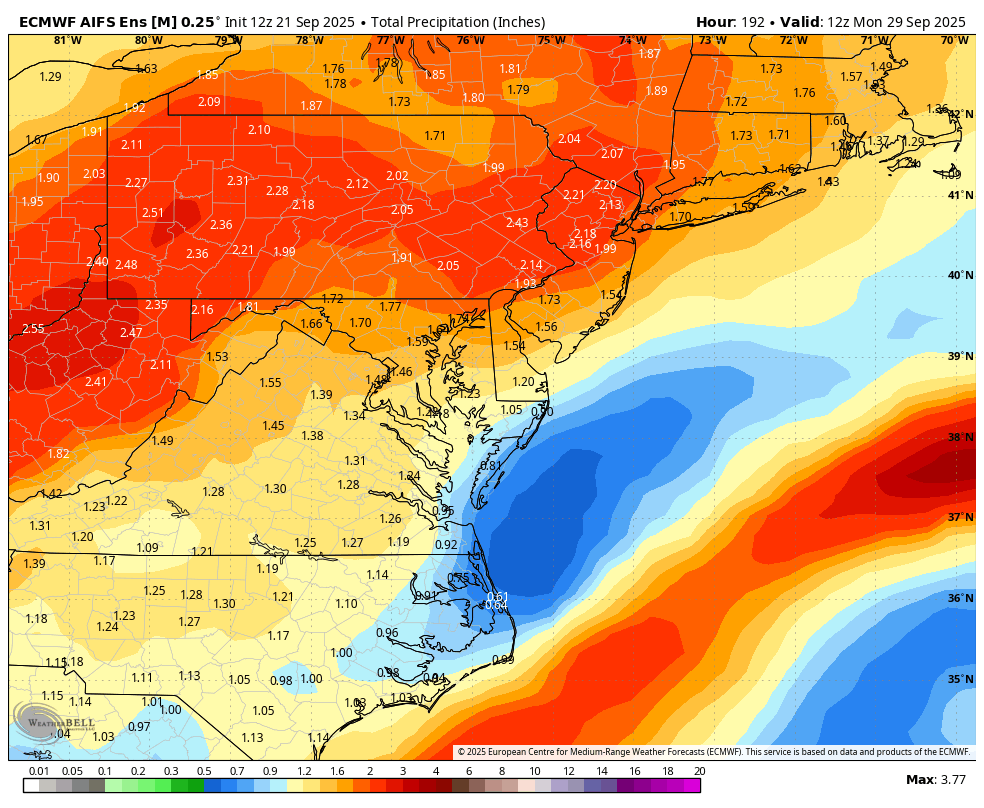
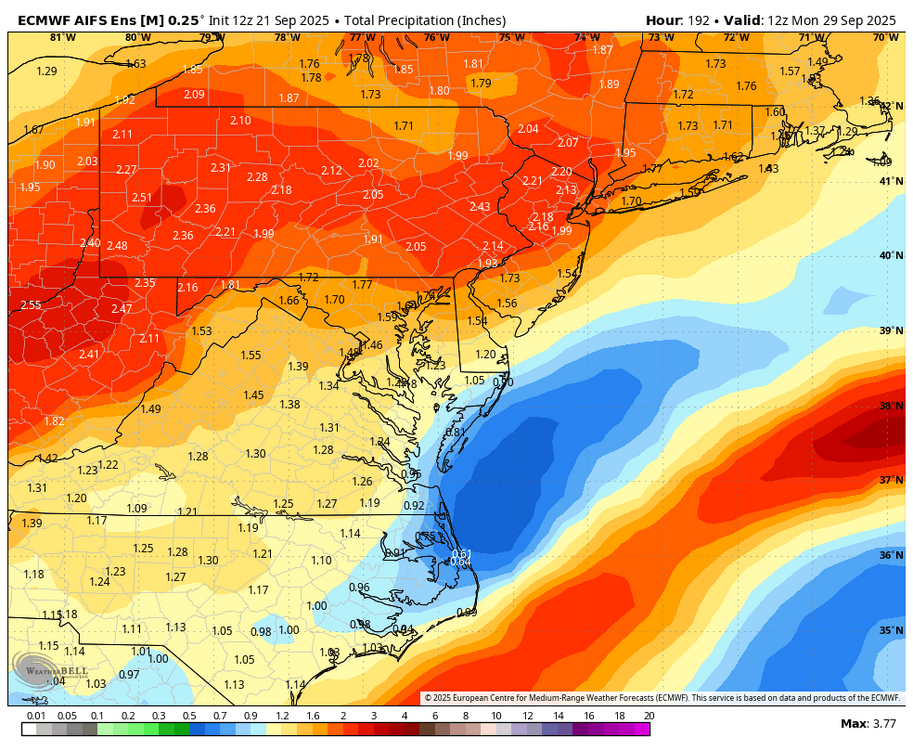
Euro tries to flood S NH. Does any soak in?
-
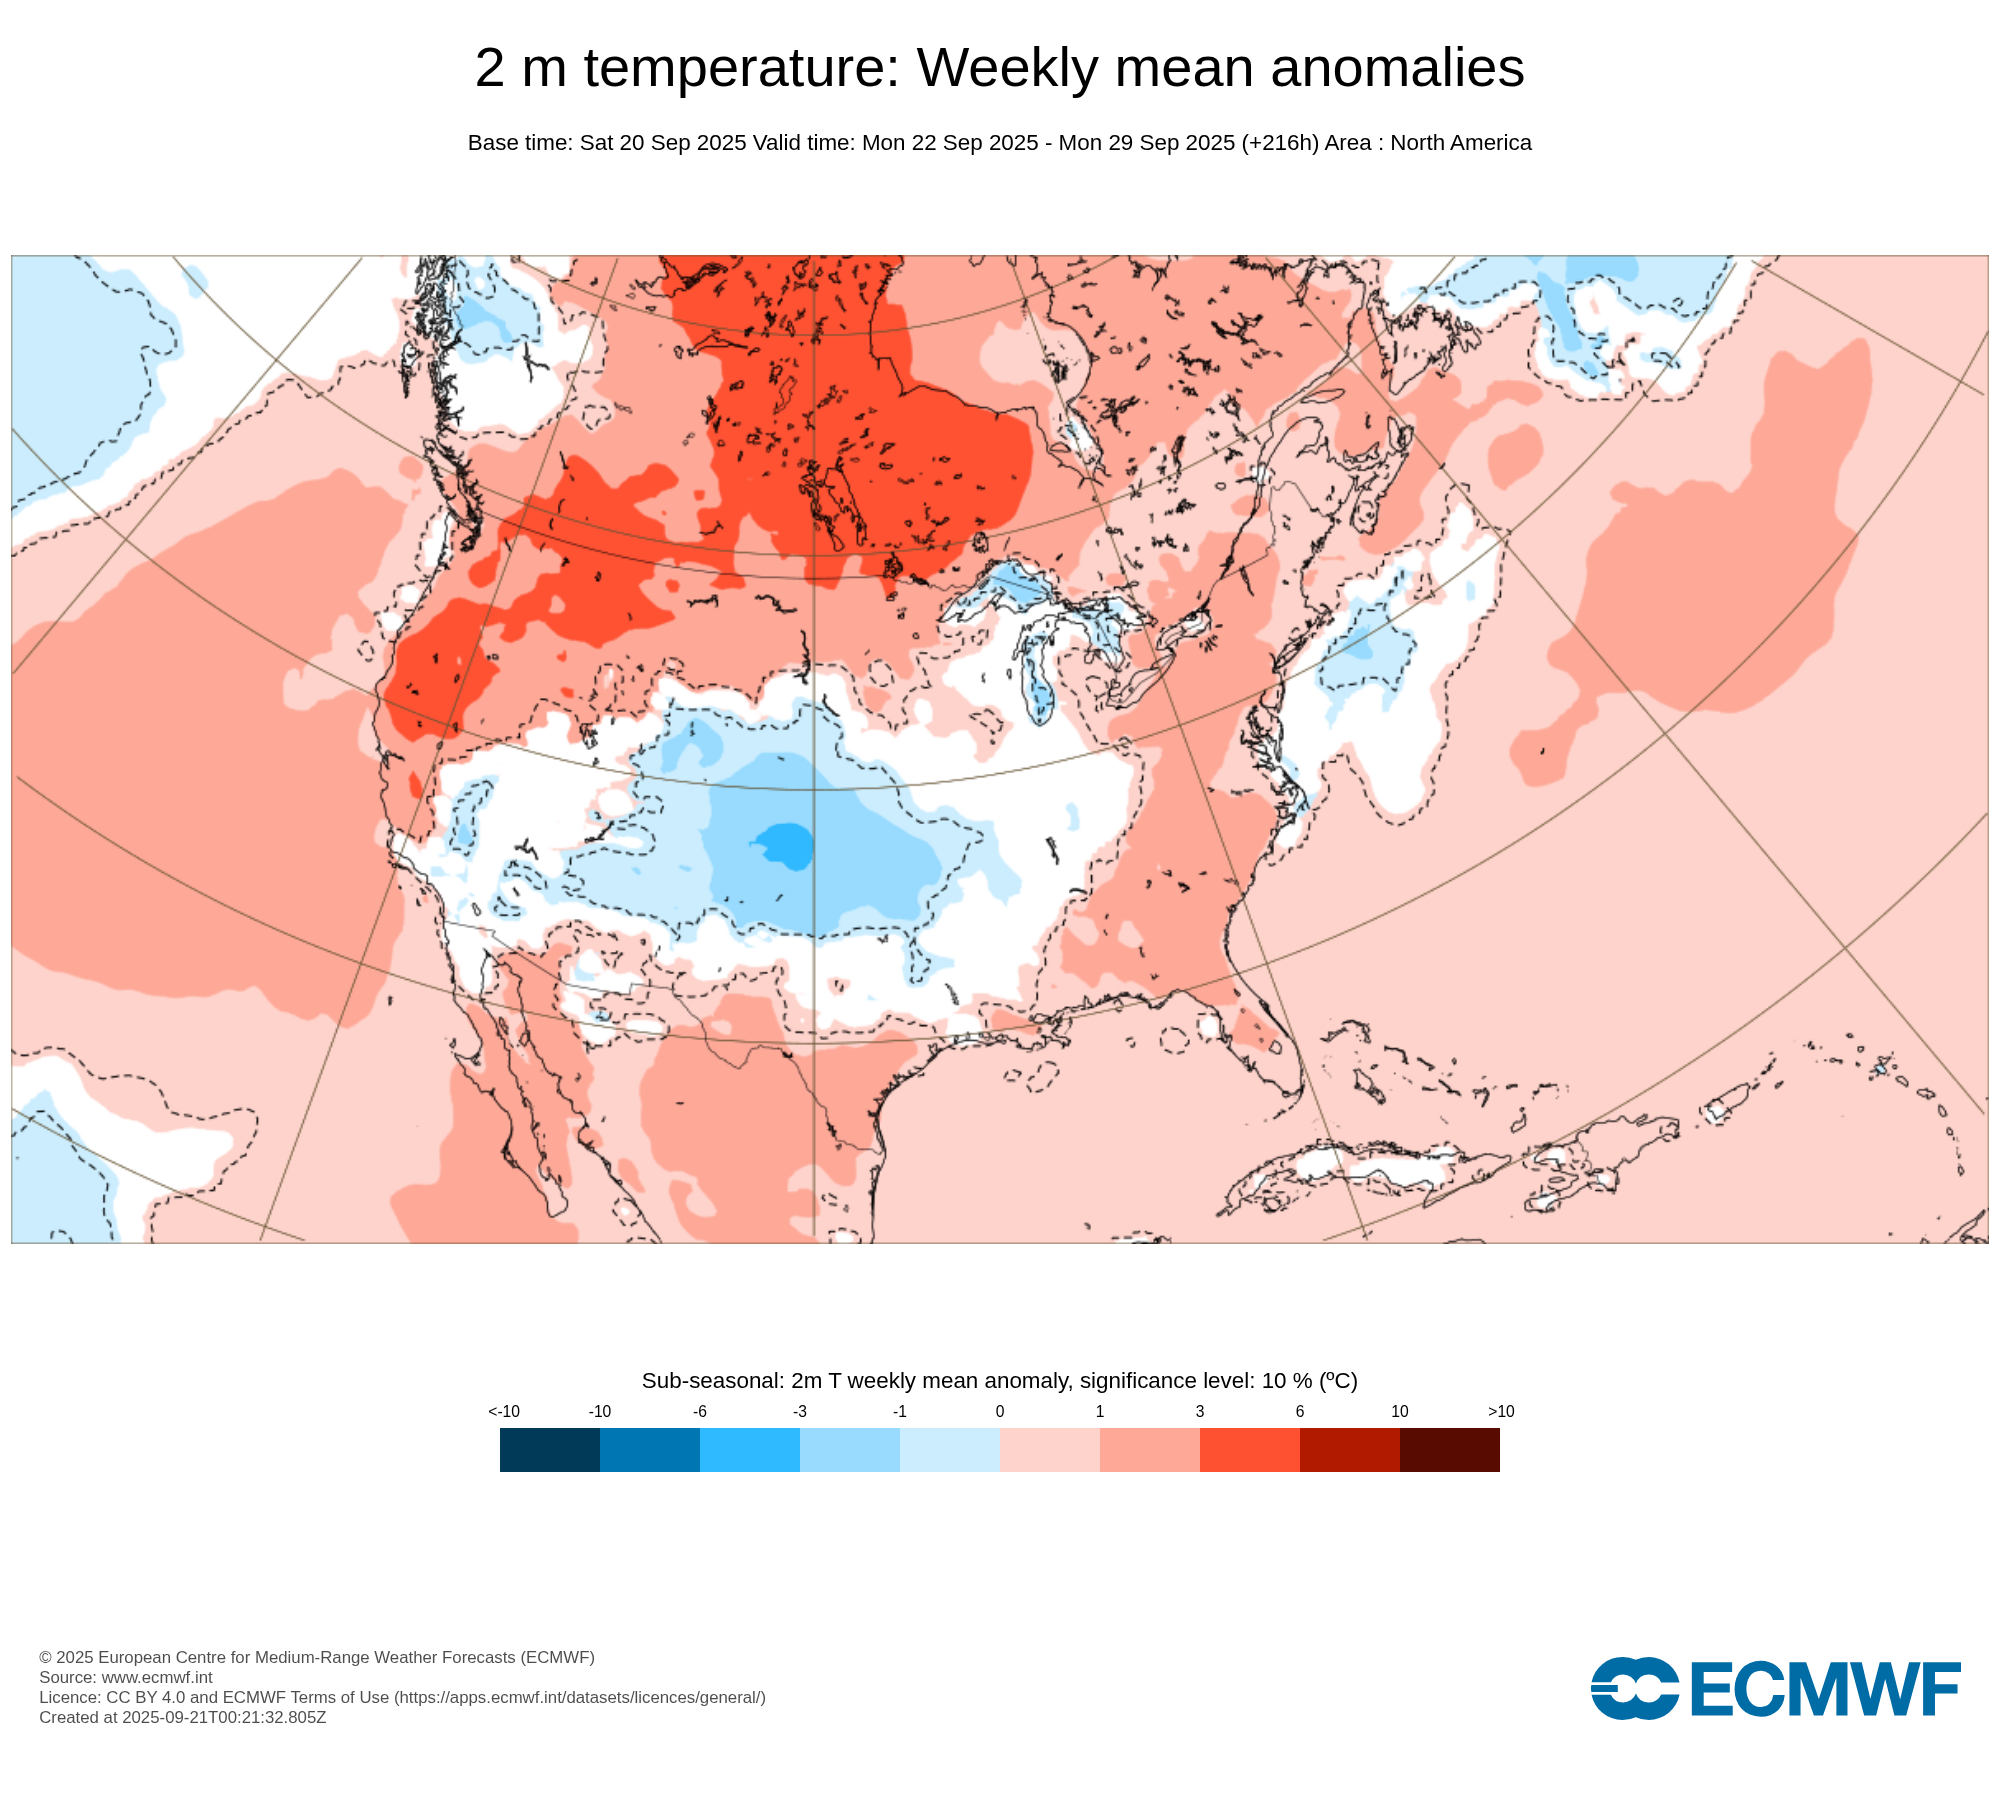
It's a warm pattern, so at least temps will be somewhat held in check. There will be some sun at times this week. We need the rain.
-
I think it’s a hurricane based on recon but sat presentation has degraded since the plane left. Not sure what happens with the system pretty huge spread in intensity guidance
-
September 2025 OBS-Discussion centered NYC subforum
donsutherland1 replied to wdrag's topic in New York City Metro
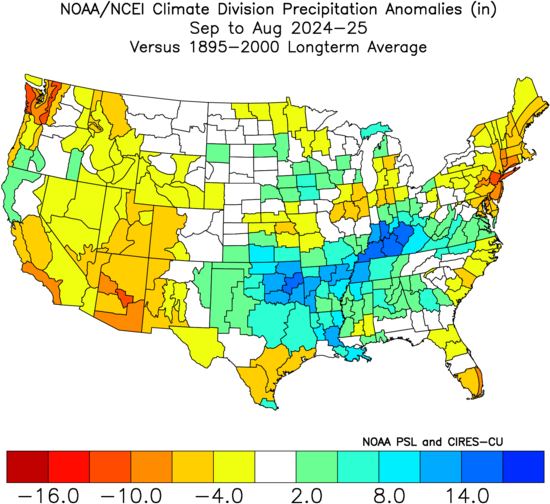
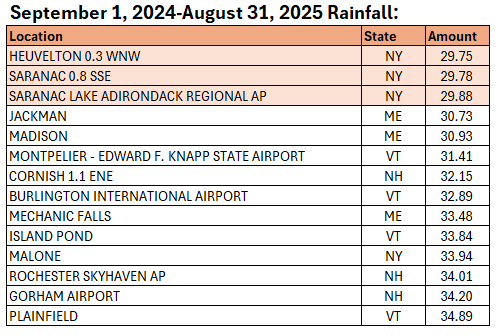
Lack of precipitation is one variable. Temperature is another. At higher temperatures, more soil moisture is lost to evaporation. Here's a comparison of September 1984-August 1985 vs. September 2024-August 2025 for the Northeast Region: 1984-1985: Temperature: 49th warmest (2.0°F cooler than 2024-2025) Precipitation: 35.23" (6th driest) Palmer Z-Index: -0.90 (13th driest) 2024-2025: Temperature: 13th warmest (2.0°F warmer than 1984-1985) Precipitation: 37.97" (23rd driest) Palmer Z-Index: -1.12 (7th driest) Numerous locations in New England with 0 days of missing data have seen < 35.00" precipitation over the 12-month period. Three such locations have seen < 30.00" precipitation. Bridgeport (27.62"), Islip, JFK Airport, LaGuardia Airport, Newark, and White Plains have all seen <35.00" of rain during the same period.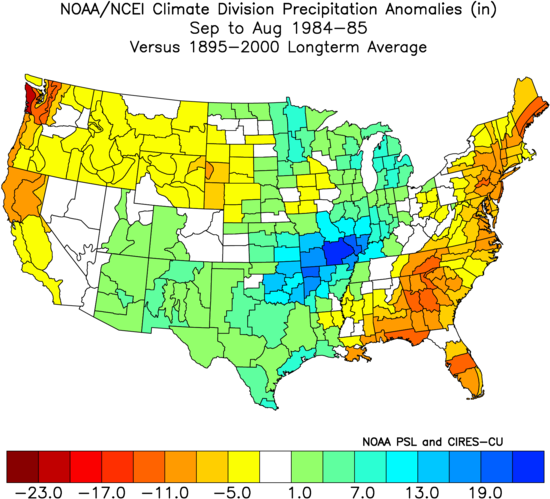
- Today
-
Thats what I think. Standard, council approved winter. No frills but it’ll do just fine.
-
3rd straight day it's rained here. I've had I've had over 2 inches of rainfall in 3 days. Had a high of 77 yesterday. A low of 53 this morning and a current temp of 67.
-

2025 Atlantic Hurricane Season
WxWatcher007 replied to BarryStantonGBP's topic in Tropical Headquarters
Definitely a grain of salt but anything in that region would be worth watching with uncertainty about the depth and orientation of next week’s trough. This is pretty similar to what I thought in my peak season outlook with activity concentrated in the SW Atlantic. The late month CAG signal seems muted for now. -
Mount Holly forecast has cloudy weather for 6 days in a row. How depressing
-

September 2025 OBS-Discussion centered NYC subforum
TheClimateChanger replied to wdrag's topic in New York City Metro
There is over two months of data missing from that summer (65 days), so that amount shown is based on less than a month. -
It always does
-
Yeah, the only 12Z op with this as a TC is the GFS though a few of its ensembles also have a TC (more noisy than earlier runs). Thus, I’m taking the GFS with a huge grain at least as of now.
-
Should see some rain here. Euro looked wet.
-
Let's hope, my new lawn needs rain
-
I continue to fear what late seasons are capable of producing based especially on the recent past. Having 3 of the 7 most active Oct-Dec periods ACEwise (70+) during just the last 9 seasons is not comforting at all. Moreover, 3 of the last 6 (50%) La Niña seasons (2024 per RONI counts as La Niña) were in these top 7! The one somewhat comforting thing, however, is the relative slowness of 2025 so far and how that affects the chances for a highly active Oct-Dec. There appears to be some correlation between how active a season is prior to Oct and how active is a season Oct-Dec, which means that having a relatively slow season through Sep does appear to reduce the chance for a very active Oct-Dec (50+ ACE) somewhat vs that chance when pre-Oct isn’t slow: Seasons with 50+ ACE during Oct-Dec: Year/pre-Oct ACE/Oct+ ACE 2024: 78/84 2020: 106/75 2016: 59/80 2005: 171/75 1969: 93/57 1963: 49/63 1961: 134/55 1950: 157/54 1932: 87/82 1894: 59/76 1893: 159/73 1887: 123/59 1878: 84/97 Per this list based on each era’s normal ACE, the pre-Oct ACE for these 13 very active Oct-Dec was as follows: - 6 MA normal (2005, 1961, 1950, 1893, 1887, 1878) - 3 AN (2020, 1969, 1932) - 1 NN (1894) - 3 BN (2024, 2016, 1963) So, 50+ Oct-Dec years have been heavily biased toward pre-Octs that were active. Where is 2025 headed for pre-Oct? Through Gabrielle, the prog is for ~~55. Then there’s the current MDR orange. The consensus has this as TS Humberto by 9/26-7 and a H soon after. That would have a realistic potential of 10-15 ACE 9/26-30. So, that would get total 2025 pre-Oct ACE to as much as ~65-70. That compares to 94 for the 1991-2020 pre-Oct avg, which means 2025 pre-Oct will end up solidly BN just about regardless of what Gabrielle and Humberto do. What does this tell me? With 2025 almost definitely headed for BN pre-Oct, the chance for a 50+ Oct-Dec is <50%. However, 2024, 2016, and 1963 as well as 3 of the most active 7 Oct-Dec on record having occurred just within the last 6 La Niña seasons also say don’t bet the farm on <50 for Oct-Dec at least as of yet.
-
WB 12Z ensembles thru Day 8. Welcome rain still on the map!

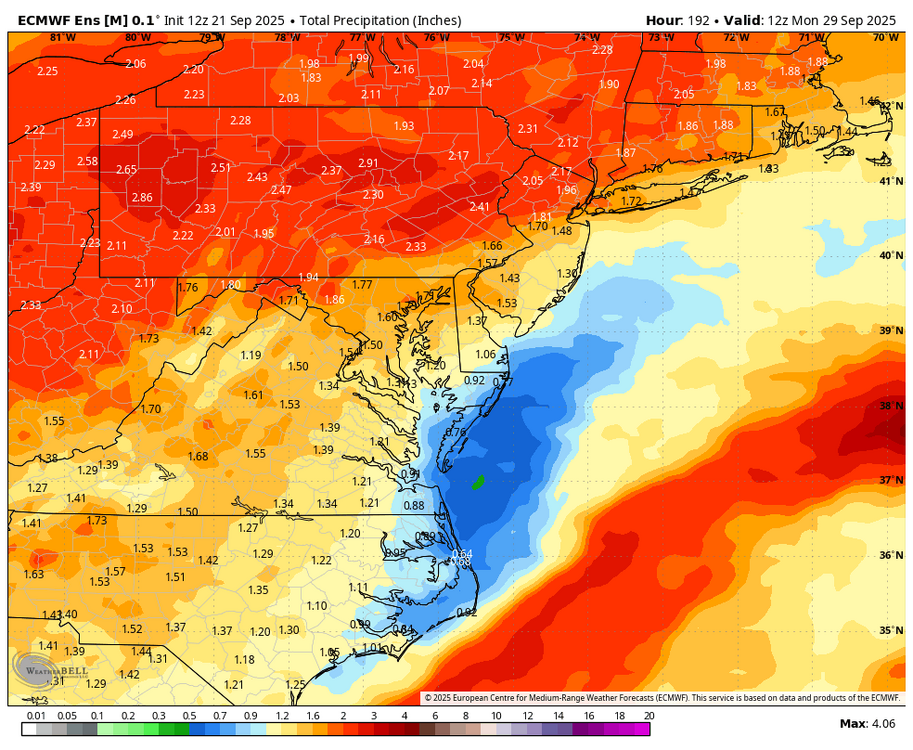
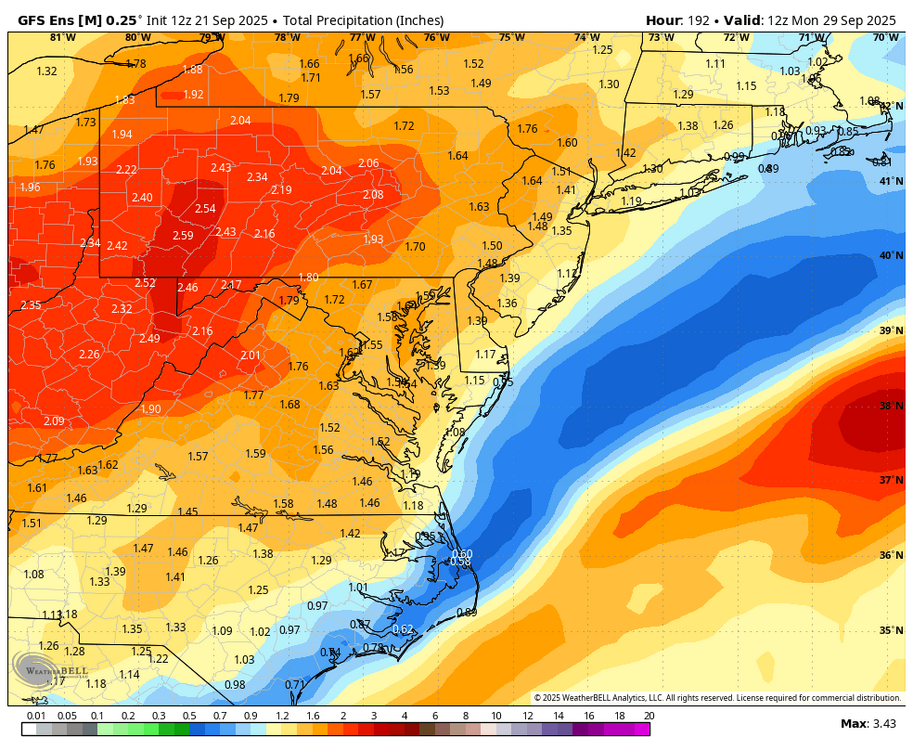
-
Wagons north finally . Or good luck is over
-

September 2025 OBS-Discussion centered NYC subforum
bluewave replied to wdrag's topic in New York City Metro
We’ll see if a piece of the over the top warm up in Canada near the end of September can build down into the Northeast in October.