All Activity
- Past hour
-

February 2026 Medium/ Long Range Discussion: 150K Salary Needed to Post
Amped replied to Weather Will's topic in Mid Atlantic
It does have some potential. If it doesn't pan out, we're probably in "Better luck next year territory" -
97-98 was a huge El Nino, then we were followed by 3 La Nina's, 2 Strong Nina's. Huge El Nino's have been reversed in the following 3 years. Something interesting to ponder. Is it because of these strong El Nino states that we are getting multi-year Nina states in the years that follow? It's been a decadal pattern though, yeah, starting after the 97-98 Super Nino. Some think it's because of the low solar 2001-2020 that we hadn't seen that low since the 1800s.
-
 That date is my last analog date so let’s buckle up. I like the angle of the cold
 -

February 2026 Medium/ Long Range Discussion: 150K Salary Needed to Post
bncho replied to Weather Will's topic in Mid Atlantic
Chuck is like Spock. He's very smart and rational, but he's always such a buzzkill. -
Wasn’t that the huge El Niño in 98 and things do seem different since about then ?
-
Well yeah. And they almost all sucked ass.
-
Per RONI, 5 of the last 6 years (20-26) have been La Nina. Per RONI, 7 of the last 10 years (16-26) have been La Nina. Per RONI, 11 of the last 19 years (07-26) have been La Nina. Per RONI, 15 of the last 28 years (98-26) have been La Nina. That's >50% La Nina since 1998. It should be 33.3%.
-
I think the southern hits over the past decade are Nina based Chuck. We have been stuck in a never ending cycle of watching the south get hit and then getting skipped while the Eastern Shore and occasionally NE gets hit as well. I know everyone is worried about a Nino. I am not. It is time to break the cycle of suck. Yes I am in a better spot to succeed in a Nino than the cities. But the cities have failed as well for almost a decade at this point. We need precip to target our area again. And I will take my chances with a wound up southern stream that is actually capable of cooling the column. There is nothing normal about the past 7 years of weather. Nothing at all.
-
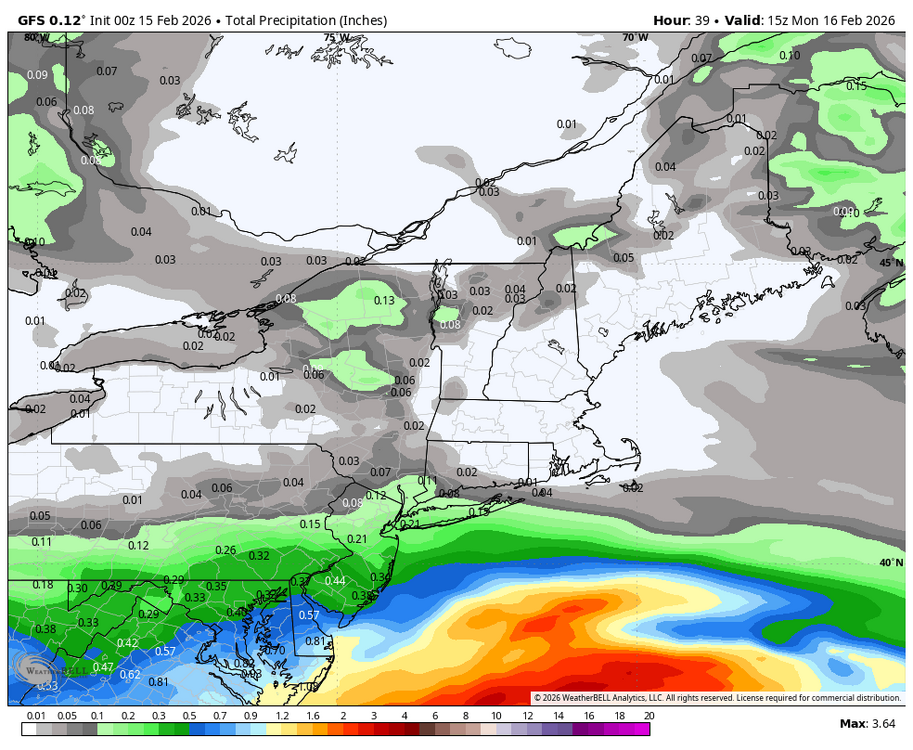
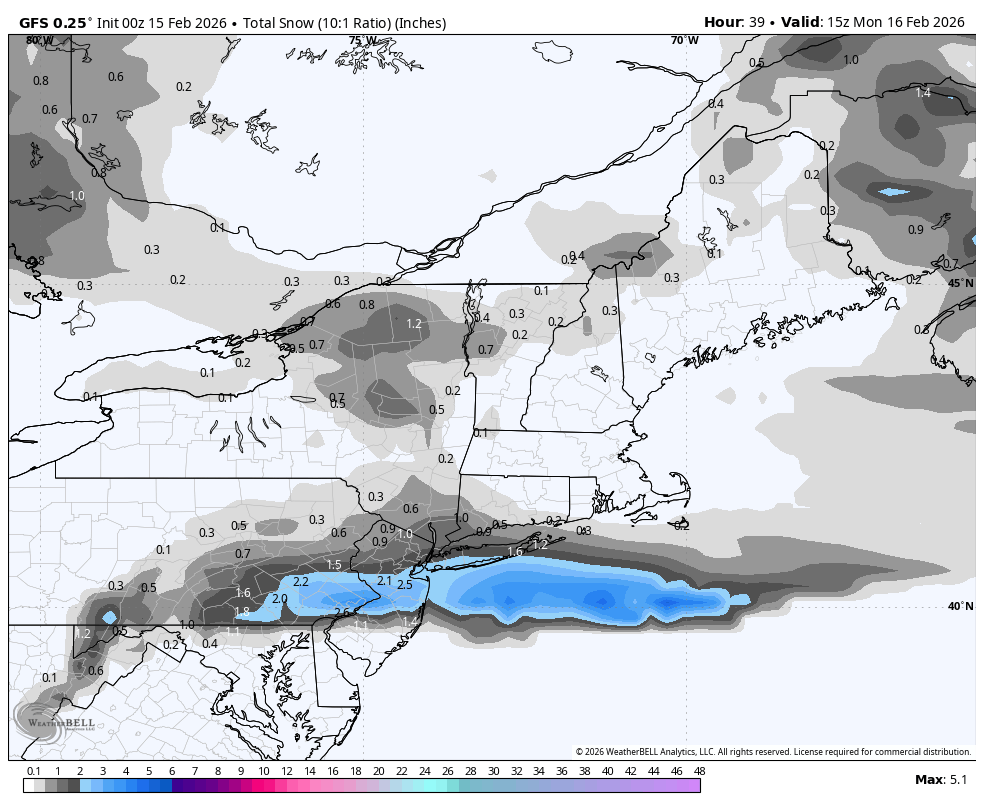
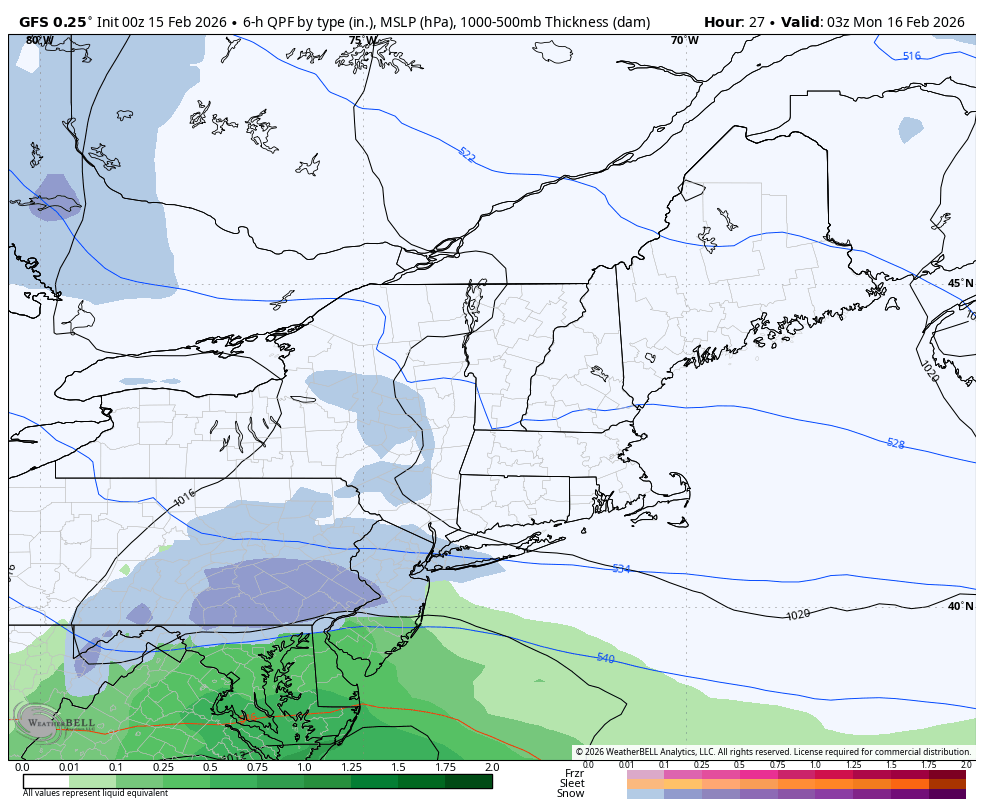
 Nice cold shot on 0z GFS. Dry, but one more dip into Winter
 -
Brush your car off expectation, hopefully good. Plowable, will likely be disappointed.
-
Well, I locked the thread, some asshole @Rjayunlocked it. I take no responsibility.
-
 Outright rooting for torches in February on a board full of cold and snow lovers.
 -
Early Monday morning 2/16 last minute event OBS/Discussion
JTA66 replied to The Iceman's topic in Philadelphia Region
Final call: pasty car topper -
I love snow, but 4 months of cold for flurries more 6x so far this year is not worth it lol. I love being outside, having the windows open and stuff. I love the Spring. GFS looks cooler though. After Feb 19-20, looks like another decent cold shot thereafter. Kind of keeping up with the theme of the Winter so far.
-
 Never knew you were a heat miser Chuck, lol
 -
This past 15 day run following the mega sleet storm down here was pretty dang epic (deep winter wise) .... It could've been better with the Carolina storm just to our south... But without the sleet bomb it would have been a disappointing winter with the potential that we had...
-

E PA/NJ/DE Winter 2025-26 Obs/Discussion
mattinpa replied to LVblizzard's topic in Philadelphia Region
1-3” will be a nice little refresher. But I’m satisfied with this winter due to prolonged cold, prolonged snowpack and a 10”+ storm here. More snow is a bonus. Yes, may not get a 12-24” this winter, but those are rare. -
Backdoor front Feb 19 on 0z GFS, keeping us in the 40s. Let's see what the Euro shows. GFS not really a good model.
-
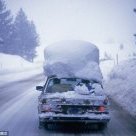
Awesome picture , reminds me of nighttime trips up to the Blue Ridge Parkway after a snow storm ... Road is always closed after a winter storm but you can still get up there and walk...
-
I grew up in the golden era of 1958-71 and to my memory we skated on the pond every winter except two . Sledded every one at some point Im pretty sure
-

Central PA Winter 25/26 Discussion and Obs
Blizzard of 93 replied to MAG5035's topic in Upstate New York/Pennsylvania
0z GFS keeps hope alive for tomorrow evening with up to 2 inches for the LSV this run.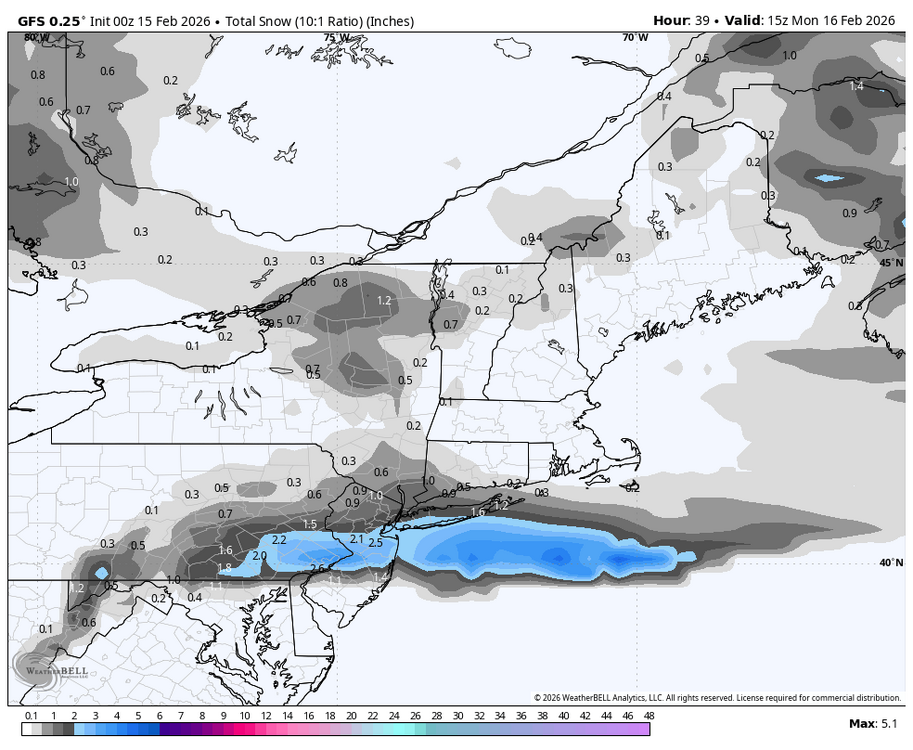
- Today
-

E PA/NJ/DE Winter 2025-26 Obs/Discussion
RedSky replied to LVblizzard's topic in Philadelphia Region
Why yes, yes it is -

Winter 2025-26 Medium/Long Range Discussion
Harry Perry replied to michsnowfreak's topic in Lakes/Ohio Valley
Right around 74” here, was more than I was expecting. 12th snowiest season as of now. All for breaking records.. if we get enough warmth like what’s forecasted this week and melt all that lake ice then have the bottom fall out toward the end of the month temp wise, we could have a shot at some top notch records. -

Central PA Winter 25/26 Discussion and Obs
Jns2183 replied to MAG5035's topic in Upstate New York/Pennsylvania
Subject: 90 Years of Harrisburg (MDT) Hourly Weather — Full Deep Dive (1935–2025) Alright everyone, stuck at home in bed I went down the rabbit hole so you don’t have to. I pulled the entire hourly MDT dataset from 1935 through March 30, 2025 — roughly 701,600 hourly observations spanning just over 90 years. This wasn’t a daily summary skim. This was raw hourly temperature, dewpoint, precipitation, visibility, and related fields. Before I even looked at stats, I did cleanup and QC because raw long-term station data is messy: --- Data Cleaning & Methodology 1. File scope Period: Feb 1935 – Mar 2025 ~701,594 hourly bins Observations normalized to hourly resolution (multiple obs per hour consolidated) 2. QC steps Removed physically impossible dewpoints (e.g., below −80°F artifacts) Filtered obvious temperature spike errors (one 60°F+ 6-hour swing in 2013 was clearly a glitch) Precipitation analysis restricted to hours where precip reporting was valid (so “missing” ≠ “dry”) For daily metrics (high/low, freeze dates, heat streaks), only days with sufficient hourly coverage were used Snow depth largely unavailable in this dataset (only ~200 total depth entries), so snow retention metrics were excluded This gives us a dataset that is physically realistic and trend-consistent. --- The Results Absolute Extremes Coldest hour: −22°F (Jan 21, 1994 at 12:00) Hottest hour: 105°F (July 23, 1991 at 20:00) That’s a 127°F total observed range at MDT. --- The “Weather Whiplash” Award Largest temperature swings (QC’d): Largest 6-hour warm-up: +39.96°F (March 31, 1943) Largest 6-hour cool-down: −43.02°F (March 1, 1937) Classic Mid-Atlantic frontal violence. --- Longest Deep Freeze Continuous ≤32°F streak: 398 consecutive hours Jan 19 – Feb 4, 1961 ~16.6 straight days below freezing Runner-up: Dec 25, 2017 – Jan 9, 2018 (363 hours) So yes — modern winters can still lock in. --- Freeze–Thaw Chaos Index I counted crossings of 32°F in winter (Nov–Mar). Most chaotic winter: 1941 (188 crossings) Modern median winter: ~60 crossings That’s a real structural shift in winter volatility. --- Heat Wave Persistence (Daily-Based) Consecutive days with highs ≥90°F: Longest streak: 16 days (July 26 – Aug 10, 1983) Next longest: 15 days (July 1955) Hourly streaks don’t tell the real story because nights cool. Days do. --- The “Swamp Index” Defined as: Temp ≥90°F AND Dewpoint ≥70°F Total oppressive hours in record: 2,348 Top oppressive years: 1952 (92 hours) 1959 (87) 1949 (84) 1991 (83) Mid-century humidity was not subtle. --- Fog / Visibility Shift Hours with visibility ≤1 mile: Total: 22,368 hours ≤0.25 mile (“pea soup”): 4,860 hours By decade: 1940s–50s: ~5–6% of hours ≤1 mile 2000s–2020s: ~1.5–1.7% That is a massive drop. Possible contributors: Instrument changes Air pollution regulation Land use changes Reporting practices But the decline is statistically obvious. --- “Perfect Weather” Hours Defined as: 65–75°F Dewpoint 45–55°F No precip Visibility ≥10 miles Total perfect hours: 4,484 Best months by frequency: 1. September 2. June 3. May July is loud. September is elite. --- Precipitation Extremes Largest 1-hour precip: 4.27" (July 23, 2017) Wettest 24-hour day (reliable coverage): 16.29" (Oct 11, 2013) Wettest 72-hour total: 22.66" ending Sept 8, 2011 Those 72-hour numbers are hydrologically serious. --- Dry Spells Longest continuous dry streak (with reporting active): 286 hours Oct 20 – Nov 1, 2024 ~11.9 days Longest continuous rain streak: 33 hours (Oct 16–17, 2009) --- “Most Normal” vs “Most Weird” Year I computed daily mean deviations from long-term day-of-year climatology. Lowest RMSE (most “boring” year): 2019 Highest RMSE (most structurally weird year): 1967 1967 wasn’t just warm or cold — it was off-pattern. --- Structural Climate Signals (The Interesting Part) Comparing 1936–1959 vs 2000–2024: Diurnal Temperature Range Early period: 17.94°F average daily range Modern period: 16.36°F Change: −1.58°F Days and nights are less swingy now. Night vs Day Warming Mean daily minimum change: +2.64°F Mean daily maximum change: +1.07°F Nights warming more than days is a classic humidification / greenhouse signature. Dewpoint Drift +0.79°F increase in daily mean dewpoint Combine: Warmer nights Slightly higher dewpoints Reduced diurnal range That suggests a shift toward a more moisture-retentive boundary layer and fewer extreme radiational cooling setups. --- Growing Season Length Using freeze date methodology: Earliest first fall freeze: Oct 16, 1939 Latest first fall freeze: Nov 13, 2024 Longest growing season: 233 days (2024) Shortest: 158 days (1983) Typical: ~203 days The envelope is expanding. --- Big Takeaways 1. The 1940s–1960s were much foggier and had more freeze–thaw volatility. 2. The 1980s still dominate heat wave duration. 3. Extreme precipitation events are clustered in the 2000s–2010s. 4. Nights have warmed faster than days. 5. Diurnal range compression is measurable. 6. Dewpoints are nudging upward. 7. Growing season envelope has widened. This isn’t just “it’s warmer now.” It’s structural atmospheric behavior shifting. Sent from my SM-S731U using Tapatalk -
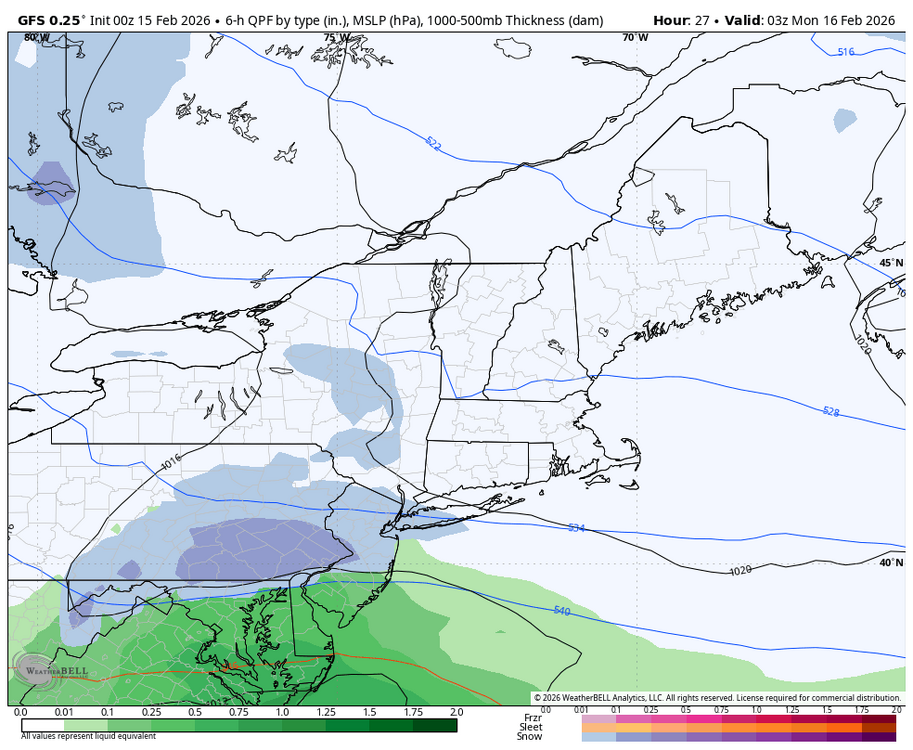
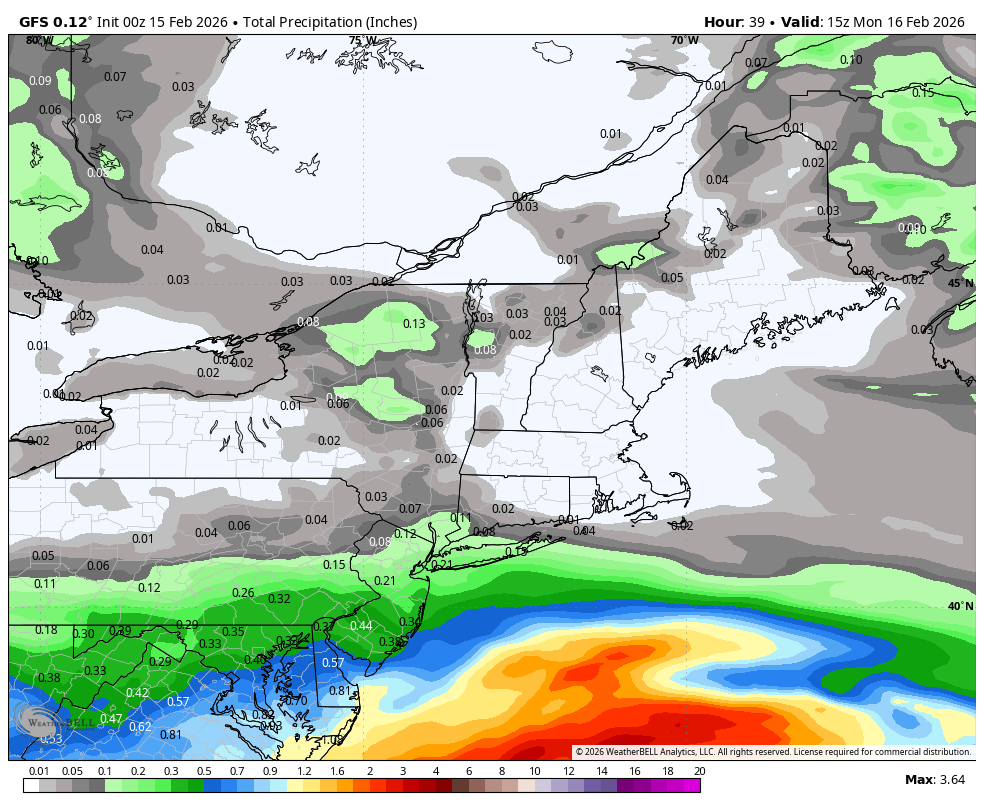
Gfs
.thumb.png.e69c880e3182ad49f0cd5c9e0f3a554c.png)


.png.9903370c62a8e9ce49b7cf048a3e3db0.png)