All Activity
- Past hour
-

Clipper Fires In Wednesday Feb 25 Disco/ Obs
NoCORH4L replied to Damage In Tolland's topic in New England
2" is meh. 4" during rush hour is closure. -
We got us a Winnah.
-

Outta gas and Outta Time: Early March Winter Storm finale
Solution Man replied to Ji's topic in Mid Atlantic

-
Similar here. The intangible for me is the lack of qpf. Until last Friday/Saturday there wasn’t much meat in the pack.
-
its getting tossed, i have no idea why they included it. Nothing around it supports that kind of amount. Could just be a mis-entry
-
I just didn't understand why you said "Ryan's" like that was his map, what does Ryan have to do with that map?
-

"Don’t do it" 2026 Blizzard obs, updates and pictures.
ORH_wxman replied to Ginx snewx's topic in New England
Ginxy has the same longitude as ORH but far enough inland and elevated to avoid a lot of the SE CT flatland problems with marine intrusion. Def a solid spot. He prob only averages a hair less than N Foster coop just up the road and a little higher. -

"Don’t do it" 2026 Blizzard obs, updates and pictures.
vortex95 replied to Ginx snewx's topic in New England
With this being said from CoastalWx, and him getting two 20"+ blockbusters in Weymouth in a month, I *never* want to hear him Cartman b*ticin' about no snow or saying "THIS BLOWS" again!!! Recall earlier this winter, "THIS PATTERN BLOWS" was said by him, even though it was much better overall for New England even early on w/ the big snows in Nov on Mt Mansfield. That should have set him on a more positive path for the odds of a good winter. -
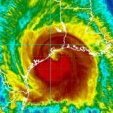
The Presidential Range on a bluebird day after the coastal storm:
-

"Don’t do it" 2026 Blizzard obs, updates and pictures.
Ginx snewx replied to Ginx snewx's topic in New England
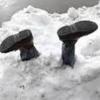
Wind and sun making forms on the deck rail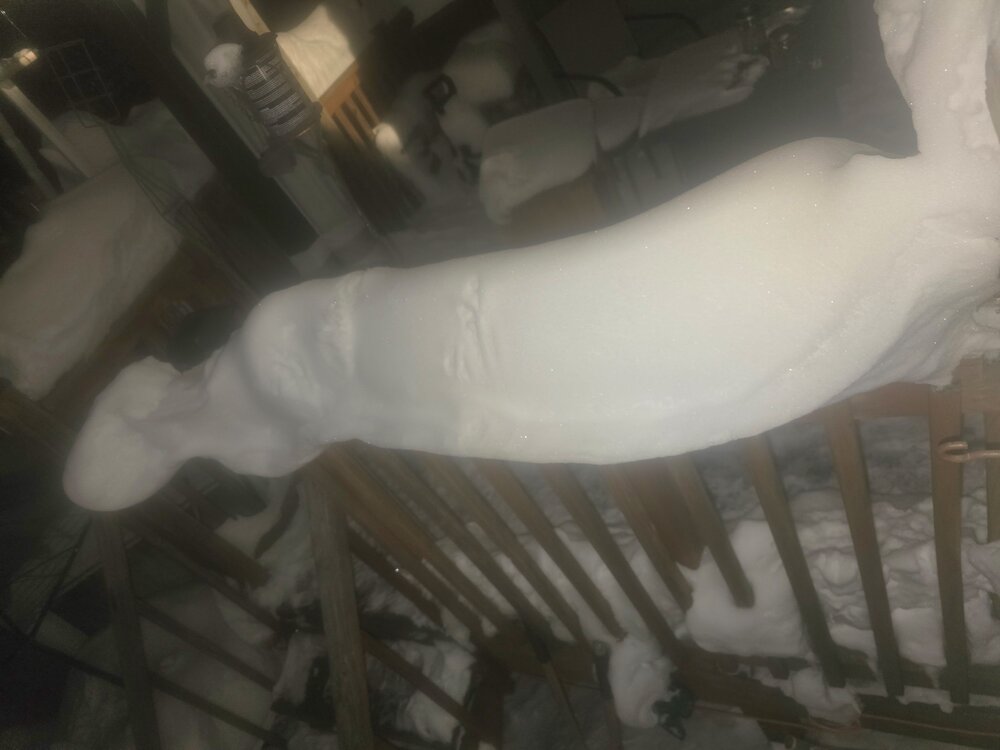
-

Clipper Fires In Wednesday Feb 25 Disco/ Obs
HoarfrostHubb replied to Damage In Tolland's topic in New England
BOX point and click mentions 2-4” I take the under -
That 21" in Andover looks little high/suspect. Here in Wilmington there was about 13"-14" (according to my best measurements) Wakefield had about 18" and the other spotter down Wilmington Road near Pinehurst had 15.2".
-

2/24 - 2/25 Clipper Obs (1 - 2" for many on forum)
Stormlover74 replied to Northof78's topic in New York City Metro
1/4" -
Big boys crying for their Mommas
-
Clipper Fires In Wednesday Feb 25 Disco/ Obs
HoarfrostHubb replied to Damage In Tolland's topic in New England
Yeah. I could see that in areas still digging out. I was referring more to Kevin’s mention of hill towns. -
temps dropped into the upper 20' s in nyc during the height of the storm.
-
"Don’t do it" 2026 Blizzard obs, updates and pictures.
Ginx snewx replied to Ginx snewx's topic in New England
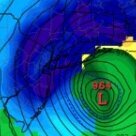
It came to Papa.thumb.png.61f8697b7bbd34a06ec3359183b9abc2.png)
-
Yeah the west slope gets probably on averages a solid 8-10” less per year than equivalent elevation on the east slope of ORH hills. The events you clean up really good in are those westerly component flow events at the sfc. They just aren’t super common. The SWFEs are always fun for most since they remove a lot of the orographic effects and it’s usually just latitude/longitude.
-
2/24 - 2/25 Clipper Obs (1 - 2" for many on forum)
WeatherGeek2025 replied to Northof78's topic in New York City Metro
1-2 starts at 530- ends around 9am -
"Don’t do it" 2026 Blizzard obs, updates and pictures.
Ginx snewx replied to Ginx snewx's topic in New England
My best titled thread ever. -

2/24 - 2/25 Clipper Obs (1 - 2" for many on forum)
Snowman92 replied to Northof78's topic in New York City Metro
What does it have for NE NJ -
Clipper Fires In Wednesday Feb 25 Disco/ Obs
Ginx snewx replied to Damage In Tolland's topic in New England
-
Would be 4th if they had counted the .15 qpf the fell after their final measurement...assuming 10-1. So lame. .
-

Central PA Winter 25/26 Discussion and Obs
Jns2183 replied to MAG5035's topic in Upstate New York/Pennsylvania
The historical Max and anomaly is March 1960. Maybe the month I dream about experiencing the most. In March 1960, the Northeast saw a relentless pattern that produced 7 distinct measurable snow events for the Harrisburg (MDT) area, totaling that record-setting cumulative amount. It wasn't just one "Superstorm"; it was a "parade" of systems that kept the ground white for nearly the entire month. Here is how that active March unfolded for Harrisburg: March 1960 Storm Timeline (Harrisburg/MDT) | Date | Snowfall Amount | Notes | |---|---|---| | March 3 | 10.5" | The primary "anchor" storm of the month. | | March 10 | 1.8" | A cold-sector clipper system. | | March 16 | 3.2" | Moderate overrunning event. | | March 17 | 3.0" | St. Patrick's Day system. | | March 22 | 2.0" | Late-season coastal influence. | | Minor Events | 2.1" | Combined totals from minor dustings (March 4, 7, 8, 21, 24). | | Total | 22.6" | (Catalog sum for distinct events) | Prior to this month that winter had produced 27" of snow, similar to us now. But March was notice to all the new decade was a different beast Sent from my SM-S731U using Tapatalk -

Outta gas and Outta Time: Early March Winter Storm finale
bncho replied to Ji's topic in Mid Atlantic


.png.661ac6a963ea787368083f10c5358321.png)