All Activity
- Past hour
-
People's expectations are also too high. I think our average is still below 80F. We shouldn't be seeing 90+ daily weather. In fact we're averaging AN after first 8 days of June.
-
Seems like summer to me...
-
The persistence of cloud cover the last several months is almost annoying as the high winds of the last several months, although that seems to be diminishing.
-
If averages are 80 then having highs in the 70s are not exactly jacket weather. It's still summer weather, just not 90 and humid.
-
-
I am still not seeing any signs of true summer on the models. Now looks more average to just below average moving through June. Forecast for ticks and mosquitoes looks to remain extra abundant!
-
Loop the models, it’s a weak low going well south. But any clouds and rain at this point will piss us off lol.
-
I don’t see a coastal on any model.
-
I dunno, the AFD is calling for a coastal.....
-
Which models are better at this?
-
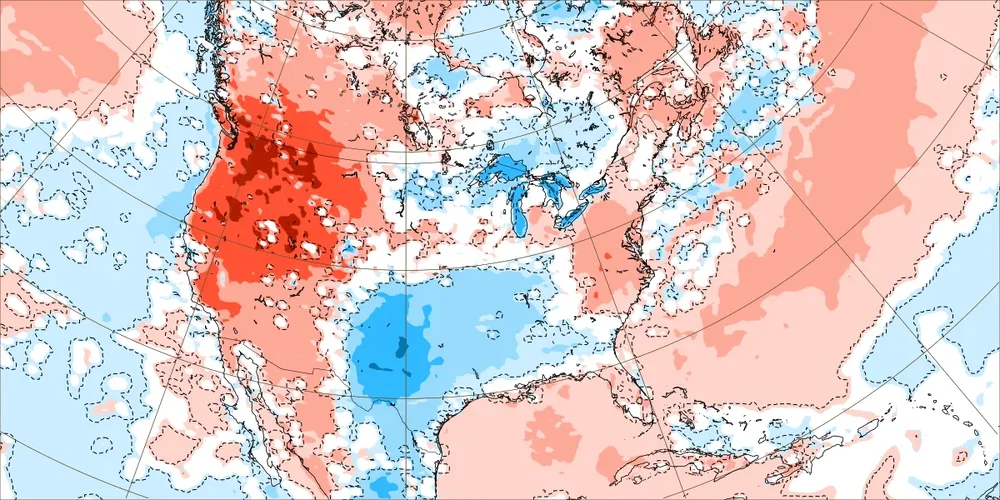
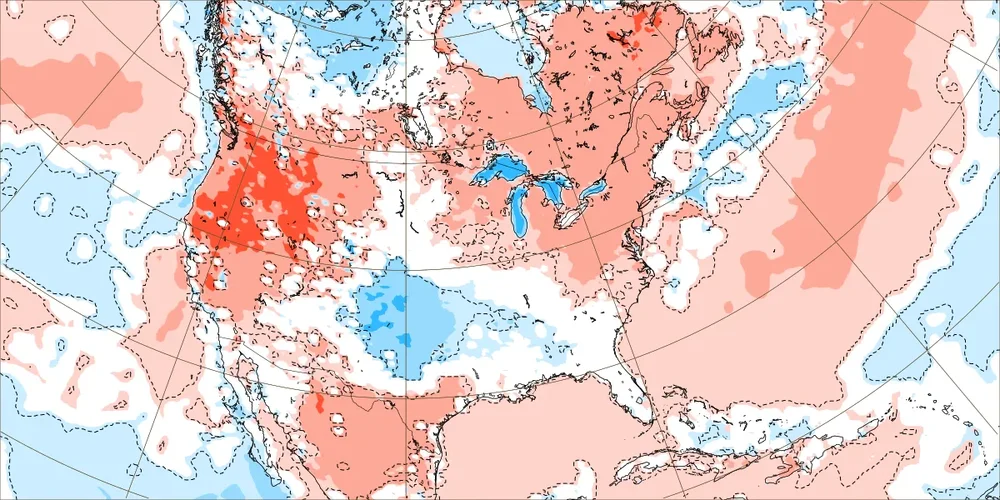
Rainy patterns have been the only way that we have avoided heat during the summers since 2010. Closer to average summer temperatures have been associated with wet onshore flow patterns. So it’s no surprise that the models have less heat going forward than earlier runs. But this introduces the risk of flooding when the systems or storms stall out. We have been seeing this pattern to our north since the start of May with 10”+. The real risk is that some spot gets 10”+ of rain in a few hours rather than spread out over a month during the summer into fall. This is when the severe flooding occurs like Southern CT and Suffolk County saw last August. June 9 to 16 more onshore flow and showers than originally forecast leading to very comfortable June temperatures. New run Old run
-
Nope, I was just matching the years when you claimed the Philadelphia Airport was having a big heat island effect. I am happy to go further back. I extended my chart back to 1941, the origin of temperature data collection at the Philadelphia airport. The Philadelphia airport matches Coatesville fairly well until the big Coatesville station moves in 1946 and 1947, whose effect is clearly seen. Before the station moves, the Coatesville station was located in a built up section of the City of Coatesville. Roughly as warm as the Philadelphia Airport. Not representative of Chester County. The big heat island effect on this chart is in Chester County not Philadelphia. The reverse heat island due to the Coatesville station move to a more rural location. The West Chester station experienced a similar move to a cooler, less built-up, location in 1970. The 1970s are cool in your chart because of faulty analysis. If you correct for the station moves and other network siting changes over the years, like NOAA does, the 1970s don't stand out as a cool decade. Funny that you complain about heat island effects in Philadelphia but ignore them in Chester County.

-
It’s basically a WNW to ESE moving system with the low well to the SW. This time of year you don’t have the baroclinic processes to force precip well north and east. We’ll see. Maybe it’s a ribbon of clouds and some showers, but I could see many areas staying dry the further north and east you go.
-
Yeah, I have read that the ECMWF has been working on that. Use AI to bias correct the NWP OP and ENS model runs. But they say that it takes an enormous amount of computing power. I adjust the models manually after recognizing the biases. A stronger Southeast Ridge or Western Atlantic Ridge has been a regular model bias in the East than original forecasts. So systems which initially start out further south and end up more north. So we have to manually adjust for that when doing longer range outlooks. This was the main model bias during February 2025. On the Pacific side the Northern Stream has been verifying much stronger. This has lead to the long range models being too strong with the -EPO. So the ridge in that region usually ends up weaker than originally forecast. This was the case last December when the models missed the record +EPO vortex later in December.
-
"I am continuing to watch the chance for showers, once again poorly timed for the weekend - along with below average temps. This would make the 13th Saturday in a row across SNE with at least some rain. All the models show that chance for showers. I wouldn’t call it a washout yet…the Euro has an ensemble mean rainfall around 0.25”….the GFS is closer to 0.15”…the Canadian is wettest closer to 0.50”. "
-
Hopefully stein here and rain Union CT points S and W on Sunday.
-
Not sure I buy that yet. Looks lame.
- Today
-
There are plenty of examples. But generally speaking going back to the late 70's, progged snowstorms for the MA >24 hours out end up north. So that hasn't changed in all the years I've been following winter wx down here. 3/01 is the quintessential example.
-
I presume sometime it will, but when is the question.
-

2025-2026 ENSO
40/70 Benchmark replied to 40/70 Benchmark's topic in Weather Forecasting and Discussion
As long its weak, that isn't a big deal. -
Tell me you didn't just use 360 hr snowfall forecasts from operational models to try to prove your point. Please!
-
2025-2026 ENSO
40/70 Benchmark replied to 40/70 Benchmark's topic in Weather Forecasting and Discussion
There was a system in between the January snowstorm and the February blizzard of 1978 that was suppose dto be snow and ended up being rain. -
GFS says GWDLT

-
Calling for rain Fathers Day weekend. Seems we’re just locked into this pattern.
-
Certainly looks cool but I don't know where you're getting the washout from?