All Activity
- Past hour
-

2025-2026 ENSO
Stormchaserchuck1 replied to 40/70 Benchmark's topic in Weather Forecasting and Discussion
To test my theory of "evening out", let's see what the AAO does in the first half of August this year. This was last year: 2024 8 2 -3.455 2024 8 3 -4.415 2024 8 4 -4.459 2024 8 5 -4.338 2024 8 6 -4.279 2024 8 7 -4.152 2024 8 8 -3.808 2024 8 9 -3.399 2024 8 10 -3.415 2024 8 11 -3.595 2024 8 12 -3.506 2024 8 13 -3.395 2024 8 14 -3.511 2024 8 15 -3.040 Edit: It's suppose to hit +3 in the next few days, which it usually doesn't deviate from +1-2. Maybe there is a little bit of general time leeway too. -
There are a few studies that show a very strong tendency for 2nd year -ENSO winter’s to be -PNA dominant
-
Very pretty sunrise.
- Today
-

July 2025 Obs/Disco ... possible historic month for heat
mreaves replied to Typhoon Tip's topic in New England
I have a 4:30 tee time in north central VT. What are my odds of getting it in? 50/50? Lower? -

July 2025 Obs/Disco ... possible historic month for heat
Modfan2 replied to Typhoon Tip's topic in New England
Some hailers today; DIT with pics of hail mounds on the side of the driveway? -

July 2025 Obs/Disco ... possible historic month for heat
moneypitmike replied to Typhoon Tip's topic in New England
We can all enjoy tomorrow. Perfect. Independence Day Areas of fog before 7am. Otherwise, sunny, with a high near 78. Northwest wind 5 to 10 mph. -
2025-2026 ENSO
Stormchaserchuck1 replied to 40/70 Benchmark's topic in Weather Forecasting and Discussion
The roll-forward regression for February looks like what we saw mid-Winter last year.. big +NAO/-PNA. Last year also had a very big +AO May-July so it makes sense that it shows something similar -

July 2025 Obs/Disco ... possible historic month for heat
Chrisrotary12 replied to Typhoon Tip's topic in New England
Based on my 2 min assessment of today at 430a with burning watery eyes as the toddler attempts to get back to sleep following a stomach bug induced blowout of her pampers…. Much rather be in NNE. -
2025-2026 ENSO
Stormchaserchuck1 replied to 40/70 Benchmark's topic in Weather Forecasting and Discussion
Jan - March 6-8 months after a +AO July Looks like there is tendency for a -EPO March. -
Thanks Roger! Very interesting. Fun contest. Good to see everyone doing pretty well.
-
2025 Atlantic Hurricane Season
Stormchaserchuck1 replied to BarryStantonGBP's topic in Tropical Headquarters
Invest is 50% in the 7 day. -
Occasional Thoughts on Climate Change
Stormchaserchuck1 replied to donsutherland1's topic in Climate Change
I think Portland hit 116F.. not 100% sure though. -
2025-2026 ENSO
Stormchaserchuck1 replied to 40/70 Benchmark's topic in Weather Forecasting and Discussion
Just continuing with this insane +AO. This has been on of the most positive AO years May - July so far. Kind of reminds me of the 80s/90s. -

July 2025 Discussion-OBS - seasonable summer variability
Roger Smith replied to wdrag's topic in New York City Metro
The 1911 heat looks like this: July 2 __ 94 75 July 3 __100 77 _ max tied 1898 as record broken by 103F in 1966. ... all mins slightly below records set in 1876 (3rd) and 1908 (4th-6th) July 4 __ 97 77 _ max set record broken by 99F in 1919 (eventual 102F 1949) July 5 __ 97 77 _ max set record broken by 98F in 1919 (tied in 1955) (eventual 101F 1999) July 6 __ 98 77 (0.12") _ max set record tied in 1986 and broken in 1999 (101F) (then 2010 103F) July 7 __ 86 74 July 8 __ 81 70 ... looks like front pushed a little south then rebounded July 9 __ 92 69 July 10__ 99 78 (.02") _ max set record broken by 1936 (tied 1999) of 102F ... min was 1F lower than 1905 record tied 1910 79F, broken by 80F 1993) July 11__ 97 76 _ max set record broken by 98F in 1988 (97F again in 1993) July 12__ 90 78 _ min was 1F lower than 1905 record 79F still record today) July 13 __88 72 _____ It stayed relatively warm all summer without this level of heat, and rainfall picked up steadily through August, 1.52" rain 15th and 1.65" 25th, until record cool daytime values arrived Aug 30 and 31 (highs 62, 59; lows 56, 55) (4.61" rain in 2d) _____ Heat in 1919 followed rapidly some record cool nights June 29 (52F) and June 30 (53F). It was a hot spell of relatively brief duration. July 1 __ 90 60 July 2 __ 91 67 July 3 __ 97 72 July 4 __ 99 74 _ record to 1949 July 5 __ 98 78 _ record max to 1999 (was tied 1955) July 6 __ 89 72 (0.35") The rest of summer 1919 was not particularly hot (August quite cool, including record low 57F on 9th) and featured some heavy rainfalls at times. Sep 8 tied a record of 93F later broken by 97F in 2015. Oct 3 (87F) and Oct 29 (83F) are surviving records set in a warm October. Both 1911 and 1919 were followed by extremely cold Januaries in 1912 and 1920. -
Average scores of the regular entrants: Tom 69.3 _ implied average error 1.53 F hudsonvalley21 ... 68.2 (1.6 F) so_whats_happening ... 66.6 (1.68 F) RJay ... 65.4 (1.73 F) (some late pens so avg is really 1.6 F) Scotty Lightning ... 65.2 (1.74 F) wxallannj ... 64.4 (1.78 F) BKViking ... 64.1 (1.8 F) wxdude64 ... 63.5 (1.82 F) DonSutherland ... 63.4 (1.83 F) StormchaserChuck ... 61.6 (1.92 F) RodneyS ... 61.4 (1.93 F) Roger Smith ... 58.7 (2.06 F) Normal ... 55.0 (2.25 F) persistence ... 46 (2.7 F) What this tells us is, our forecast errors range from 1.5 to 2.1 deg on average (slightly larger because a few scores were inflated by max 60) and a random guess against normal would average 2.3 F, using the previous month's data has an average error (or average change) of 2.7 F. Anyone who could maintain a 1.0 F error average would currently be scoring 4200 (and all of us would be lower because there would have been no max 60 scores). Perfect forecasts would currently be scoring 5400.
-
I think the whole group are fairly close this year, you are 419 points behind the leader and a lot fewer behind middle of pack, but that 419 points is over 54 forecasts made, so an average of 7.8 points per forecast, a differential which implies a forecast error in relative terms of 0.39 F deg. There's more complexity than that but if the leader (Tom) is 0.39 closer on every forecast, that explains the differential. Probably it's really a spectrum of differentials ranging mostly from you being 1.5 better to him being 2.5 better, or similar. It's not a big difference, is it? To make up 419 points you would need two months of very accurate forecasts against the usual consensus here which is often good but not superb (this month overperformed in general). If you had two months where every forecast you made was 1.0 F better you would gain (in relative terms) 18 x 20 points (360). A slight complication is that a few months are scored on a more generous sliding scale if all forecasts are below a raw score of 60 or if the anomaly is bigger than 5 F deg. If you nailed those sorts of months (more likely in winter) you could make up a lot of ground very fast because if one person breaks 60, everyone else is stuck with their raw scores.
-

July 2025 Obs/Disco ... possible historic month for heat
Torch Tiger replied to Typhoon Tip's topic in New England
we're all hoping for a record-breaker, here... -

July 2025 Obs/Disco ... possible historic month for heat
WxWatcher007 replied to Typhoon Tip's topic in New England
Summah -
Ended the day with .69" from 3 different storms.
-

2025 Atlantic Hurricane Season
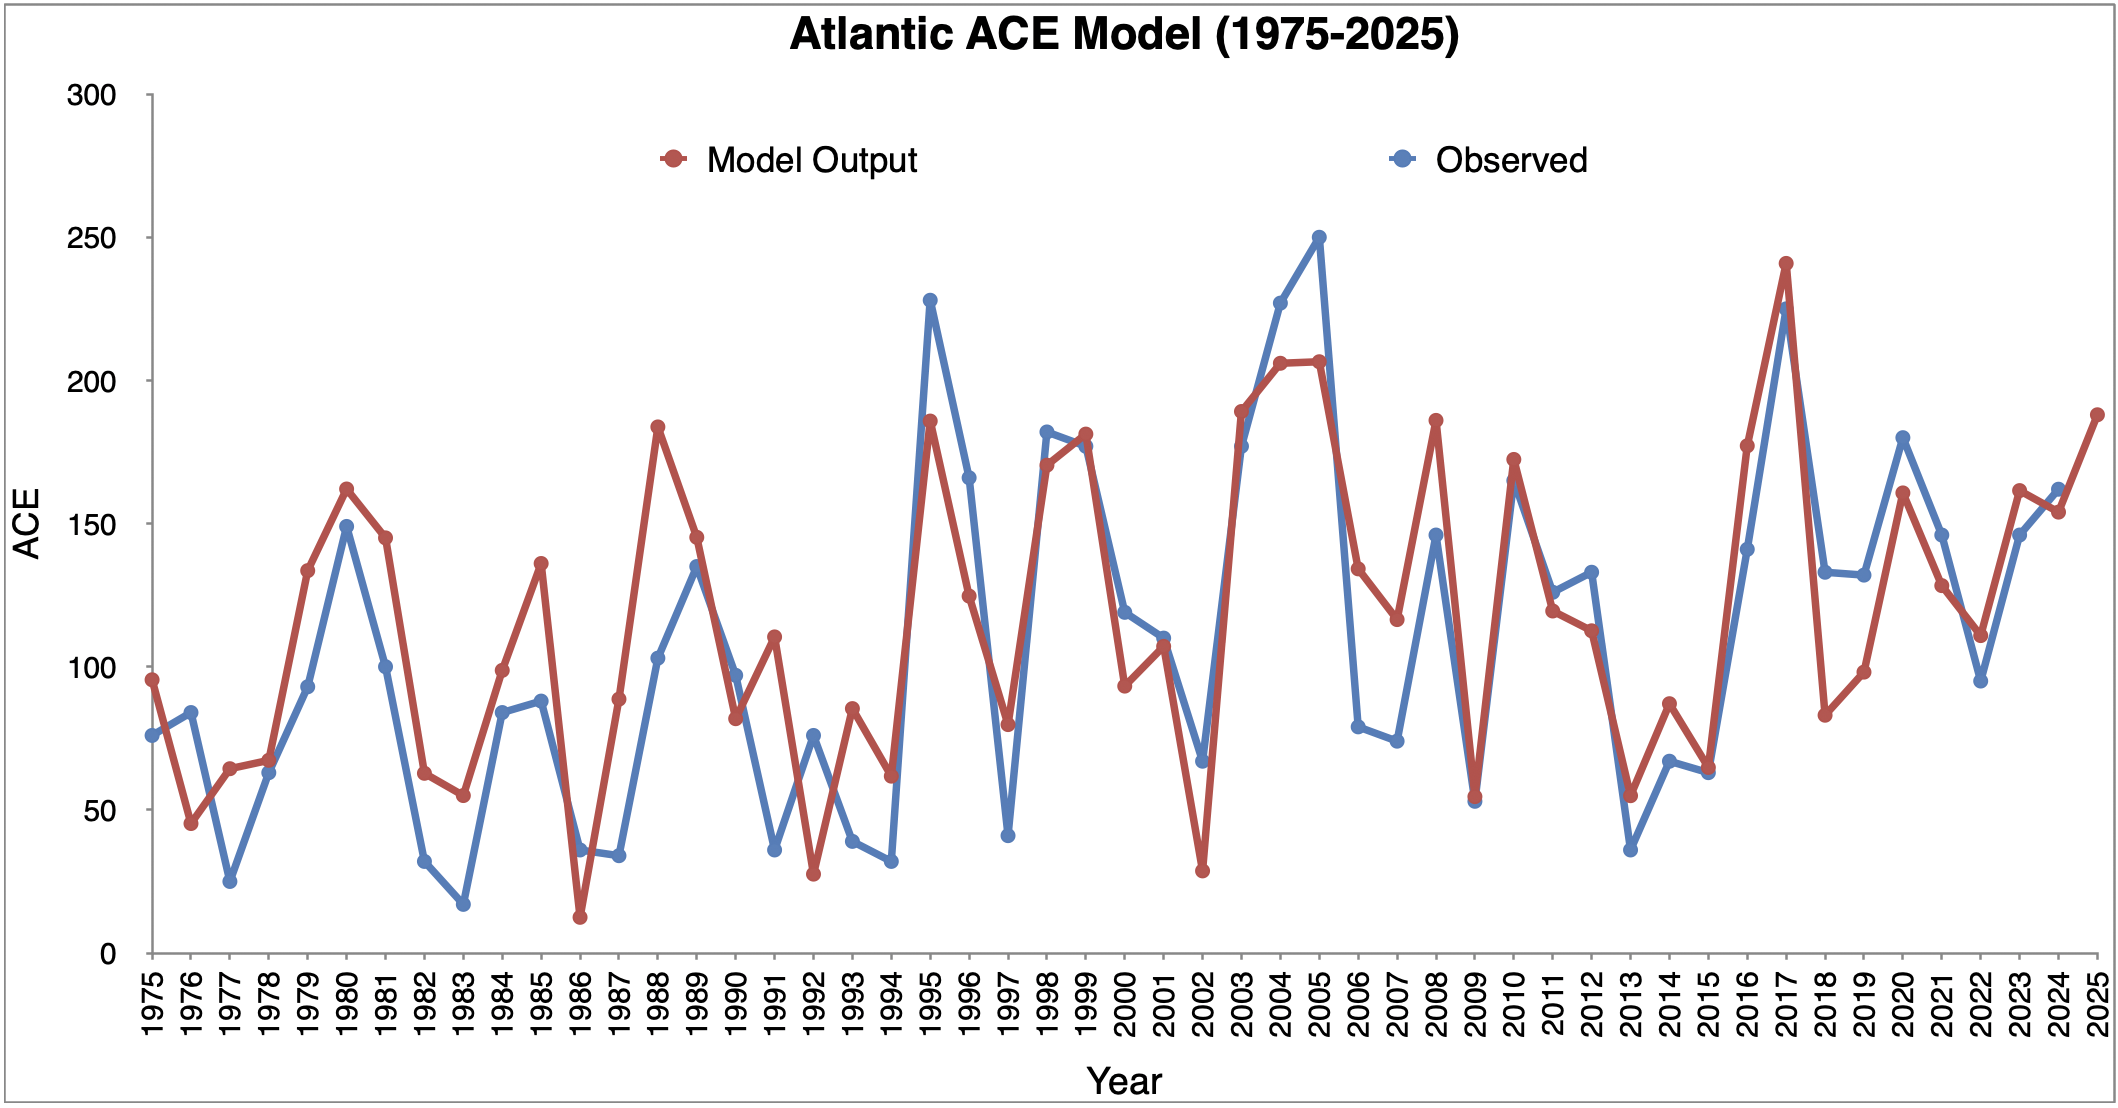
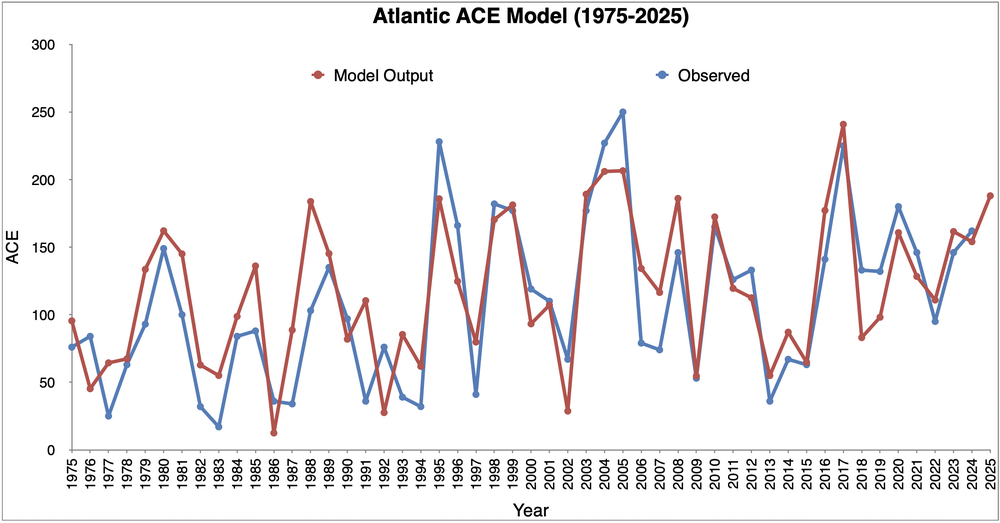
Supercane replied to BarryStantonGBP's topic in Tropical Headquarters
My Atlantic hurricane season forecast model predicts an ACE of around 188 (90% confidence it will be between 141-235). Notably, last year's forecast of 152 was very close to the observed 162, and much closer than what was forecast by CSU (230) and TSR (240) at the same lead time. The correlation is robust going back to 1975: Perhaps the more interesting question is where will the storms go? Obviously this is much trickier to answer, but based on how ENSO has evolved over the past 16 months, the best analogs are 1967, 1971, 1981, 1984, 1996, 1999, 2006, 2011, and 2017. As seen below, there are some trends in the tracks of all tropical storms and hurricanes in these years: Therefore, I would estimate an above-normal hurricane risk for the US East Coast, Antilles, and Western Basin, and slightly below-normal risk for the North Gulf Coast. To emphasize, this is just a general risk assessment and by no means rules out or forebodes a hurricane impact in any part of the basin.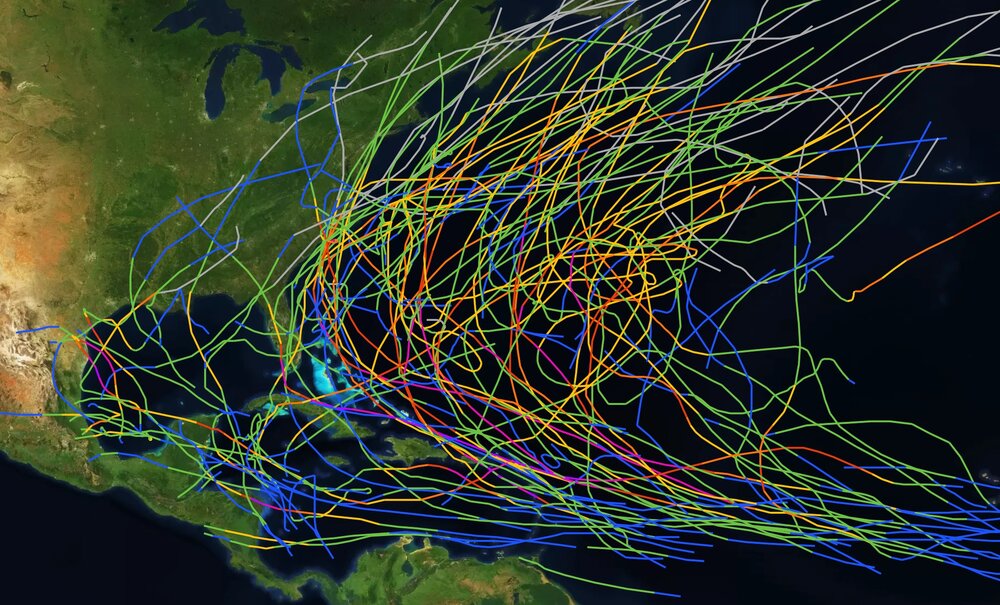
-

July 2025 Obs/Disco ... possible historic month for heat
RUNNAWAYICEBERG replied to Typhoon Tip's topic in New England
Perfect. -

July 2025 Obs/Disco ... possible historic month for heat
weathafella replied to Typhoon Tip's topic in New England
Looks like the 4th is kind of perfect. Warm enough to swim with comfortably dews. -

July 2025 Discussion-OBS - seasonable summer variability
SACRUS replied to wdrag's topic in New York City Metro
Dews on the rise 76/71 here up from 66 at 6pm -

2025-2026 ENSO
PhiEaglesfan712 replied to 40/70 Benchmark's topic in Weather Forecasting and Discussion
Since 2010, the only summers that were below the 1981-2010 average here at PHL were 2014 and 2023. However, June 2023 was significantly cooler than September 2023, and if you used JAS 2023 instead of JJA, it would have been above the 1981-2010 summer (JJA) average. JJA 2014 (75.7) finished .2F below the 1981-2010 average, and JJA 2023 (75.8) finished .1F below the average. JAS 2023 was 76.1F, which would have been above the 1981-2010 JJA average. -
July 2025 Discussion-OBS - seasonable summer variability
Roger Smith replied to wdrag's topic in New York City Metro
The peak was today, July 2nd still holds record highs on both max and min side (100, 82). The over-90 portion of the 1901 heat wave ran from June 26 to July 3. The highs and lows for those eight days were June 26 ___ 91 72 _ max was a record tied with three previous years until 1904,1909 tied 93, then 1923 had 94, 1943 and 49 96F, and 1952 100F (96F 1963 warmest since, 93F warmest recent 2003 and 2024. June 27 ___ 91 74 June 28 __ 93 75 June 29 __ 95 76 June 30 __ 95 60 _ max a record tied in 1931, broken 97F 1945 (eventual 99F 1964) July 1 __ 100 78 _ max is a record, min was a record until 79F in 2018 July 2 __ 100 82 (.03 in) _ both records today, max shared with 1966 July 3 ___ 94 76 (.31 in) suspect the 94 was early and it dropped during the day After 84/71 on the 4th, a record 3.07 inches of rain fell on the 5th (86/75) and 1.26 more on the 6th (77/74). It's pretty easy to visualize a stalled front being responsible for the heavy rainfalls. Then a second less severe heat wave lasted from July 14 to 24 (86 to 93 max, highest 21st). Several overnight lows were 76 to 78 F in that warm spell. A record low max of 69F was observed on July 26 then it warmed back to 92, 93 on July 29-30. Aug and Sep were close to average with a mix of warm and cool spells. July 1901 had a mean of 77.7 F and was 4th warmest July 1869-1901 and is now t39 of 157. Factoring in an increasing heat island it ranks 27th.