All Activity
- Past hour
-

Occasional Thoughts on Climate Change
TheClimateChanger replied to donsutherland1's topic in Climate Change
Interesting. @donsutherland1, do you find any evidence of a cyclical warming in the Phoenix data? Were the 1930s even hotter there, as seems to be insinuated here? -

July 2025 Obs/Disco ... possible historic month for heat
tamarack replied to Typhoon Tip's topic in New England
Mild TS finishing here, no strikes within ~4 miles, mostly light RA. Some 1" hail reported in N. Aroostook. -
Heck we might eventually get a warm as we were back in the 1930's in our current cyclical warming cycle.....
-

July 2025 Discussion-OBS - seasonable summer variability
Cfa replied to wdrag's topic in New York City Metro
A watch is basically an all-clear signal for LI. I feel like every severe storm (not many) I’ve experienced while living here has happened with no watch. 91/70, not bad. Holiday traffic is already ridiculous. -
Occasional Thoughts on Climate Change
TheClimateChanger replied to donsutherland1's topic in Climate Change
Don, I would also question the replicability of Shewchuk's graph, especially in recent years. I see no evidence of recent years being adjusted upwards, so that weird pause since 1998 makes zero sense. There have been plenty of recent years that have far exceeded 1998 (2012, 2023, 2024, etc.). It is worth pointing out that the redundant, higher quality CRN network was established in 2005 and shows slightly more warming than nClimDiv during the period of overlap. There is no evidence to suggest that recent data is being adjusted upwards. Looking at the rest of the graph, the magnitude of adjustments for TOBs and instrument changes looks to be of a reasonable magnitude. I know sometimes these graphics are manipulated by not factoring in gridding / proper areal averaging, which isn't an adjustment within the meaning of that term. Another common misrepresentation is to show only maximum temperature data. The MMTS bias adjustment is to lower older daytime maxima; however, the bias adjustment raises older minima. The net affect of these offsetting adjustments is negligable to Tavg trend. Here, it looks like Shewchuk uses Tavg, so I will say it doesn't appear to be as misleading as some of the stuff I have seen Heller and Martz publish. He does cutoff the analysis at 1925, because prior to that date [back to 1895], adjustments are minimal and I think it would ruin the presentation he wants to give that the warming results only from adjustments. Also, as I said previously, the recent data definitely looks off. Doesn't seem to jive with actual observations. Without that weird sudden dropoff post-1998 in the so-called "raw" data, the trends since 1960 would be quite similar in both the so-called "raw" and "altered" data. -

July 2025 Obs/Disco ... possible historic month for heat
weatherwiz replied to Typhoon Tip's topic in New England
The HRRR is making my life very difficult. I would love for good storms to end up through BDL but I have to go from Branford to Costco in Enfield then to Springfield and then figure out from there. But with how slow people walk in Costco and the 8 million people there I'll be in there for 8 hours. -

July 2025 Obs/Disco ... possible historic month for heat
WinterSnow replied to Typhoon Tip's topic in New England
I see storms beginning to form in NW CT. Oops, may have waited a little too late to get out and get things done. -

July 2025 Discussion-OBS - seasonable summer variability
LibertyBell replied to wdrag's topic in New York City Metro
the most consecutive 98+ days? -

July 2025 Obs/Disco ... possible historic month for heat
CoastalWx replied to Typhoon Tip's topic in New England
Good storm earlier here at the center harbor/Moultonboro line -

July 2025 Discussion-OBS - seasonable summer variability
winterwx21 replied to wdrag's topic in New York City Metro
Pretty dry out there -- dewpoint is down to 58 here. Temp is 90. Nice summer afternoon. -

July 2025 Discussion-OBS - seasonable summer variability
donsutherland1 replied to wdrag's topic in New York City Metro
As of 2 pm, Islip (6 days) and JFK Airport (8 days) have had more 90° or above highs than Central Park (4 days). The only time that occurred during an entire year was 2006 (Islip: 10 days; JFK Airport: 12 days; Central Park: 8 days). -
July 2025 Obs/Disco ... possible historic month for heat
weatherwiz replied to Typhoon Tip's topic in New England
The HRRR is beyond lost -

July 2025 Obs/Disco ... possible historic month for heat
Typhoon Tip replied to Typhoon Tip's topic in New England
Unless Rt 2 can roast it's way back to 86 or 87 this next round's liable to turn right and head down into CT and shade us with vils -
A few of the CAMs have some convection drifting south to Carroll, Baltimore, Harford, and Cecil counties this evening. Otherwise things look clear for us.
-
Northwest flow with high DCAPE and terrain assistance. Someone will get a solid storm.
-

July 2025 Obs/Disco ... possible historic month for heat
dryslot replied to Typhoon Tip's topic in New England
0.11", Pretty meh overall other then some lightning and some strong winds out ahead of the dying cells as it moved thru, Temps took a tumble into the low 60's, 64/61°F. -
July 2025 Obs/Disco ... possible historic month for heat
Typhoon Tip replied to Typhoon Tip's topic in New England
Severe watch issued #2 -
That’s consistent with this in the upper 300 meters within 180-100W:

-
July 2025 Obs/Disco ... possible historic month for heat
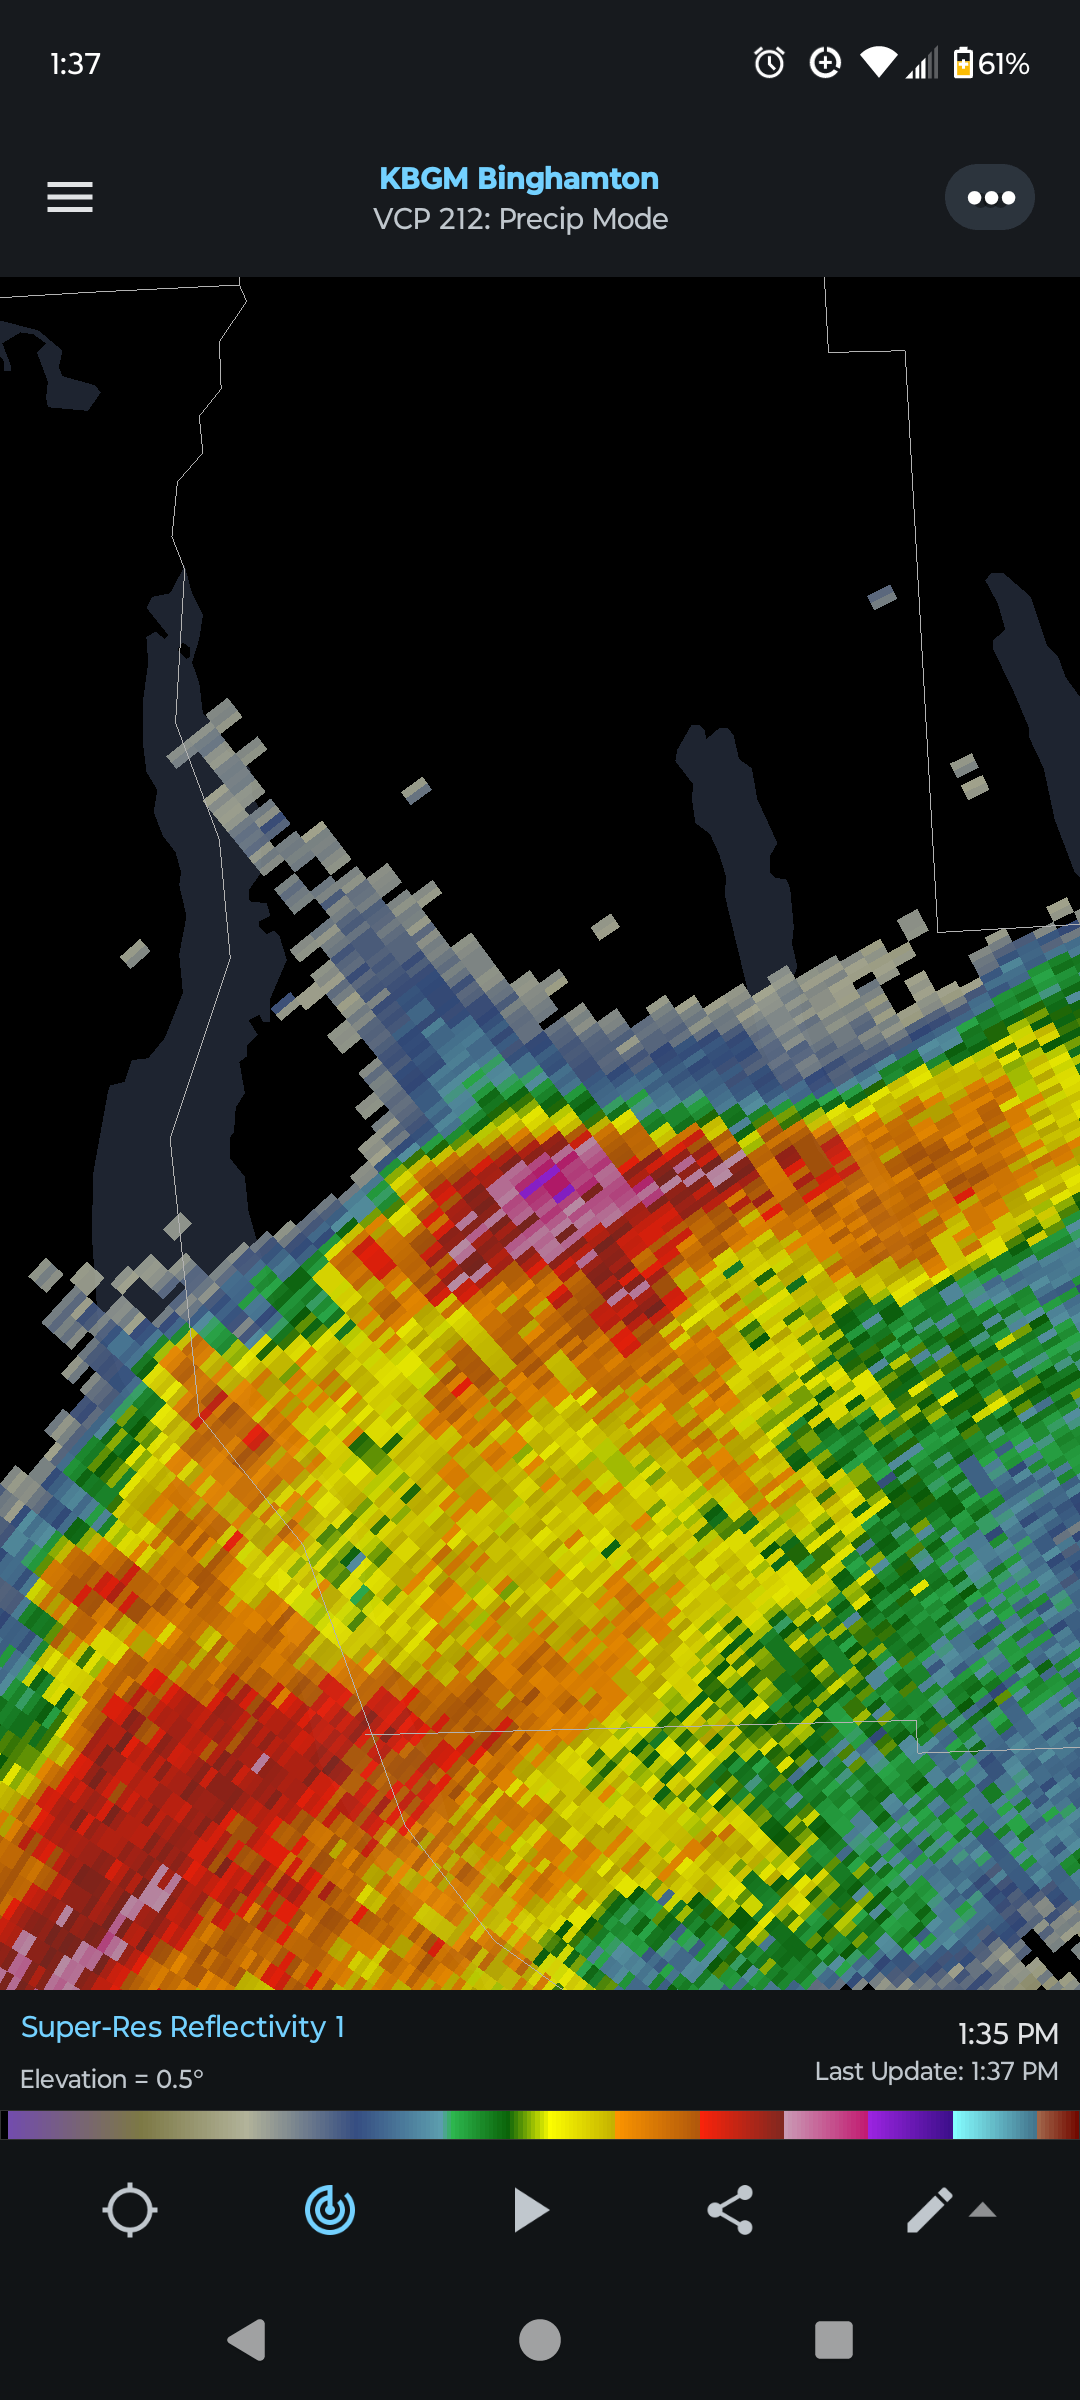
weatherwiz replied to Typhoon Tip's topic in New England
wow that is intensifying quickly. that's a nice inflow notch -
July 2025 Obs/Disco ... possible historic month for heat
weatherwiz replied to Typhoon Tip's topic in New England
Tornado warning near Ithaca -
You're in it!
-

July 2025 Discussion-OBS - seasonable summer variability
steve392 replied to wdrag's topic in New York City Metro
Severe thunderstorm watch issued for my area and all of NNJ northward into NY state. -
Lake breeze trying
-
Real?
-

July 2025 Discussion-OBS - seasonable summer variability
forkyfork replied to wdrag's topic in New York City Metro
hail spike in ny